I have been in the crypto space for 10 years, witnessing many people come and go. Some do not understand what they are trading for three or five years, while others realize the truth and start making money in less than half a year.
You may want to ask: how can one become the latter?
Let me say something very true: in the crypto world, complexity is useless; those who make money ultimately return to a single word: 'simplicity'.
I went from a capital of 200,000 to achieving financial freedom, having experienced losses, stepping on mines, and trying everything in mining!
The market is always changing, but the rules remain the same. Your only goal is to not be washed out in this process. If you feel lost, you might as well save this article as the starting point of your trading journey. It is not about getting rich quickly but about surviving at the table.
Friends, today I want to share with you the classic uses of K-lines. Once you master them, you will be more confident in your trading.
One, Left-Side Position Management
(1) Do not use all your bullets at once; buy in batches!!!
(2) You can divide your funds into several parts; when you are unsure of the bottom, buying in batches is the best way to average the cost price!!!
(3) Bottoms for averaging must be handled flexibly according to market changes; do not average too frequently, as that negatively impacts cost averaging. Entering 20%, 30%, or 50% is suitable for aggressive investors keen on bottom-fishing!!!
(4) Initial entry funds are relatively small; if the coin price does not rise but continues to fall, gradually increase the position, with the proportion of increased positions becoming larger, thus averaging the cost. This method has initially low risk, and the higher the funnel, the more substantial the profit!!
Two, Right-Side Position Management
(1) Buy 1: When the 5-day moving average crosses above the 10-day moving average, increase position by 30%!!
(2) Buy 2: When the coin price effectively breaks through the lifeline, and when it retests the lifeline, continue to increase by 30%, ensuring the total position at 60% at the early stage of the uptrend!
(3) Buy 3: Breakthrough the neck line or other important resistance levels, retesting and stabilizing again indicates that the reversal upward pattern is established, and increase by 20% again. The total position should reach 80%, keeping coins to wait for the upward move!
(4) Buy 4: When the coin price appears above the lifeline again with the 5-day moving average and the 10-day moving average golden cross, it is a typical signal to accelerate upward; at this point, the remaining 20% of the position should also be bought in time to maximize profits!!!
In daily trading, we often encounter phrases like 'the top has appeared', 'the bottom has broken', 'entering consolidation', which actually refer to K-line combination patterns.
If you want to master technical analysis, you must learn K-line patterns and become proficient.
In today's article, I will clarify all aspects of K-line patterns, including their uses, classifications, and key K-line patterns' methods, explaining each one clearly. This article provides a solid foundation for learning K-line patterns.
This article is full of valuable insights I have personally written. I suggest everyone save it for reading. If you gain something, please give it a thumbs up. Thank you.
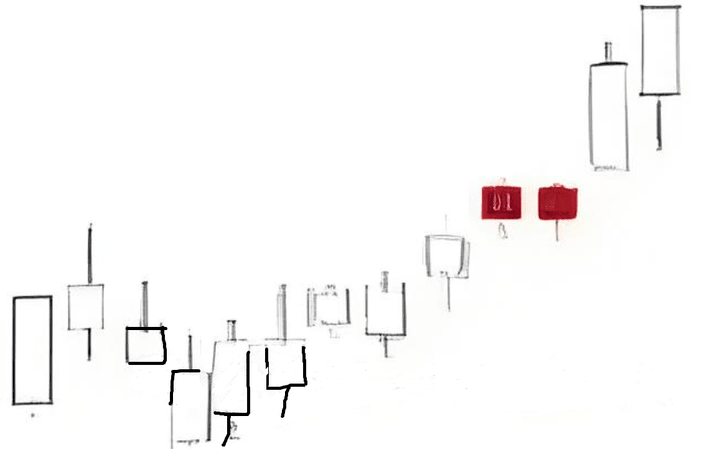
1. T-Line (Dragonfly)
Application Rules:
Look bullish at the bottom, look bearish at the top.
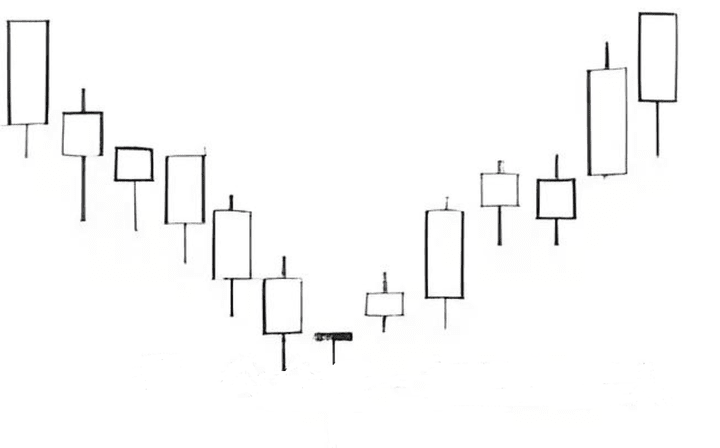
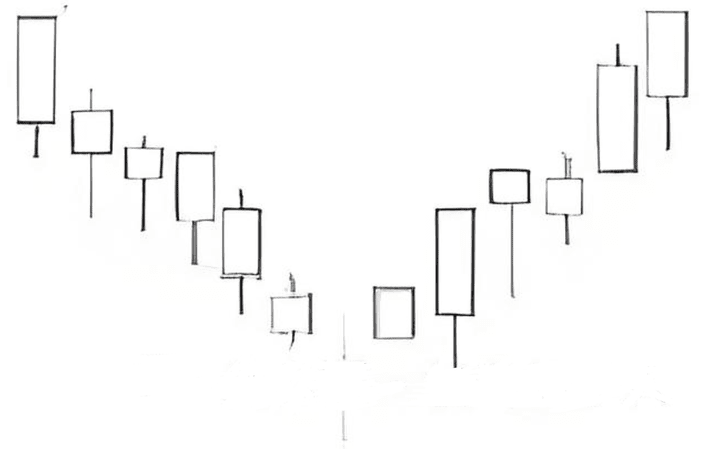
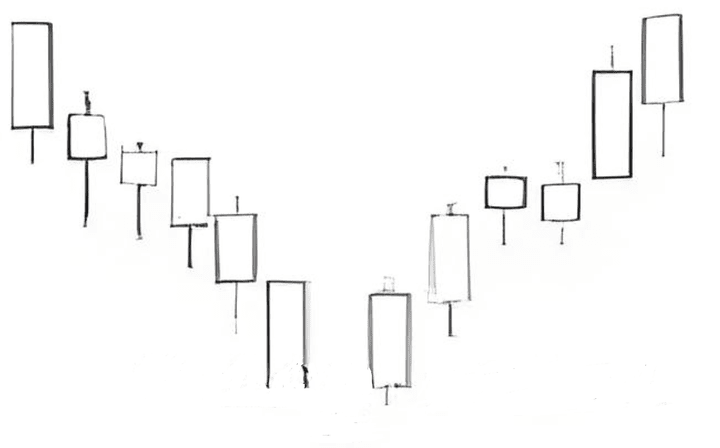
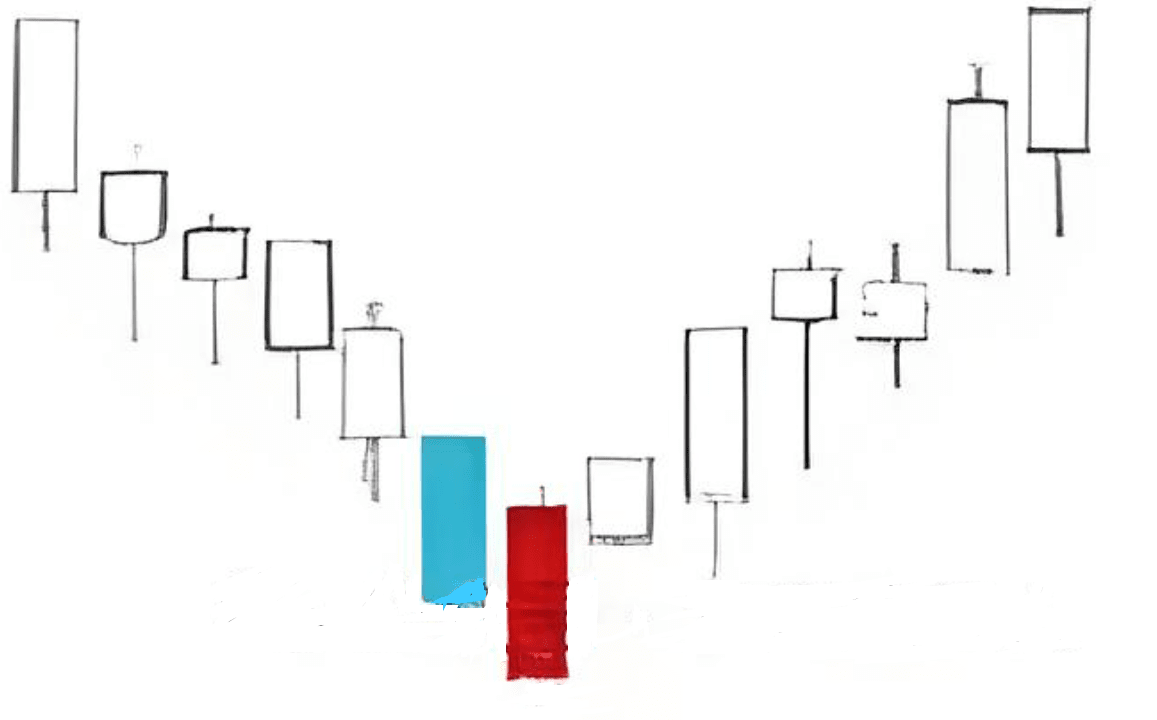
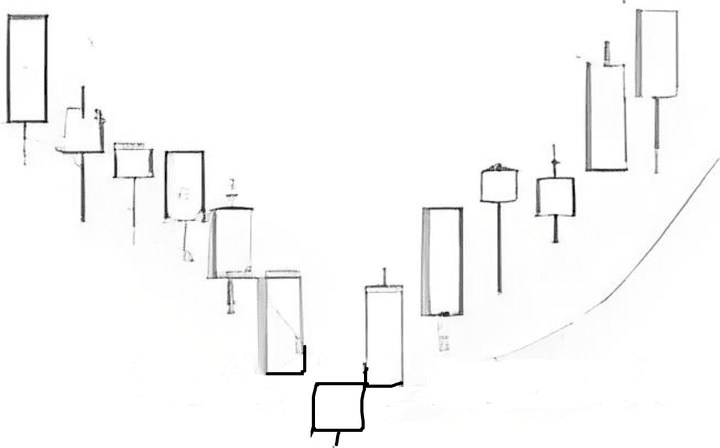
2. V-Reversal
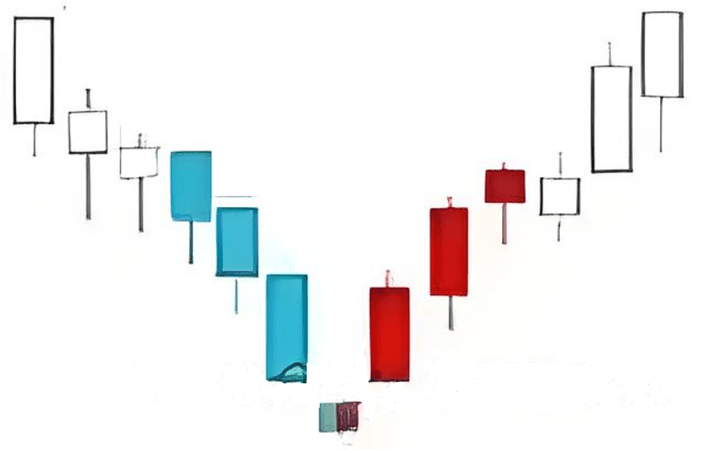
Application Rules:
Bottoming out, reversing upwards.
3. Long Upper Shadow
Application Rules:
1. A long upper shadow appearing at a high position in an upward trend, if trading volume increases, implies that bulls are aggressively chasing higher, but heavy selling pressure at high positions makes it difficult to push prices higher; the market is likely to reverse or pull back.
2. A long upper shadow appearing at a low position in a downward trend, if trading volume increases, implies that bulls are intervening, but cannot effectively curb selling pressure, indicating a gradual shift towards a balanced state between bulls and bears.
4. Long Cross
Application Rules:
1. The cross line may constitute an important warning signal. The original trend pauses or reverses.
2. Only under conditions where a market does not frequently show cross lines does the cross line have significant meaning.
3. If there are long upper shadows or long lower shadows, it further suggests that the market is indecisive, providing greater insight into the original trend's pause or reversal compared to ordinary cross lines. Bottoming out, reversing upwards.
5. Long Lower Shadow
Application Rules:
1. A long lower shadow appearing at a high position in an upward trend, if accompanied by increased trading volume, implies heavier selling pressure, with eager buying, but a sense of bullish exhaustion.
2. A long lower shadow appearing at a low position in a downward trend, if accompanied by increased trading volume, implies panic selling but eager buying at low positions, indicating significant bullish intervention.
6. Water Lily
Application Rules:
A large bullish candle crosses above three moving averages, changing them to a bullish arrangement, indicating a bullish outlook.
7. Large Bullish Candle
Application Rules:
1. A large bullish candle appearing in an upward trend means the market is sharply rising.
2. A large bullish candle appearing in a downward trend means the market is sharply rebounding.
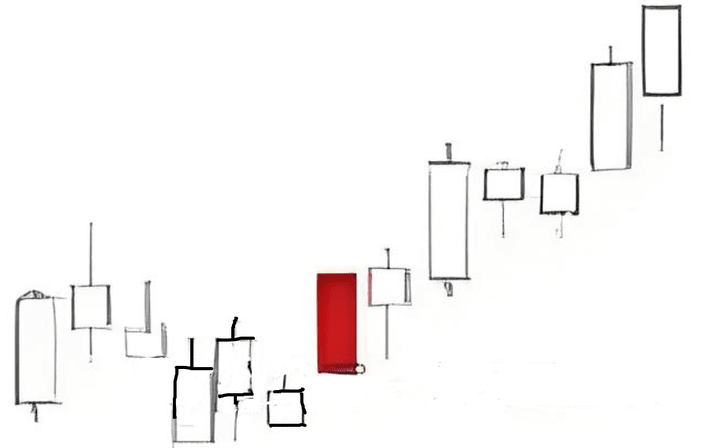
8. Large Bearish Candle
Application Rules:
1. A large bearish candle appearing in an upward trend means the market is sharply pulling back.
2. A large bearish candle appearing in a downward trend means the market is accelerating downwards.
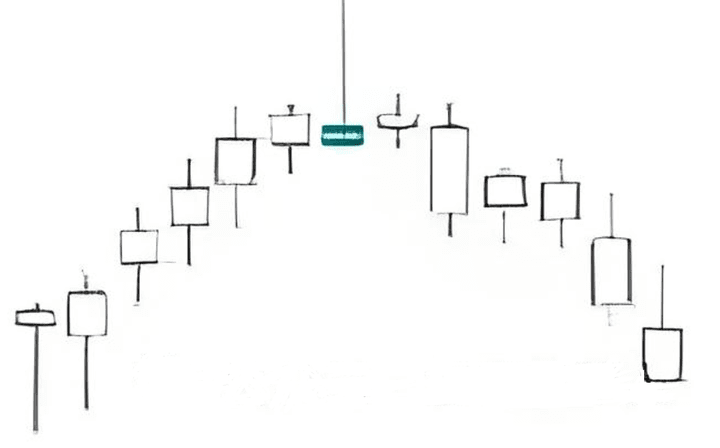
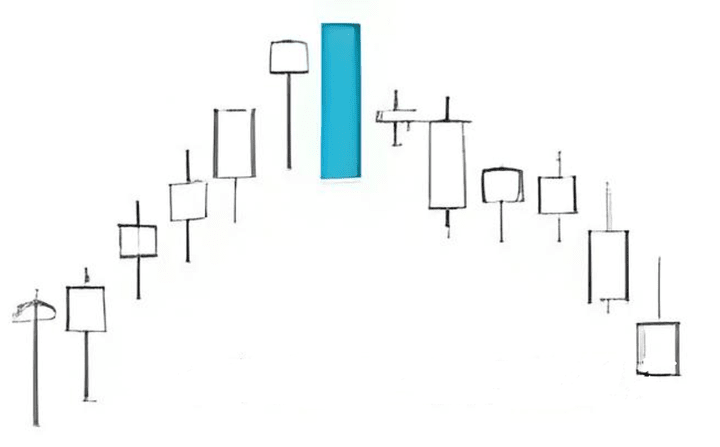
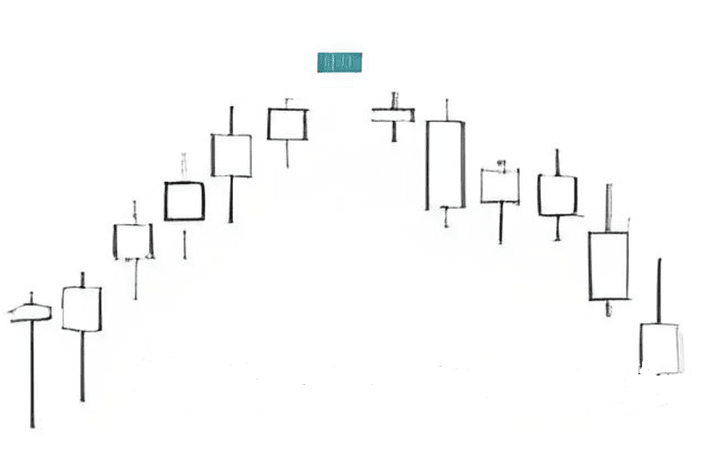
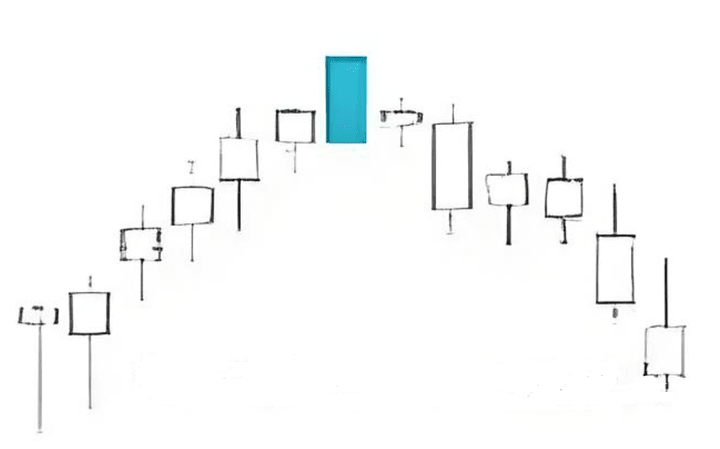
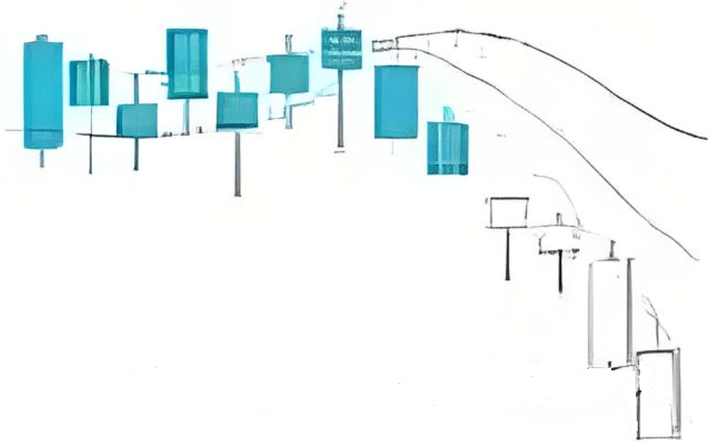
9. Inverted V-Reversal
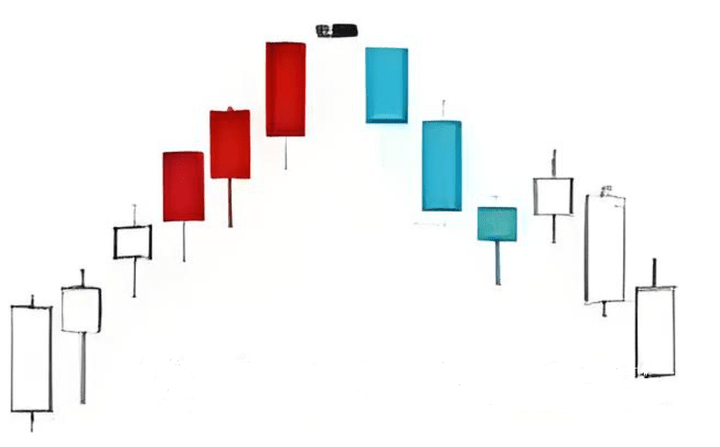
Application Rules:
Reversal pattern, indicating a bearish outlook.
10. Inverted Hammer
Application Rules:
If an inverted hammer appears after a downtrend, it forms a bullish K-line pattern, similar to a regular hammer. It is crucial to wait for the next time unit's bullish signal to verify the inverted hammer. The verification signal may take the form of the next day's opening price gapping up, exceeding the body of the inverted hammer. The larger the gap, the stronger the verification signal. It may also appear as a white K-line the next day, with its price at a higher level, completing the bullish verification signal.
11. Hanging Man
Application Rules:
1. If a hanging man appears after an upward trend, it forms a bearish K-line pattern.
2. When analyzing the hanging man, it is crucial to wait for the next time unit's bearish signal to verify it. The verification signal for the hanging man could take forms such as: the opening price the next day gapping down, with a larger gap indicating a stronger verification.
3. It may also take another form: if the next day is a black K-line and its closing price is below the body of the hanging line, a bearish verification signal is completed.
12. Stacked Bullish Cannon
Application Rules:
Overlapping Bullish Cannon, indicating extremely bullish prospects.
13. Stacked Bearish Cannon
Application Rules:
The repetition of bearish cannons greatly increases the likelihood of a short-term downward trend.
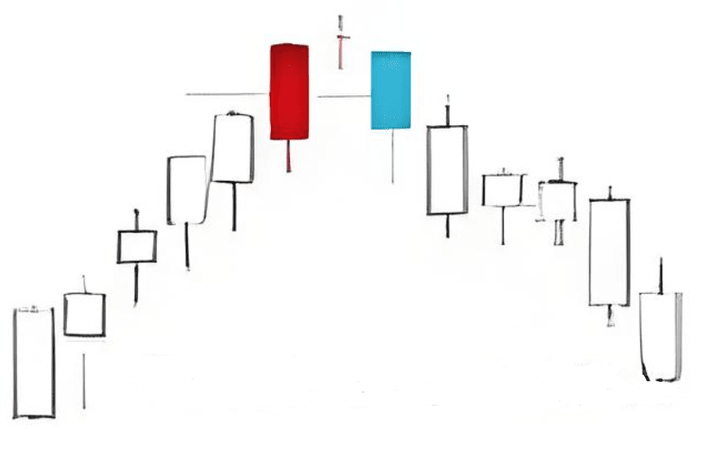
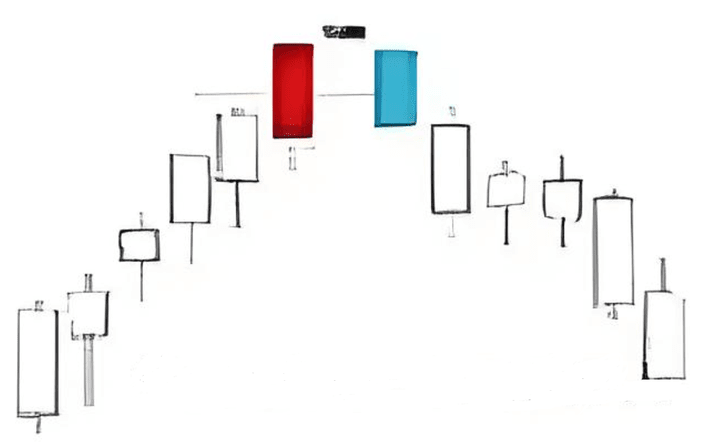
14. Top Cross
Application Rules:
Short-term top, indicating a bearish outlook.
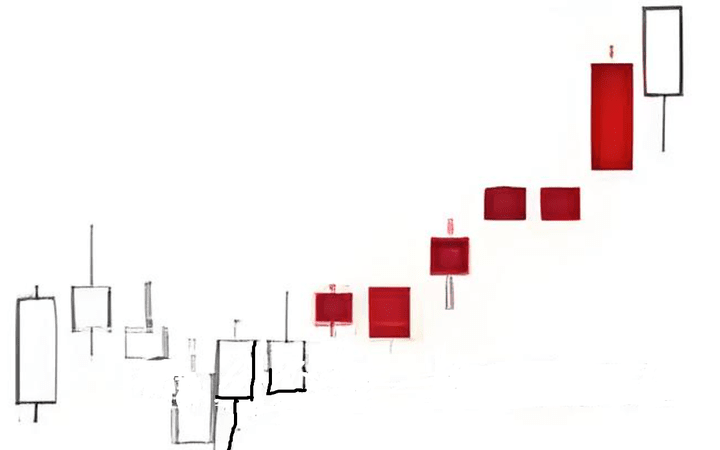
15. Eastern Red Large Bullish Candle

Application Rules:
Continuous bullish candles, if combined with moving average golden crosses, will indicate a bullish outlook.
16. Decapitation
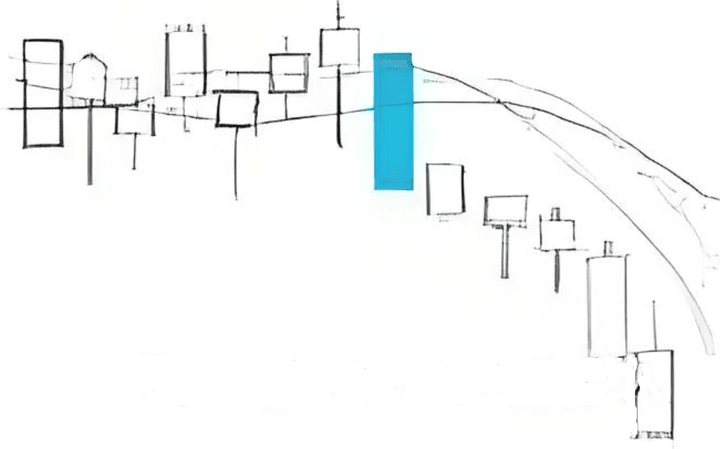
Application Rules:
A large bearish candle has cut through three moving averages, changing the arrangement to a bearish alignment, indicating a bearish outlook.
17. Bullish Cannon
Application Rules:
Strong bullish momentum, short-term bullish outlook.
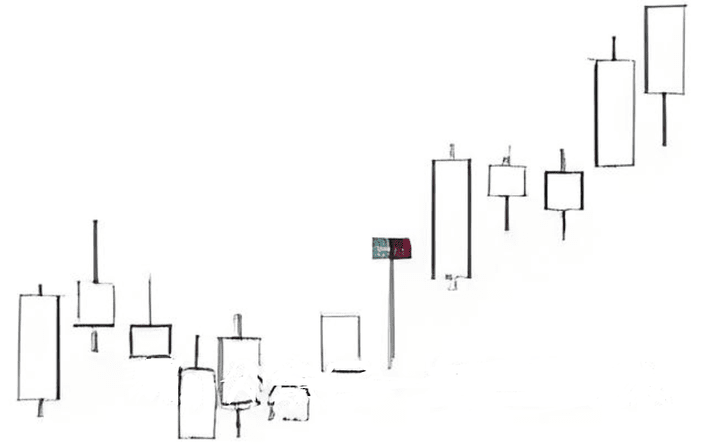
18. Dawn Appears (Counterattack Line)
Application Rules:
1. The counterattack line pattern appears in a downtrend that shifts from gradual decline to sharp decline, indicating the market will evolve into a V-reversal or a stop-loss sideways trend.
2. The strength of the counterattack line pattern is determined by how deeply the subsequent bullish candle penetrates the body of the bearish candle, meaning the deeper the penetration, the higher the likelihood of a reversal or stop-loss sideways trend.
19. Shooting Star
Application Rules:
The shooting star pattern indicates a strong bullish attack, with the specific strength determined by the size of the bullish candle body.
20. Shooting Star
Application Rules:
The shooting star pattern indicates a firm bearish selling pressure, with the specific strength determined by the size of the bearish candle body.
21. Evening Star
Application Rules:
1. The judgment rules for the evening star are the same as those for the evening star.
2. The evening star has more significance for trend pauses or reversals than the evening star.
22. Evening Star
Application Rules:
The key aspect of this pattern is the depth to which the black body of the third day's candle enters the white body of the first day's candle.
Here are some reference factors; if the evening star pattern has these characteristics, it helps increase the chances of it forming a reversal signal. These factors include:
(1) If there is a price gap between the body of the first K-line and the star line's body, and there is also a price gap between the star line's body and the third K-line's body;
(2) If the closing price of the third K-line deeply penetrates into the body of the first K-line (generally should be more than 50%);
(3) If the trading volume of the first K-line is relatively light while the trading volume of the third K-line is heavy.
23. Golden Spider
Application Rules:
Long, medium, and short-term moving averages golden cross, indicating a bullish outlook.
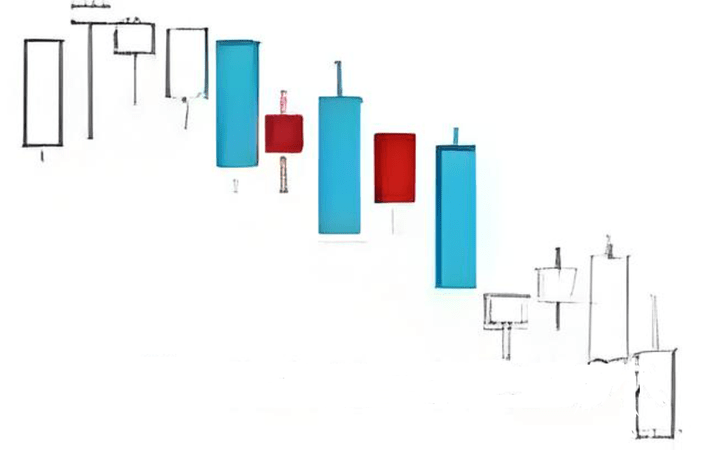
24. Nine Yin White Claw
Application Rules:
Consecutive bearish candles and moving average dead crosses appearing together signal a bad outlook for future trends.
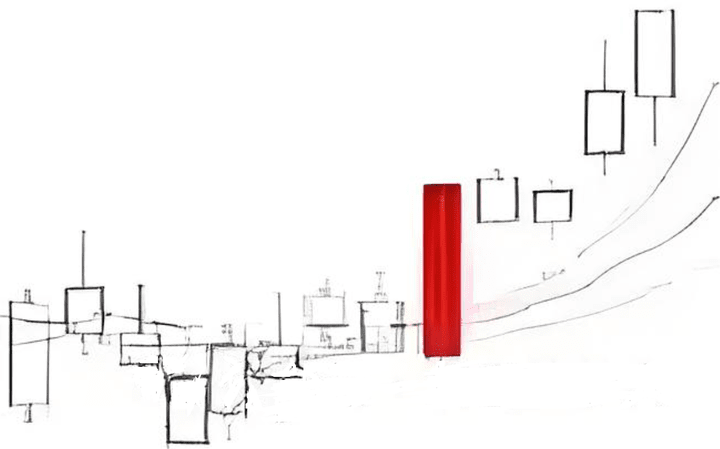
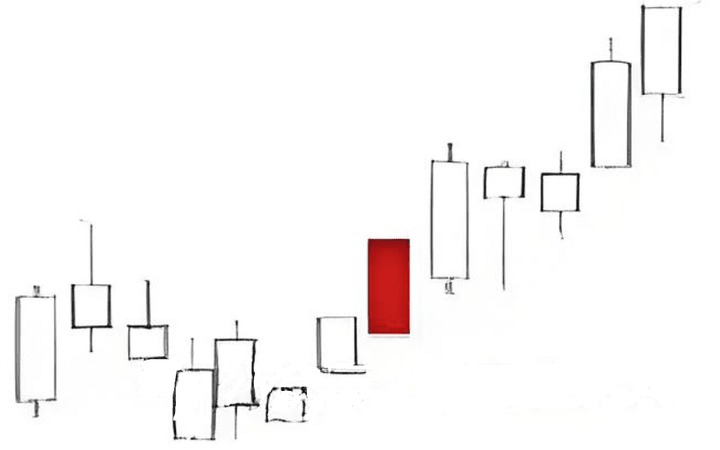
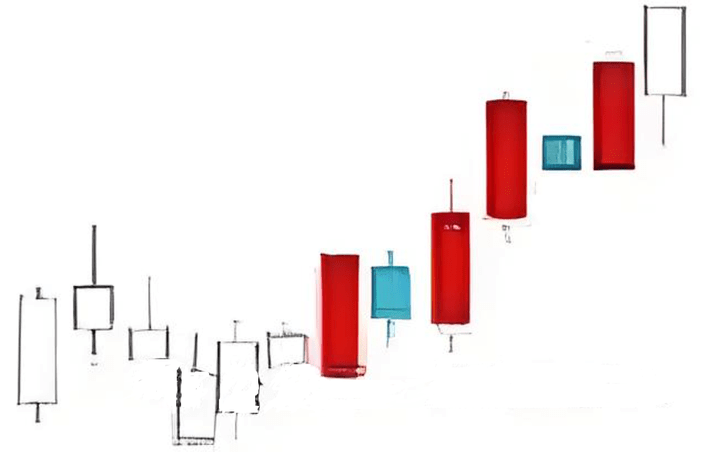
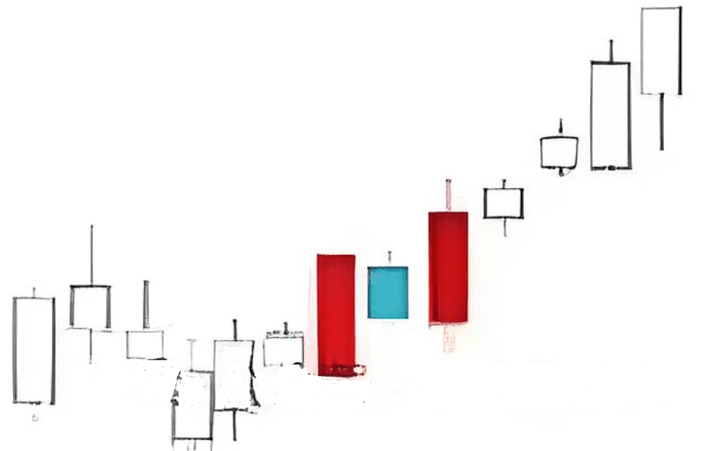
25. Sharp Rise with Red Bars
Application Rules:
Sharp Rise with Red Bars (Consecutive Bullish Candles) -- also known as "Consecutive Bullish K-line, Two Bullish Candles with Gap and Flat Bottom".
This pattern consists of two adjacent bullish candles that share the same opening price, with their bodies having nearly the same height.
In an upward trend, if a group of upward gapping consecutive bullish candles appears, it forms a bullish continuation pattern.
I will share another set of practical strategies I have developed over the years, achieving an average win rate of 80%, which is quite a rare achievement in the crypto trading world.
Enough talk; let's get straight to the valuable insights!
In two years, I turned 3000 yuan into over 10 million in glorious achievements, relying on this set (K-line patterns and MACD). If you read this article carefully, you will benefit for a lifetime!
Market Meaning
One, Market Meaning of Double Moving Averages
1. Position Meaning
The double lines above the zero axis represent a bullish trend, while below the zero axis they represent a bearish trend;
The double lines crossing above and below the zero axis serve as a basis for judging the current market trend.
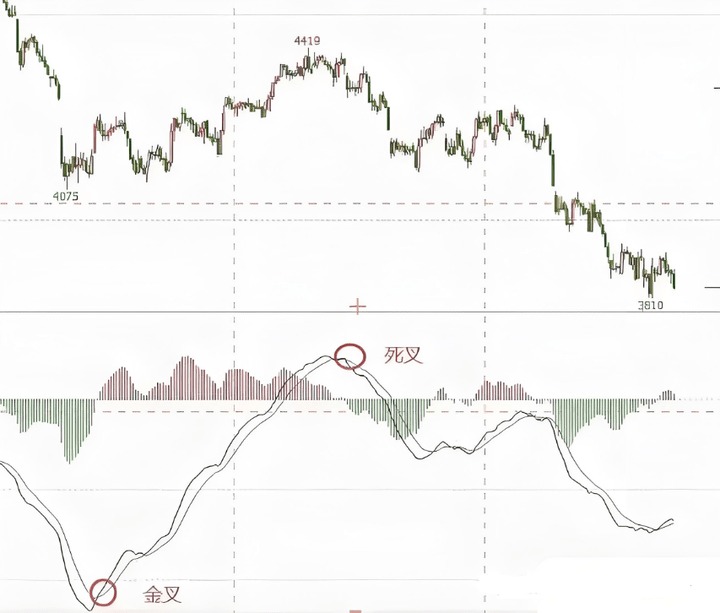
2. Double Line Crossover
Too many crossover dead cross signals occur in the short term; it's best not to use them in isolation.
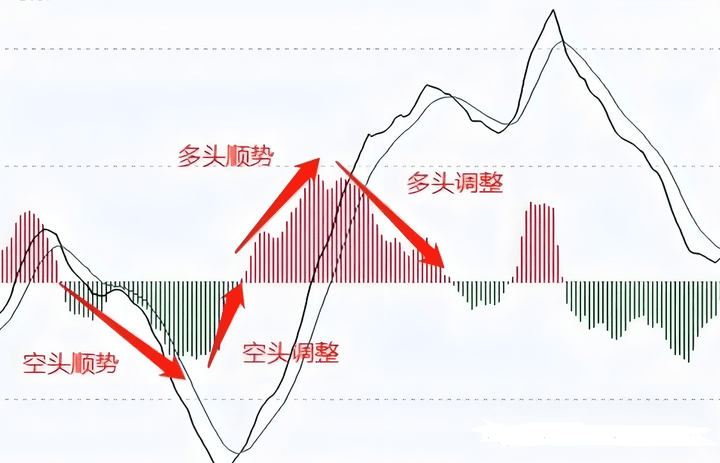
Two, Market Meaning of Volume Bars
Bull-Bear Water Divide:
The zero axis is the bull-bear divide; above the zero axis is bullish, below it is bearish;
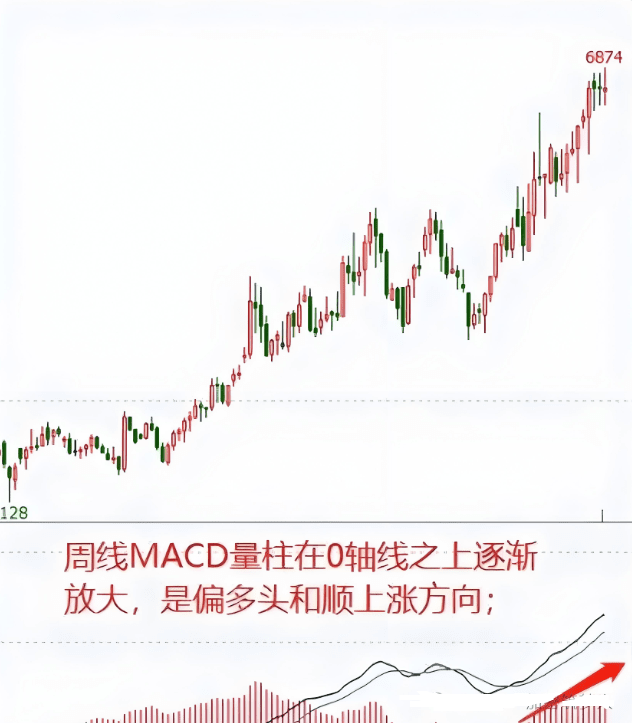
Bullish Trend:
The volume bar on the zero axis changes from small to large, indicating a bullish trend; the market shows an uptrend;
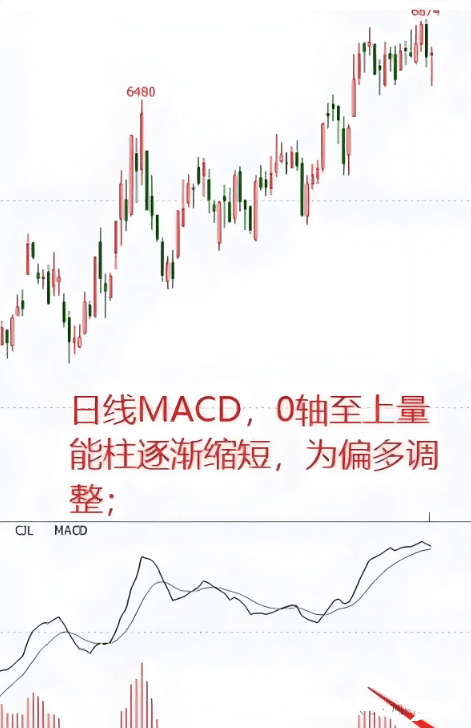
Bullish Correction:
The volume bar on the zero axis shrinks from large to small, indicating a bullish correction; the market shows an uptrend adjustment;
Bearish Trend:
The volume bar below the zero axis changes from small to large, indicating a bearish trend; the market shows a downtrend;
Bearish Rebound:
The volume bar below the zero axis changes from large to small, indicating a bearish rebound; the market shows a downtrend adjustment.
Comprehensive Meaning
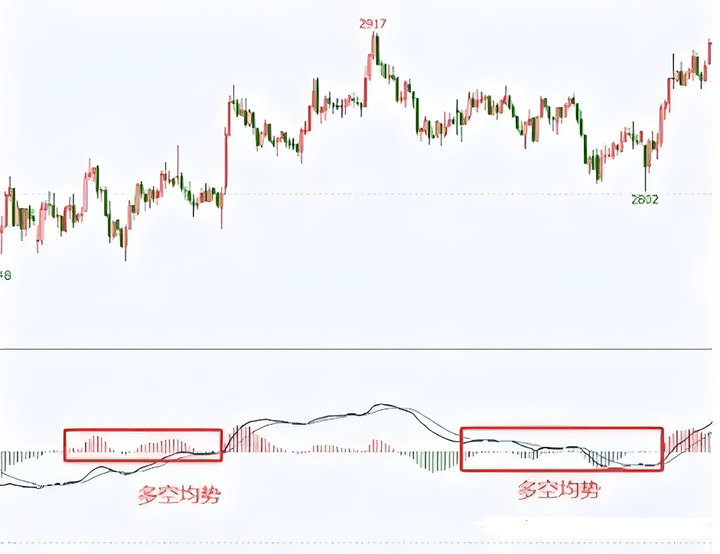
1. Bull-Bear Equilibrium
Moving averages are close to the zero axis and oscillate around it, with volume bars showing scattered small amounts; at this time, the market is likely to show volatility.
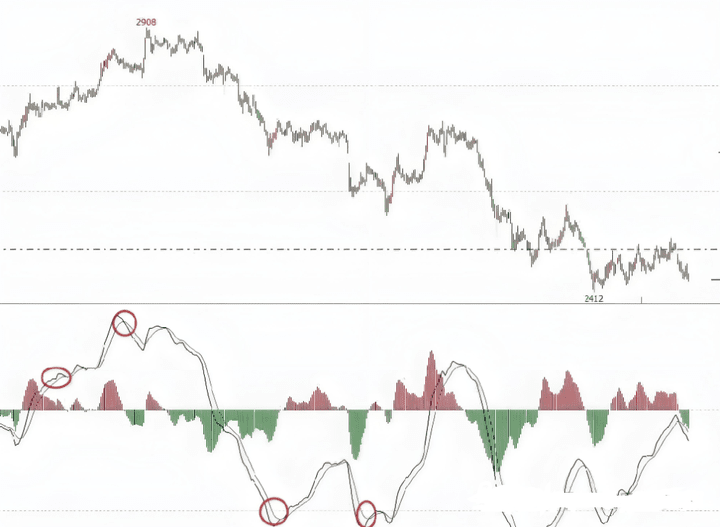
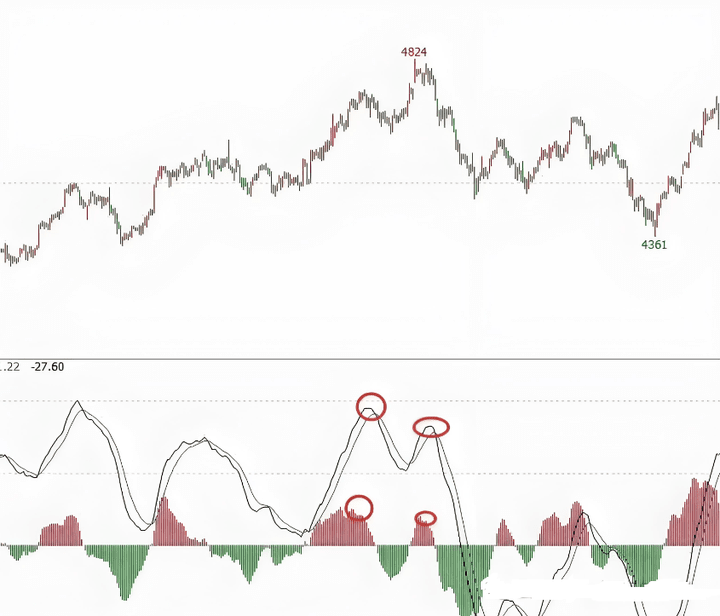
2. Divergence
Divergence is a signal of momentum exhaustion. Effective divergence refers to the simultaneous divergence of double lines and volume bars.
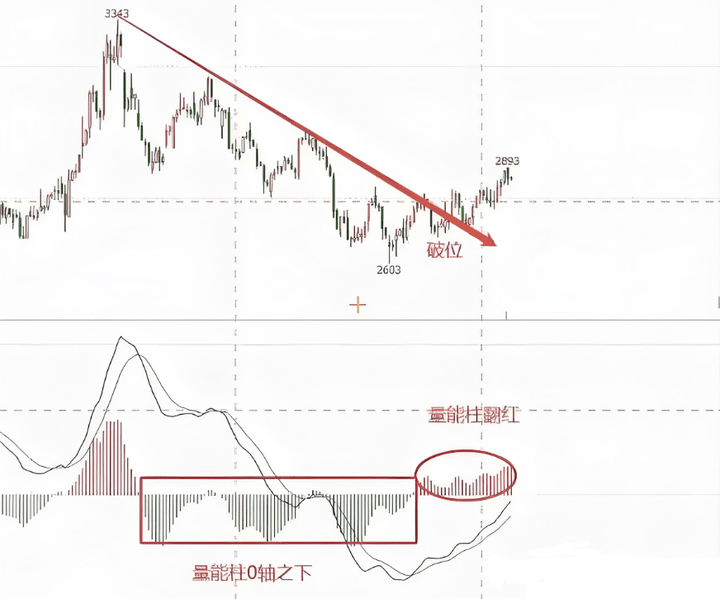
3. Trend Continuation
Trend up + volume bars always above the zero axis indicate continuation of the upward trend; trend down + volume bars always below the zero axis indicate continuation of the downward trend.
"MACD" 8 Major Entry Points
One, Chan Theory First and Second Class Buying Points
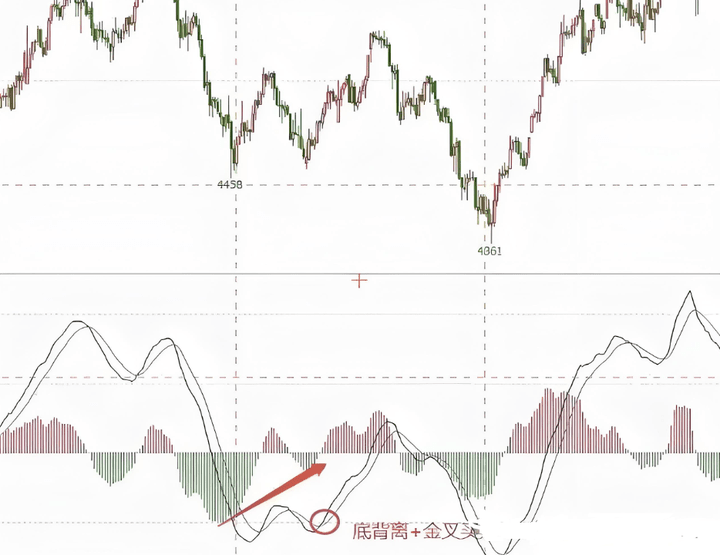
First Class Buying Point
Trading Principles:
Bottom divergence + golden cross as a buying point;
Top divergence + dead cross as a selling point.
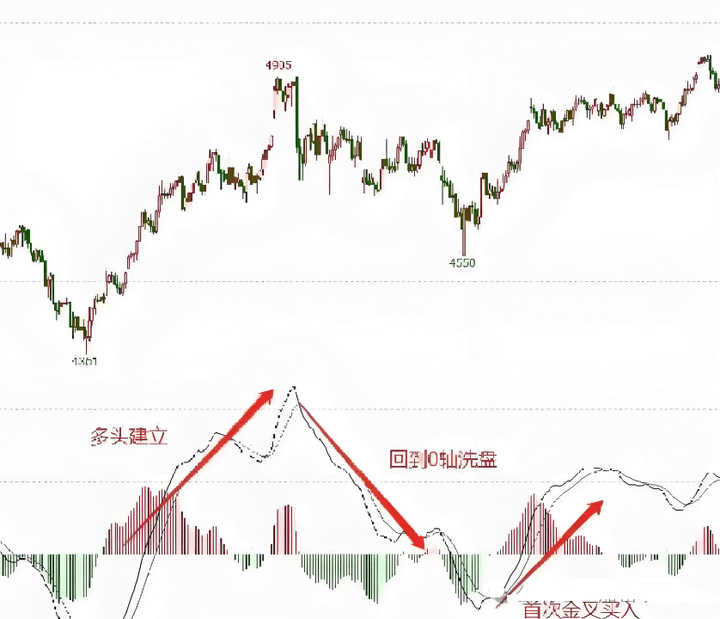
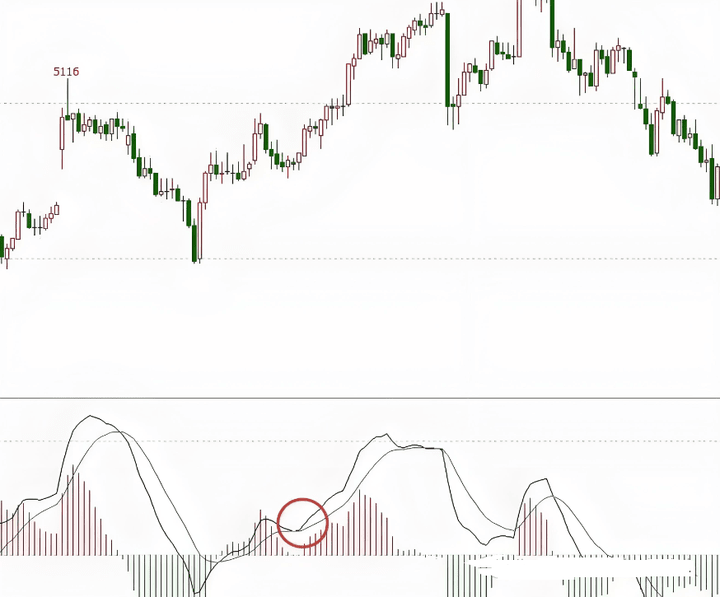
Second Class Buying Point
Trading Principles:
Double lines first running above the zero axis;
The double lines first pull back to the vicinity of the zero axis;
Then the golden cross forms on the zero axis for buying.
Two, Trend Judgment Trading Method
Trading Principles:
Long-term trend assessment;
Short-term entry.
From the weekly and daily analysis, the long-term trend is bullish, while the daily line shows a short-term correction. Our trading strategy is that if the daily line is short, it can only be a correction, or wait for the daily line to struggle before following the weekly line to go long.
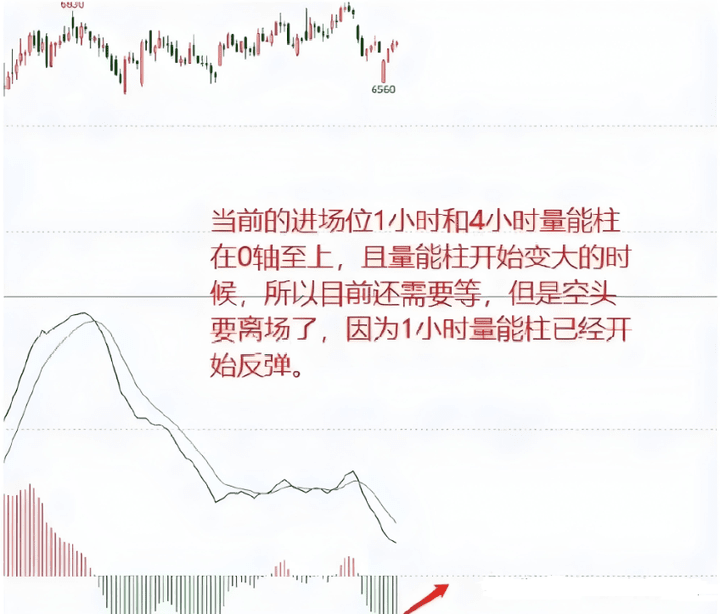
We can find entry points in smaller timeframes, such as 1 hour or 4 hours.
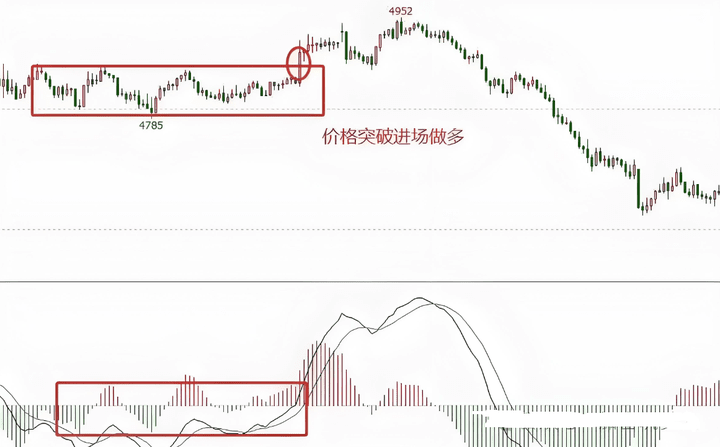
Three, Energy Bar Position Trading Method
Trading Principles:
Moving averages are close to the zero axis and oscillate around it;
Volume bars show scattered small amounts;
Enter when a price breakthrough occurs.
The MACD indicator volume bar is shrinking, and the moving averages are winding around the zero axis, indicating a state of balance between bulls and bears, consistent with the K-line's consolidation and fluctuations, indicating an energy accumulation and buildup pattern.
Thus, when the MACD indicator volume bars show a pattern consistent with classic K-line patterns, such as triangles and flags, once a narrow range of fluctuations is broken, it often represents a good opportunity.
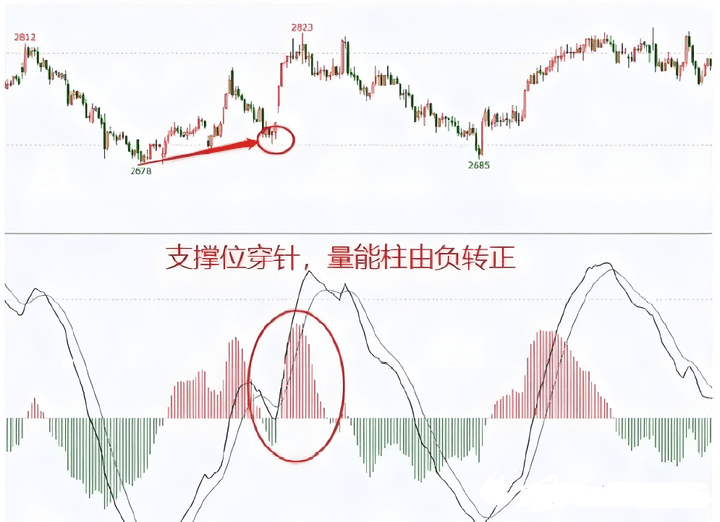
Four, Key Position Trading Method
Trading Principles:
Key Support and Resistance Levels;
K-line shows a piercing signal;
Volume bar moves from positive to negative, indicating a short position;
Volume bar moves from negative to positive, indicating a long position.
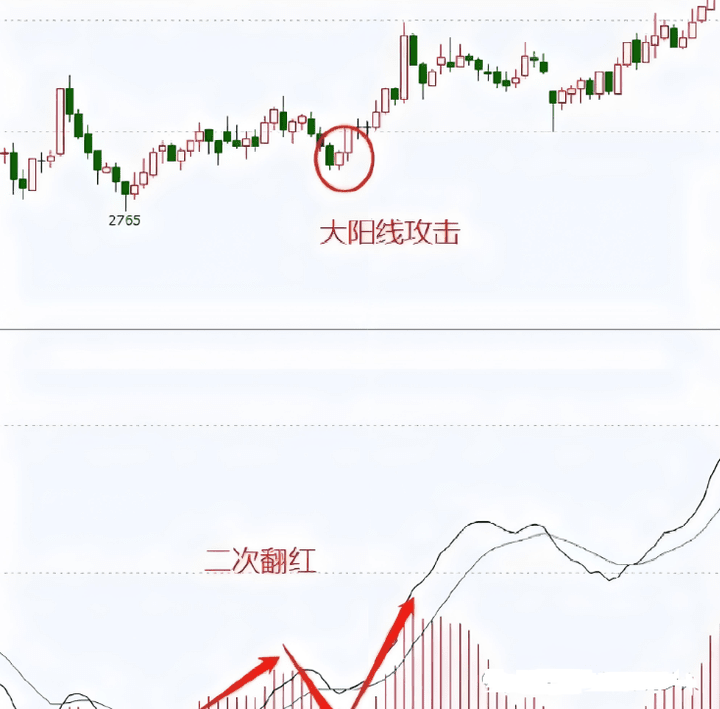
Five, Secondary Red-Green Trading Method (Aerial Refueling Signal)
Trading Principles:
The first wave's volume bar should not be too large or too small. It should correspond to the K-line price pattern, ideally in an attacking formation;
The first wave's positive volume bar gradually increases then decreases, but shrinks to a certain extent without turning negative; rather, it continues to expand positively in a gradually increasing shape.
Six, Buddha Hand Up
Trading Principles:
After the double lines golden cross, follow the upward movement of the commodity price, then the price corrects;
After the double lines return to the vicinity of the zero axis, the DIF line immediately turns upward, forming the Buddha Hand Up pattern.
Seven, Main Uptrend Trading Method
Downtrend Main Uptrend Trading Principles:
The MACD volume bars have been above the zero axis, and the price has experienced a sustained increase;
The MACD volume bar first appears below the zero axis, indicating a correction in wave 1;
The volume bar of wave 2 is less than that of wave 1;
During the wave 2 correction, when the MACD volume bars shorten or expand again, enter a short position for wave 3.
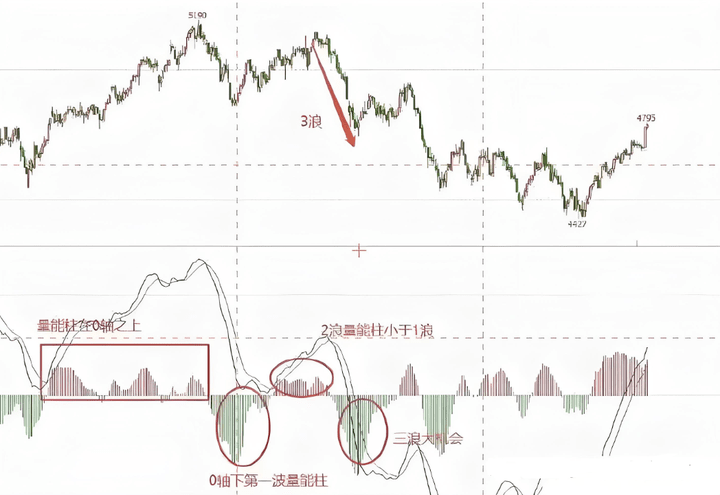
The same applies to the main uptrend.
Eight, Divergence + Pattern Trading Method
Trading Principles:
MACD shows divergence;
Trend breakout.
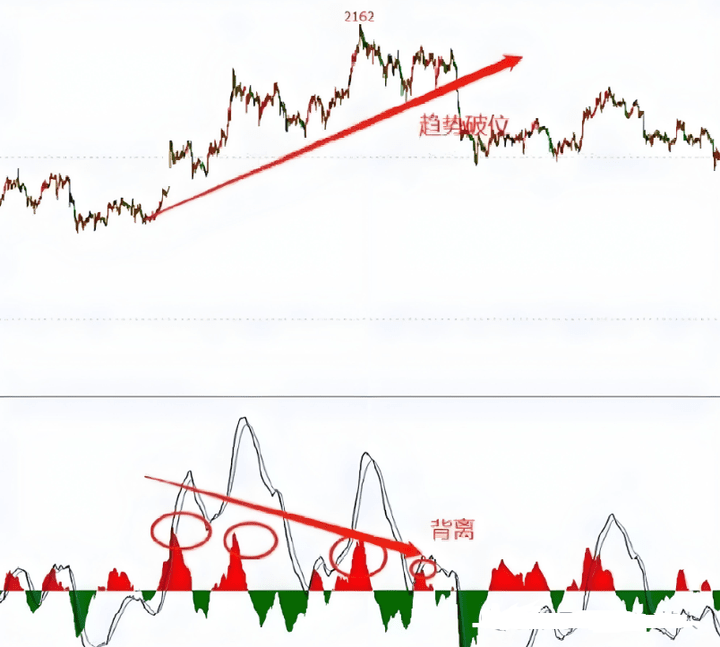
Divergence does not necessarily mean reversal; it can also indicate accumulation. After divergence, there may be further divergence, so using divergence to enter or exit can easily lead to being misled.
However, we can use MACD + price trend to determine market turning points.
Finally, pay attention to the warnings about trading coins:
First, do not hold onto positions, as profits returned will eventually be 'given back' to the market.
Second, do not guess tops and bottoms; any profits gained from guessing will eventually be 'given back' to the market.
Third, do not guess tops and bottoms, as you may still be halfway up the mountain.
Fourth, do not rely too much on news, as it leads to 'guessing' tops and bottoms.
Fifth, do not easily exit while in profit, as you may be running halfway up the mountain.
Sixth, do not get excited when you see large bearish or bullish candles, as they may just be a 'performance' for the retail investors.
Seventh, do not assume that what you see is the final wave; as long as your capital is still there, there will always be opportunities.
Eighth, do not trade frequently, as it will not only make you lose sight of the big direction and increase the chances of making mistakes but also raise trading costs, making it a losing game.
Ninth, do not take contrarian positions; hold firmly if you are right, but run quickly if you are wrong.
Tenth, do not make purchases just because the price is low, nor sell simply because the price is high; do not act rashly if the trend has not changed.
The above are some thoughts and insights from Yan An himself. If you find it helpful, please like and save it. I am Qing Tian, someone who has gone through three rounds of bull and bear markets, skilled in logical coin selection and technical timing, trading only within my cognitive range! Every direction has been confirmed by the market!
Even the most diligent fisherman would not go out to sea during a storm; instead, they carefully protect their boat. This season will pass, and a sunny day will come! Follow Yan An, and I will teach you how to fish as well as fishing techniques. The crypto door is always open; only by following the trend can you live a life in sync with the trend. Save this and keep it in mind!