🧠 Technical Analysis:
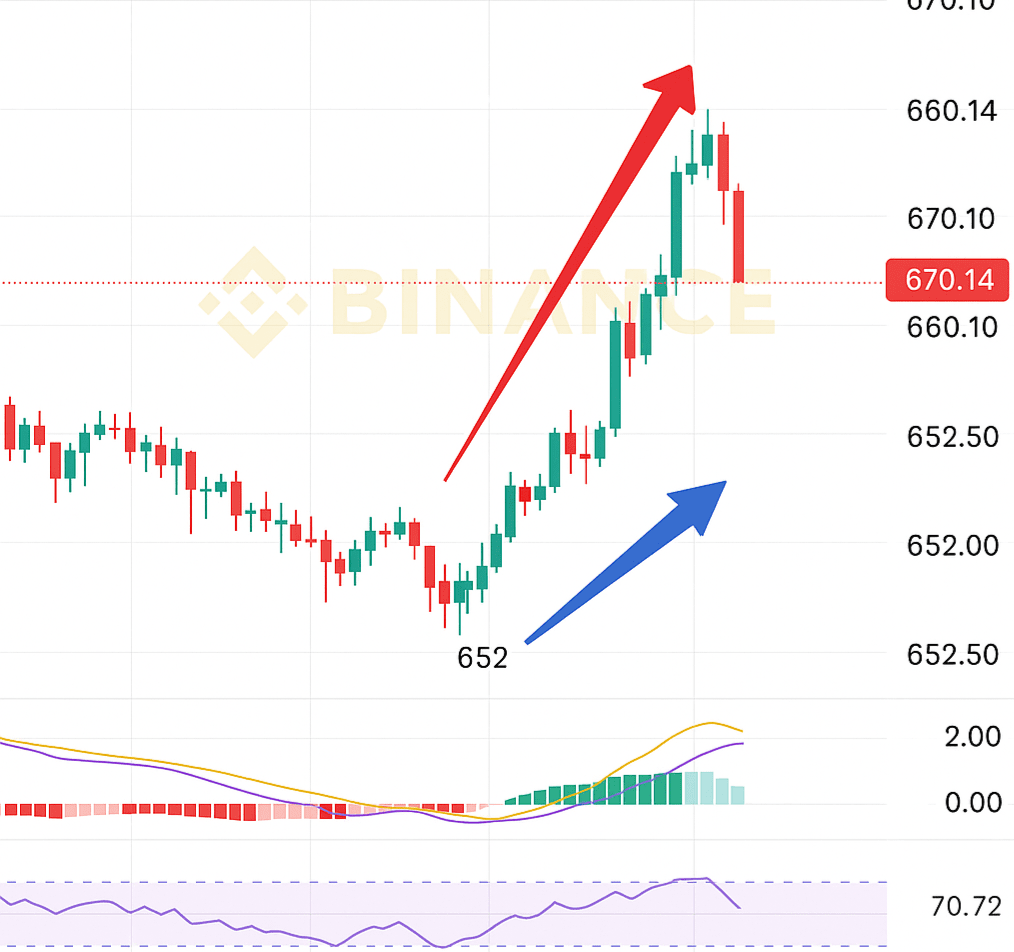
Current price: $670.14
Highest peak today: $674
Lowest low: $660
Daily rise percentage: +1.45%
✅ Technical Indicators:
Moving Averages (MA):
The price is currently above MA7, MA25, and MA99 → indicating a strong upward trend.
MACD: has started a slight negative crossover → the first signal of a possible upcoming correction.
RSI: ranges between 57 – 58 → Neutral area leaning towards buying exhaustion.
📊 Movement Reading:
We have seen a strong rise from the $652 area to $674.
The price has started to slightly retreat from the peak, which may indicate a temporary profit-taking.
The current support area between $665 – $667 is very important. Breaking it may bring the price back to $660 or lower.
The next strong resistance is at $678 – $680, and if breached, we may see a new high above $690.
🔁 Potential scenarios:
📈 Rise:
If the price rebounds from $665 and rises above $674 again, it will be a signal to continue the upward trend towards $690.
📉 Drop:
If the price breaks $665 with a strong candle, the first correction target will be at $660, then $645 as a deeper target.
⁉️ Do you expect BNB to continue rising and break $680? Or has the correction time really begun? 🤔
Share your opinion in the comments 👇👇
#BTCBreaksATH #TrendTradingStrategy #BinanceHODLerLA #Write2Earn

