I kept losing in the first two years of trading, but after that, I started to profit over the next five years!! Making money from trading is actually so simple, just three steps!
After struggling and summarizing, I formulated 8 iron rules, the content is not much, but the value is high. If you think it makes no sense after reading, feel free to say whatever you want!
1. Divide your funds into five parts, each time only enter one-fifth! Control a 10-point stop loss. If wrong once, you only lose 2% of the total funds; if wrong five times, you lose 10% of the total funds. If you are right, set a take profit of more than 10 points. Do you think you will still be stuck?
2. How to further improve the win rate? Simply put, two words: follow the trend! Each rebound in a downtrend is a trap to entice bulls, and each drop in an uptrend digs a golden pit! Which is easier to make money, bottom fishing or low absorption?
3. Do not touch coins that have rapidly surged in the short term, whether mainstream or altcoins. Very few coins can form several main upward trends. The logic is that it is difficult to continue rising after a short-term surge. When the high price stagnates, it cannot be pulled up later, so it will naturally fall. It's a simple principle, but many people still want to take a gamble.
4. You can use MACD to determine entry and exit points. If the DIF line and DEA form a golden cross below the 0 axis and break through the 0 axis, it is a steady entry signal. When MACD forms a death cross above the 0 axis and moves downward, it can be seen as a signal to reduce the position.
5. I don’t know who invented the term ‘averaging down,’ which caused many retail investors to stumble and suffer heavy losses! Many people lose more as they average down, and the more they average down, the more they lose, which is the most taboo in trading. Remember to never average down when in loss, but to add to your position when in profit.
6. Volume-price indicators are the first priority, trading volume is the soul of the crypto world. Pay attention when the price breaks out with increased volume in a low consolidation area, and decisively exit when there is increased volume in a high area.
7. Only trade coins in an upward trend, this maximizes the chances of winning and does not waste time. The 3-day line turning upward indicates a short-term rise, the 30-day line turning upward indicates a medium-term rise, the 84-day line turning upward indicates a main upward trend, and the 120-day moving average turning upward indicates a long-term rise!
8. Persist in reviewing weekly, check if the holding logic has changed, technically check if the weekly candlestick trend matches the judgment, whether the direction has changed, and adjust trading strategies in a timely manner!
Making money from trading is actually so simple, just three steps!
Step one: First look at the trend.
Step two: Find the key level again.
Step three: Find entry signals.
Enter, profit, close the position, and leave.
Isn't it simple?
Let's discuss this in more detail.
Step one: First look at the trend.
The state of a market.
A big market basically has three outcomes: rising, sideways, or falling.
What is a big market?
Look at cycles longer than 4 hours, such as 4 hours, daily, or weekly charts.
(My personal habit is to look at the 4-hour chart.)
In a rising market, go long.
In a downtrend, short.
Do not trade during sideways movement.
If the current market is in a sideways state.
Then there's no need to continue downwards.
Do whatever you need to do.
Play with kids, drink some wine....
If it is a one-sided uptrend or downtrend market.
Please continue to the next step.
Step two: Find the key levels.
No matter if the market is rising or falling.
It will jump like a bouncing ball, jumping up or down level by level.
What we need to do is enter at its jumping position and exit at the next landing point.
How to accurately find the steps becomes the key.
This is what we refer to as the key levels (main support and resistance levels).
(How to accurately find the main support and resistance levels can refer to my previous articles.)
The purpose of finding key levels is to identify which stage the current market is in.
Is it in the early stage? Mid stage? Or late stage?
Does the target level meet your risk-reward ratio?
We do not engage in losing businesses.
If the risk-reward ratio is less than or equal to 1:1 (lose only 1 dollar, win only 1 dollar),
Then just rest.
If greater than 1:1.
For example, a risk-reward ratio of 1:1.5 (lose only 1 dollar, win 1.5 dollars).
Then let's continue to the third step.
Step three: Find signals.
Generally, if you find a market in a large cycle.
Then we need to look for trading signals in smaller cycles.
Everyone has different strategies they excel at.
Some excel at AK47, some at M5, some at handguns, and some at sniper rifles....
Even if you excel at everything.
But you can't take everything to the battlefield, right?
So precisely 1-2 types of strategies.
Learn thoroughly, and you can still kill the enemies.
Some excel at looking at moving averages.
Some excel at trend lines.
Some excel at MACD.
Some excel at Bollinger Bands.
Some excel at RSI.
Some excel at KDJ.
Some also excel at naked candlesticks.
........
All of these are possible.
As long as the right entry signal is found.
For example, a bullish engulfing pattern.
Or it could be a Pinbar.
Or it could be a 2B rule breakout.
You need to quickly formulate your trading strategy.
A complete trading strategy includes
(1) Asset — What to trade;
(2) Position — How much to hold;
(3) Direction — Long or short;
(4) Entry point — At what level to trade;
(5) Stop loss — When to exit a losing trade;
(6) Take profit — When to exit a profitable trade;
(7) Countermeasures — How to deal with sudden situations;
(8) Follow-up — Operations after the trade ends.
After formulating the strategy.
What you need to do next is execute, and then wait.
Maintain patience and strictly adhere to trading discipline.
(For complete trading discipline, please reply 'discipline' in the public account.)
Calmly wait for the market to develop towards your expected target.
As time goes by.
There are basically two outcomes:
Lost: Summarize experiences, accumulate lessons, get stronger through setbacks. Losses are normal trading costs, very normal.
Profited: Cash out, you can add to your position or adjust the stop loss to seek more profit.
A trading process is considered complete at this point.
This is the famous TLS technical analysis method.
Trend + key positions + signals = successful trading.
Step four: Practical application.
Words alone are not enough; let’s take an example.
For example, take this wave of Bitcoin's market on February 6 this month.
I personally captured and profited from this wave of market! So it's quite memorable.
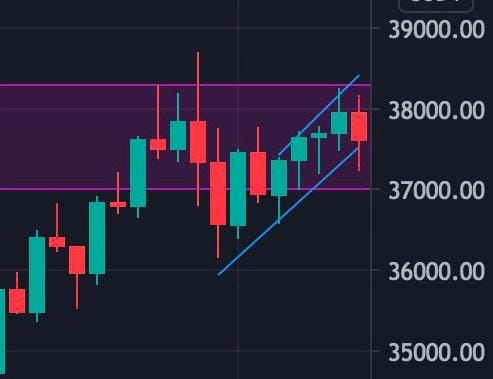
We found on the daily chart that although the overall market is a volatile market.
But the current trend is a rapid upward state.
Belongs to a one-sided market.
The first step of looking at the trend is considered complete.
Next, we will look for key levels.
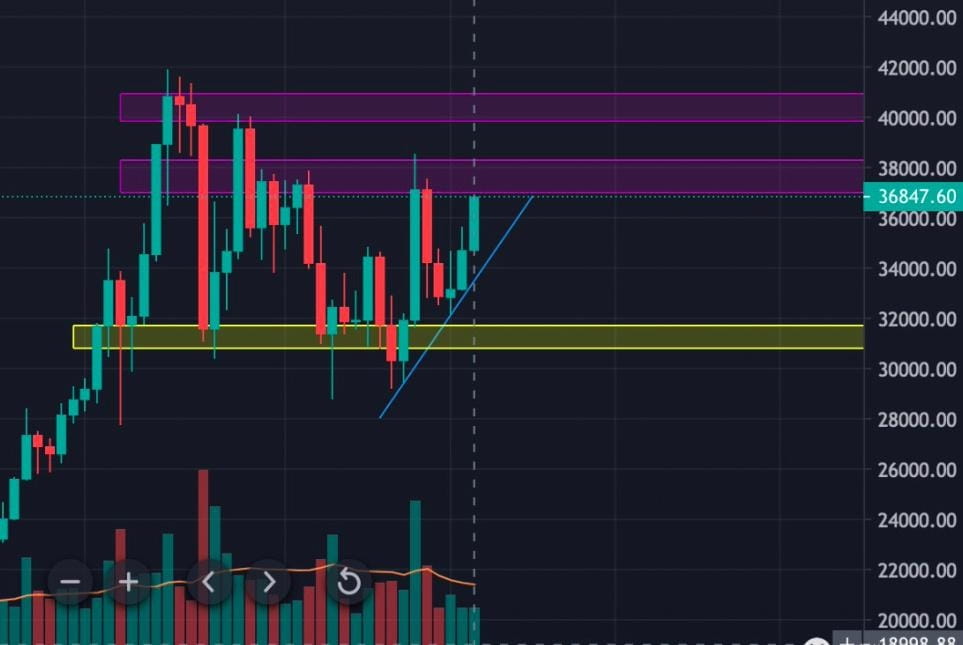
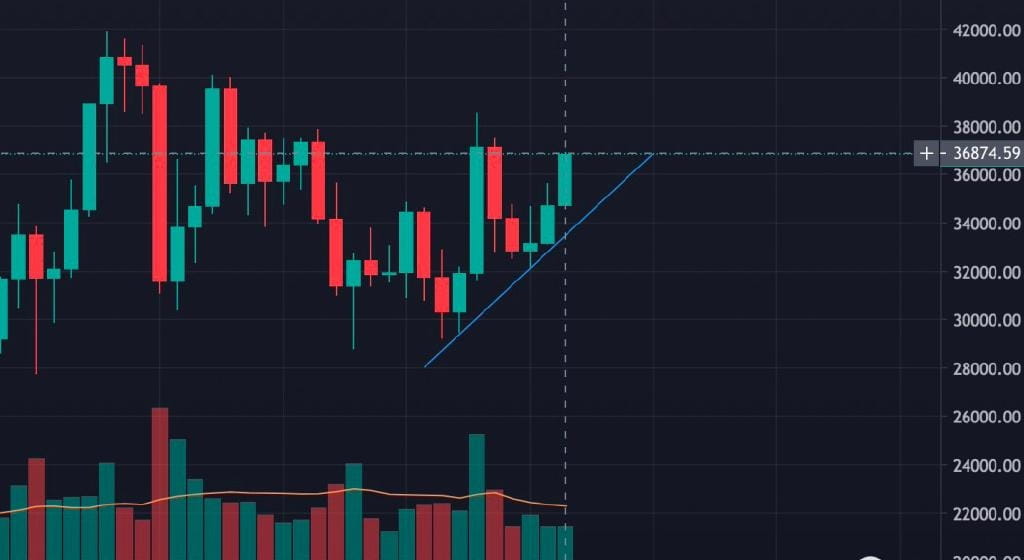
We found a support level (yellow area) and two resistance levels (purple area) on the daily chart.
The current price (36847) is very close to the first resistance level.
And a strong bullish candlestick was formed, showing strong upward force.
Then we might as well look for it in smaller cycles.
Is there a possibility of breaking through the resistance level?
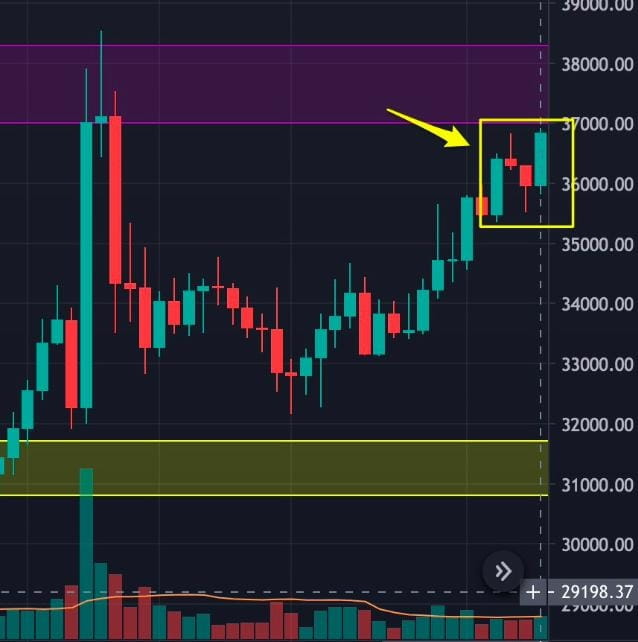
Then we move on to the third step: look for signals.
We found on the 4-hour chart that at 20:00 on February 3, a bullish three-method golden candlestick pattern was formed.
This indicates the performance in the early to mid stage of an uptrend.
And this round of upward momentum is strong, with bulls being very strong.
We have reason to believe it will reach the first resistance level 37200-38200.
Plan to enter with a light position to try.
Let's calculate the risk-reward ratio.
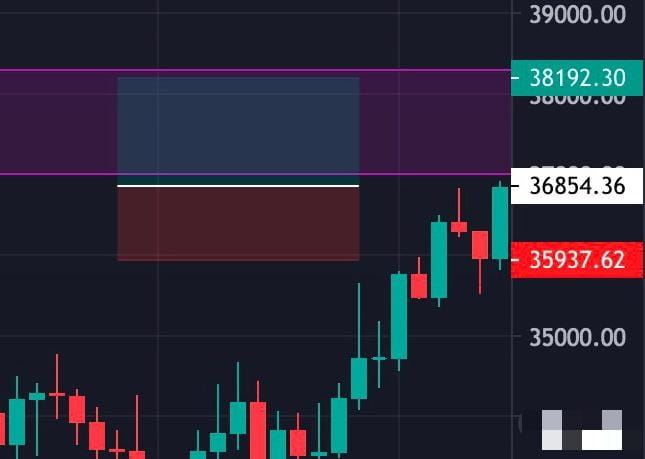
We choose to enter the market through a breakout at 36854.
Take profit point 38192.
Stop loss point 35937 (the opening price of the third line in the ascending three-method structure serves as support, which is also the highest point in the pattern).
Risk-reward ratio: 36854 minus 35937: 38192 minus 36854 = 917:1338.
Approximately 1:1.46.
Although not too high, it is still greater than 1:1.
We decided to enter the market.
The trading strategy is as follows:
(1) Asset — BTC;
(2) Position — 0.1 BTC;
(3) Direction — Long;
(4) Entry point — 36854;
(5) Stop loss — 35937;
(6) Take profit — 38192;
(7) Countermeasures — If the next candlestick closes above the previous bullish candlestick by more than 50%, then sell high, abandon this trade, and ensure to manually close the position while in a profit state;
(8) Follow-up — If the market stands above the first resistance level and continues to strengthen, continue to hold the position or slightly reduce the position, depending on the specific situation.
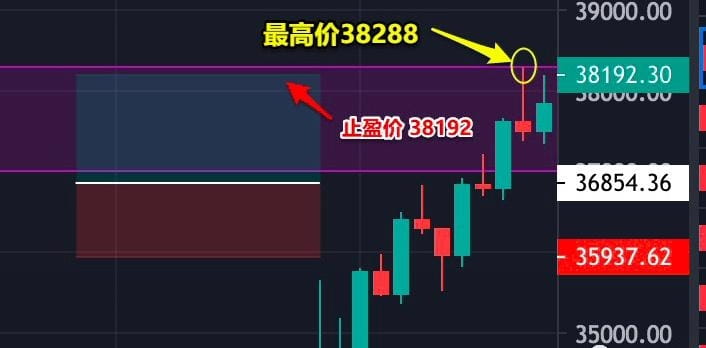
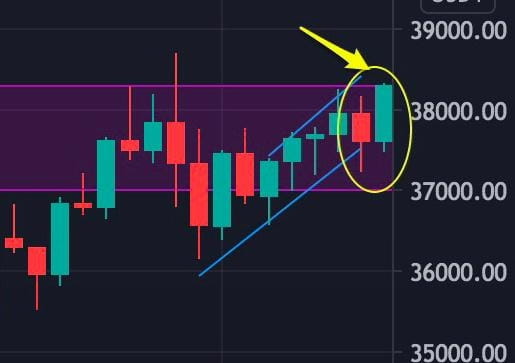
The next day after getting up (February 4, 12:00, I usually sleep late at night and get up at noon).
The market successfully hit our take profit point 38192, with the highest point reaching 38288.
Exited smoothly.
This trade does not make a profit excluding fees.
(38192-36854)*0.1=133.8USDT.
?
Wait, it's not over yet.
Let's see what kind of patterns the market will create in the first resistance level range.
Is it a triangular fluctuation? Or will it break down immediately? Or will it continue to rise?....
Oh! It turns out a breakdown followed by a rebound occurred.
The center of gravity has not shifted downwards.
And we have ruled out the possibility of a false breakout (technical points can refer to my previous articles).
We decided to try entering the market again.
Speculate on the profit margin for the next resistance level (40000-41000).
Start looking for entry signals.
Indeed.
The market gave us a bullish engulfing pattern.
And the following large bullish candlestick is almost without a shadow.
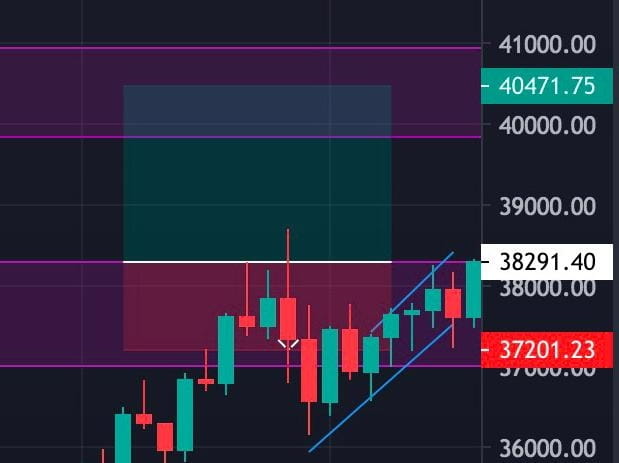
If we still choose the breakout entry mode.
Will place the take profit at 40471.
Place the stop loss at the bottom of the current resistance level (which has now turned into a support level) 37201.
Calculate the risk-reward ratio:
38291 minus 37201: 40471 minus 38291 = 1090:2180 = 1:2.
A risk-reward ratio of 1:2 is still quite good.
We decided to enter the market.
The trading strategy is as follows:
(1) Asset — BTC;
(2) Position — 0.1 BTC;
(3) Direction — Long;
(4) Entry point — 38291;
(5) Stop loss — 37201;
(6) Take profit — 40471;
(7) Countermeasures — If the next candlestick closes above the previous bullish candlestick by more than 61%, then sell high, abandon this trade, and ensure to manually close the position while in a profit state;
(8) Follow-up — If the market stands above the first resistance level and continues to strengthen, continue to hold the position or slightly reduce the position, depending on the specific situation.
Leave the remaining time to the market.
We will wait and see.
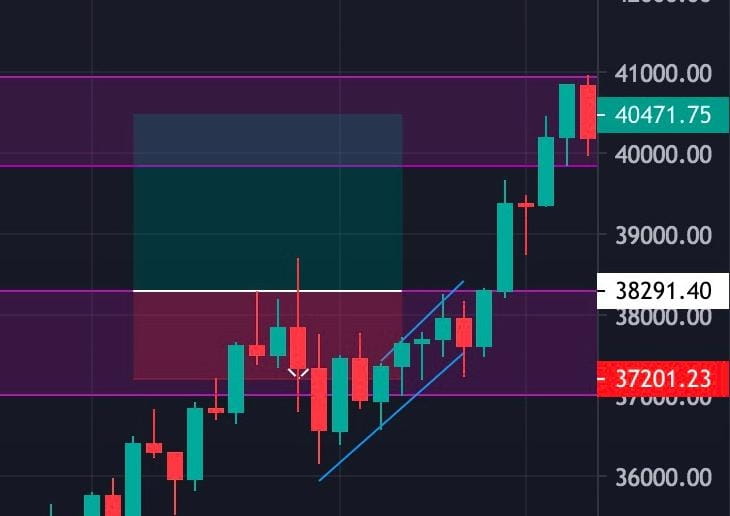
Indeed.
The market reached a high of 40849.
Successfully hit our take profit level and exited smoothly.
This time profit was 2180 points, 218 USDT.
Then we quickly noticed the following large bearish candlestick.
Then it proves the price has no strength to stand above this resistance level.
At least it hasn't shown up at the 4-hour level.
Due to the inability to short in the spot market.
This round of market trading comes to a pause here.
Total earnings 133U + 218U.
It only took 2 days, which is quite an impressive achievement.
So you see?
Is trading really that difficult?
No.
As long as you clarify which wave you are following?
Your logic is very clear.
100% believe in the strategy you formulated.
Then just execute it firmly.
Some might say.
You are just being a hindsight critic.
I have nothing to say about this, and I am too lazy to share a trading proof to prove anything.
If you have read my previous technical analysis articles.
Then you won't believe it was hindsight.
And you will also find out why the take profit and stop loss points above are set that way.
Why should the follow-up be formulated this way?
Finding the main support and resistance levels?
What does a breakdown followed by a rebound mean?
How to draw trend lines?
....
What I learned before was fragmented knowledge.
Today I want to clarify the trading process for you.
Applicable at any time, for any asset, in any market.
To make it easier for you to think and formulate strategies.
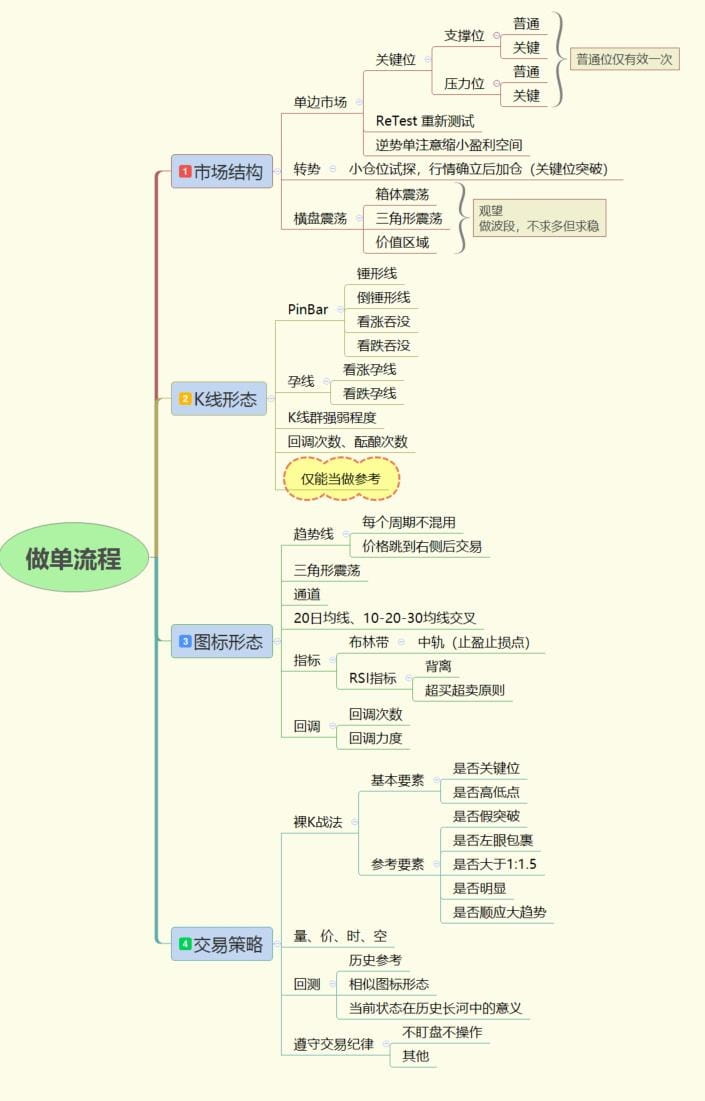
I will share a flowchart below.
You can click to enlarge and save it to your phone.
Always formulate strategies according to the process before each trade.
I believe you won't lose too badly.
Developing good habits over time will reveal your shortcomings in the trading process, and by working to improve them, you will succeed!
There is also a strategy that I want to share with everyone here, hoping it helps!
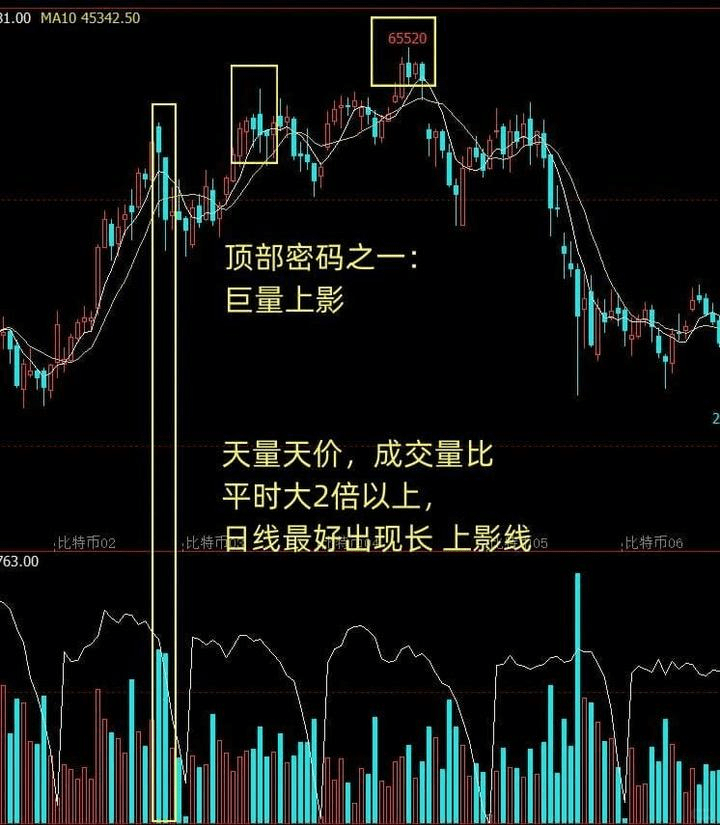
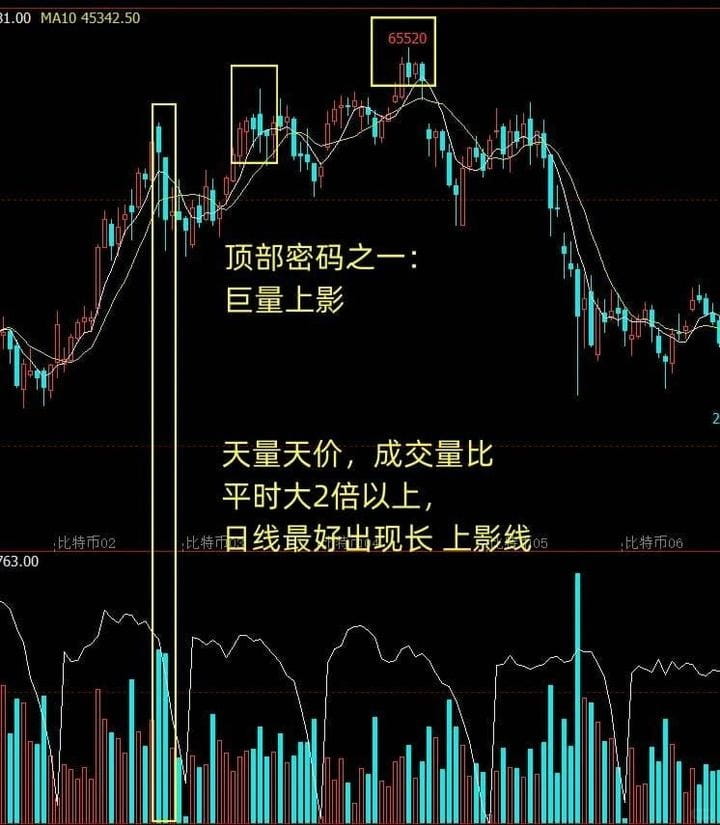
[Bottom lasts a hundred days, top lasts a moment]
As the saying goes, 'Bottom lasts a hundred days, top lasts a moment.' Many friends are often influenced by psychology when operating. When the price reaches a high level, they always think they can hold on a little longer, as it might reach a new high. However, the result is often that they should be profiting but end up just standing guard at a high position. This is mainly due to a lack of understanding of selling points and insufficient market understanding.
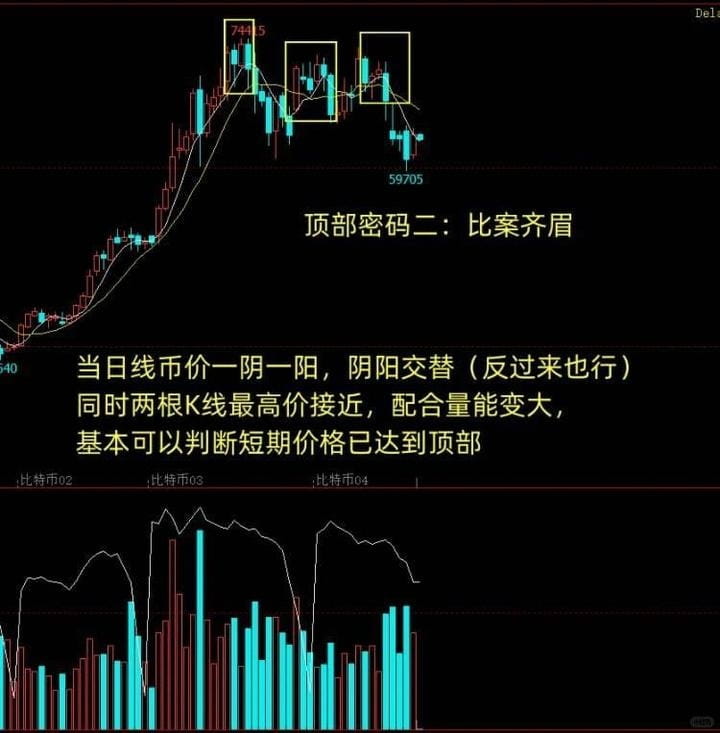
Therefore, today I took some time to organize 4 common, simple, and practical topping patterns for everyone. Learn these, and you can easily judge the formation of the top, allowing you to cash out at the top range to achieve high-level take profit.
Everyone should keep these patterns in mind. If you can’t remember, you can save them and look at them a few more times; you will definitely gain something.
Master the heart of the market, and victories will follow.