🚨 DOGE/USDT Long-Term Chart Analysis – Make or Break Zone Approaching! 🚨
Dogecoin (DOGE) has reached a critical point on the daily timeframe, and all eyes are now on its next major move. Currently priced at $0.17321, DOGE has seen a modest gain of +0.73% in the last 24 hours — but beneath the surface, the chart is showing signs of a potential major shift in trend, and traders should be prepared for heightened volatility in the coming days.
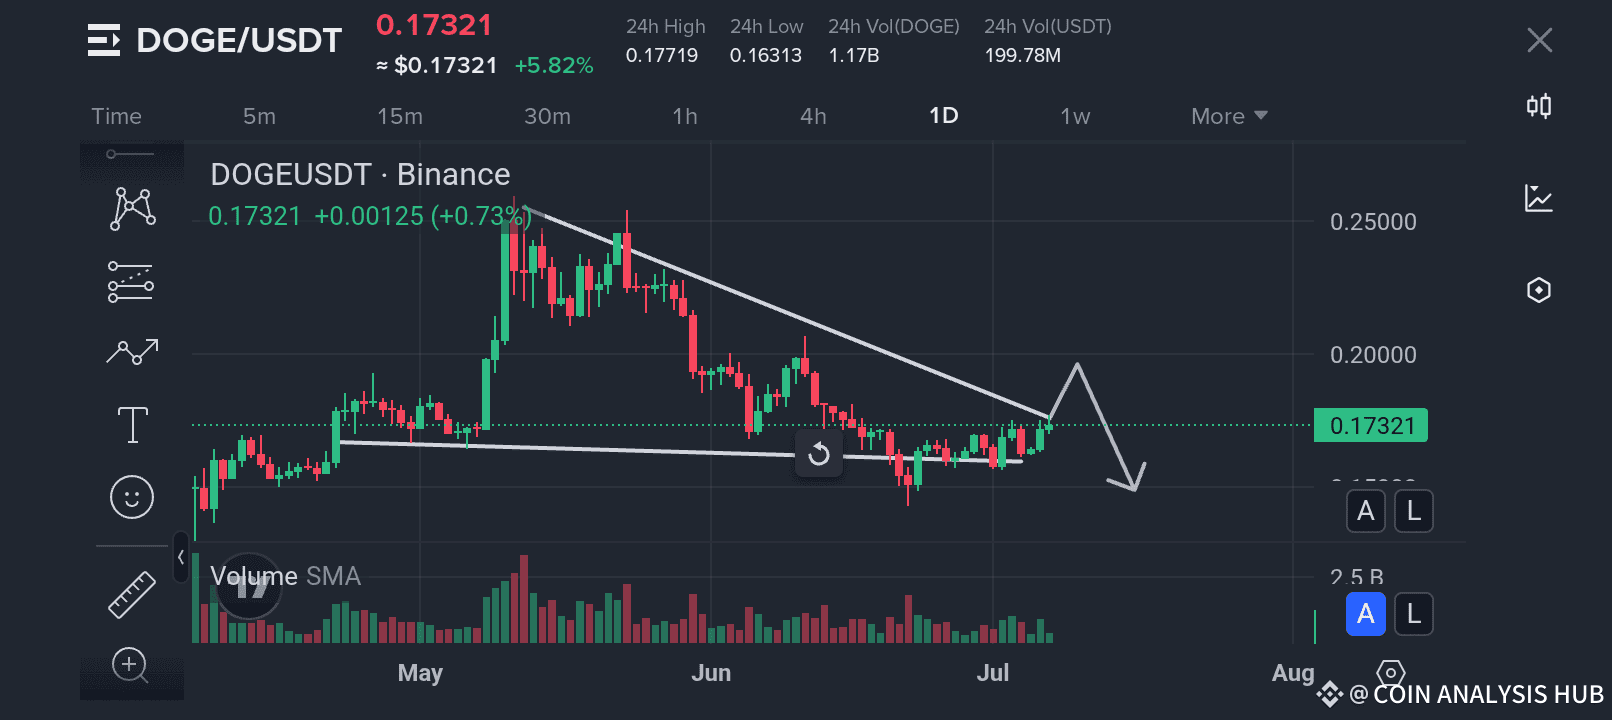
📉 Chart Pattern Overview: DOGE is forming a classic descending triangle, a pattern that typically indicates bearish continuation, especially when it forms after a significant move downward — which we've seen from the highs near $0.22–$0.23 back in early June.
This triangle is defined by:
A series of lower highs, represented by the descending trendline.
A relatively flat support zone around $0.160–$0.165, which has held strong multiple times.
DOGE has now reached the apex of this triangle, meaning a big breakout or breakdown is very close. Price is currently testing the descending trendline from below, and this zone acts as heavy resistance.
📊 Technical Highlights:
Volume has been steadily decreasing during this consolidation phase, which is common before a breakout. Once a move begins, expect volume to surge.
Resistance Zone: $0.175–$0.178 needs to be broken with strength and volume for bulls to regain control.
Support Zone: $0.163–$0.160 is key. If price fails to hold this level, a breakdown could lead to a sharp fall toward $0.150 and below.
📉 Bearish Bias if Rejected: The chart currently favors the bears unless DOGE breaks above the trendline convincingly. If the current attempt fails to break above resistance, we could see a swift rejection, leading to a potential move downward toward the lower levels of the triangle — or a full breakdown toward previous swing lows near $0.145–$0.150.
📈 Bullish Reversal? On the flip side, if bulls manage to break and close above $0.178 with strong volume, this descending triangle could be invalidated. In that case, DOGE might start forming a new uptrend with targets at $0.19, $0.20, and eventually $0.22+ in the medium term.
🧠 Trading Strategy Suggestion:
Wait for a clear confirmation: Either a breakout above $0.178 with high volume or a breakdown below $0.160.
Set tight stop-losses if entering a position early — volatility will increase.
Breakout target (if bullish): $0.190, $0.200+
Breakdown target (if bearish): $0.150, $0.145
📌 Conclusion: DOGE is standing at the edge of a key technical structure. The descending triangle has tightened price action into a narrow zone, and a breakout in either direction is imminent. While the current chart favors a bearish scenario if rejection occurs, a strong breakout could flip the momentum in favor of the bulls.
Stay alert, manage risk carefully, and be ready to act once the market gives a clear signal. This is a high-stakes zone, and the next move could set the tone for DOGE in the coming weeks.
🔔 Follow for real-time updates and alerts as the situation develops!
#DOGEUSDT #Dogecoin #CryptoAnalysis #Altcoins #BreakoutTrading #DescendingTriangle #Binance #CryptoCharts #PriceAction #Te
chnicalAnalysis #CryptoTraders #MarketUpdate