🟨 SUPER EASY GUIDE TO JAPANESE CANDLESTICKS – Day 7 of my Binance diary
Hello! I'm on day 7 of my Binance diary, learning about cryptocurrencies step by step. My goal is to share what I'm discovering so you and I can better understand this exciting world. Today we're going to talk about Japanese candlesticks, those little red and green bars you see on the price charts on Binance. At first, they seemed like just colors, but now I know each candlestick tells a story, just like the market itself. Let's get started!
📌 INDEX
What are Japanese candlesticks?
What does a candle tell me?
Why are some candles green and others red?
What are those long lines (wicks)?
What can I guess by looking at a candle?
Special candles I'm learning
How to use candles with supports and resistances?
How do I view charts on Binance?
Indicators that help candles
What did I learn today and what's next?
Beware of the risks!
Question of the day
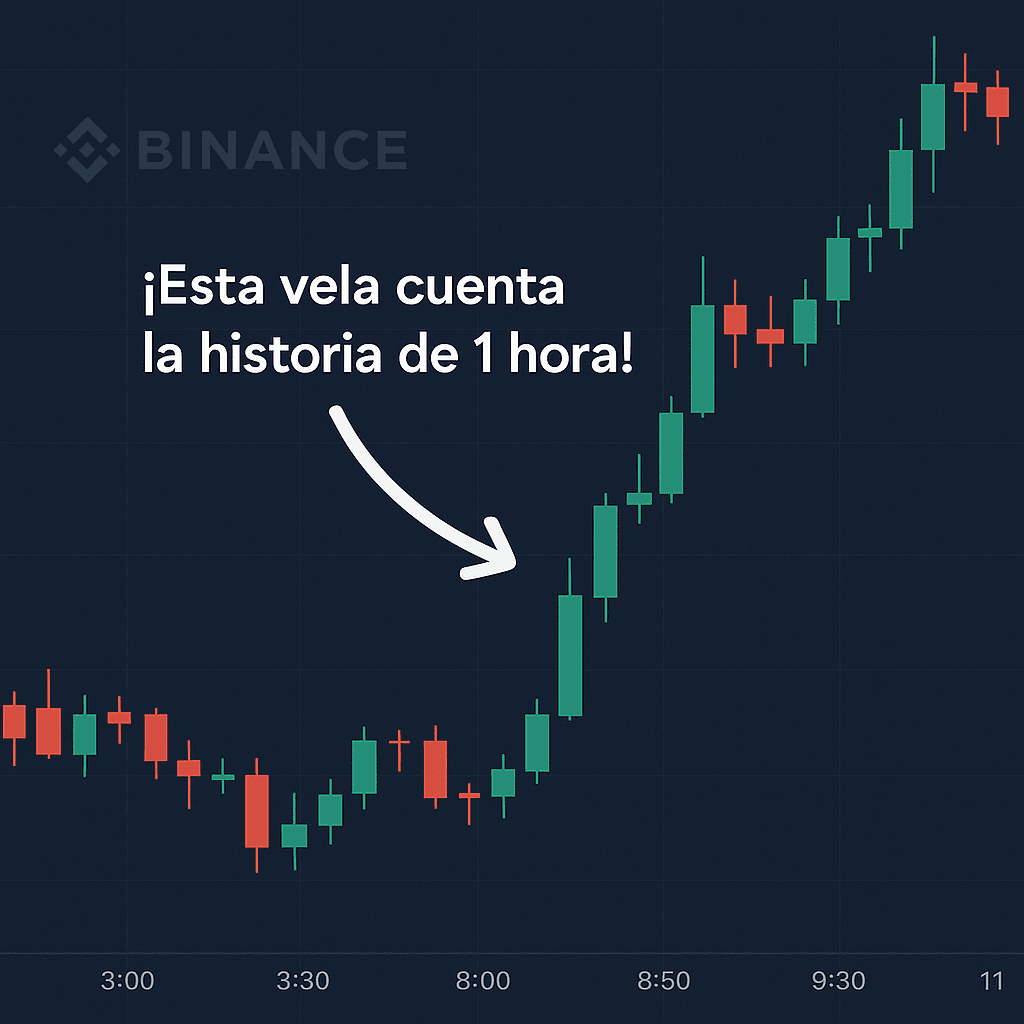
1. What are Japanese candlesticks?
Imagine the price of a cryptocurrency, like Bitcoin, is like a roller coaster. Japanese candlesticks are drawings that show how the roller coaster went up or down in a short time. That "short time" can be:
1 minute (super fast!)
15 minutes
1 hour
1 day (most common for beginners)
1 week
For example, on a 1-day chart, each candle tells you what happened to the price from the beginning of the day to the end. It's like a summary of the fight between those who want to buy (because they think the price will go up) and those who want to sell (because they think it will go down).
Japanese candlesticks originated in Japan in the 18th century, when rice traders used these charts to track prices. Today, they're used in cryptocurrencies, stocks, and forex because they help us understand how the market moves.
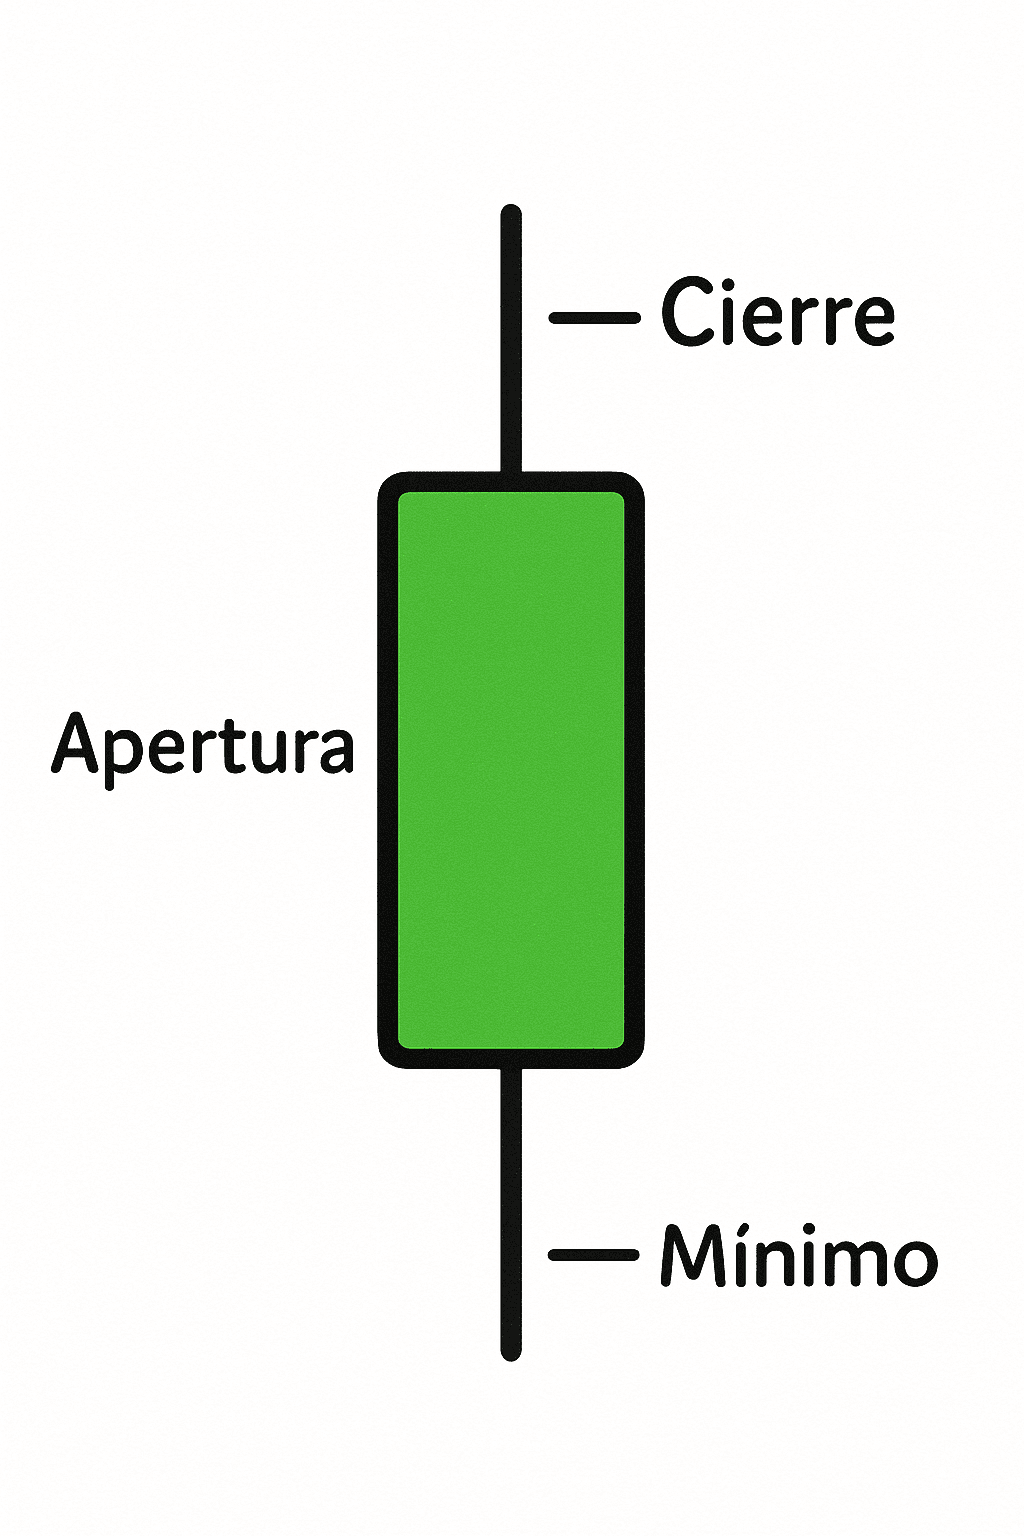
2. What does a candle tell me?
Each candle is like a picture that shows you four important things:
Open: The price at the start of the moment (for example, how much Bitcoin was worth at 9 a.m.).
Close: The price at the end of the short (how much Bitcoin was worth at 5 p.m., if it's an 8-hour chart).
Peak: The highest the price has ever reached, like the peak of a roller coaster.
Low: The lowest the price fell, like the bottom of a roller coaster.
A candle has two parts:
Body: The thick part, like the trunk of a tree, that shows how much the price changed from open to close.
Wicks: The thin, branch-like lines above and below that show the highest and lowest prices reached.
For example, if Bitcoin opens at $30,000, closes at $31,000, reaches $31,500, and falls to $29,800, the candle shows all of that in a single bar.
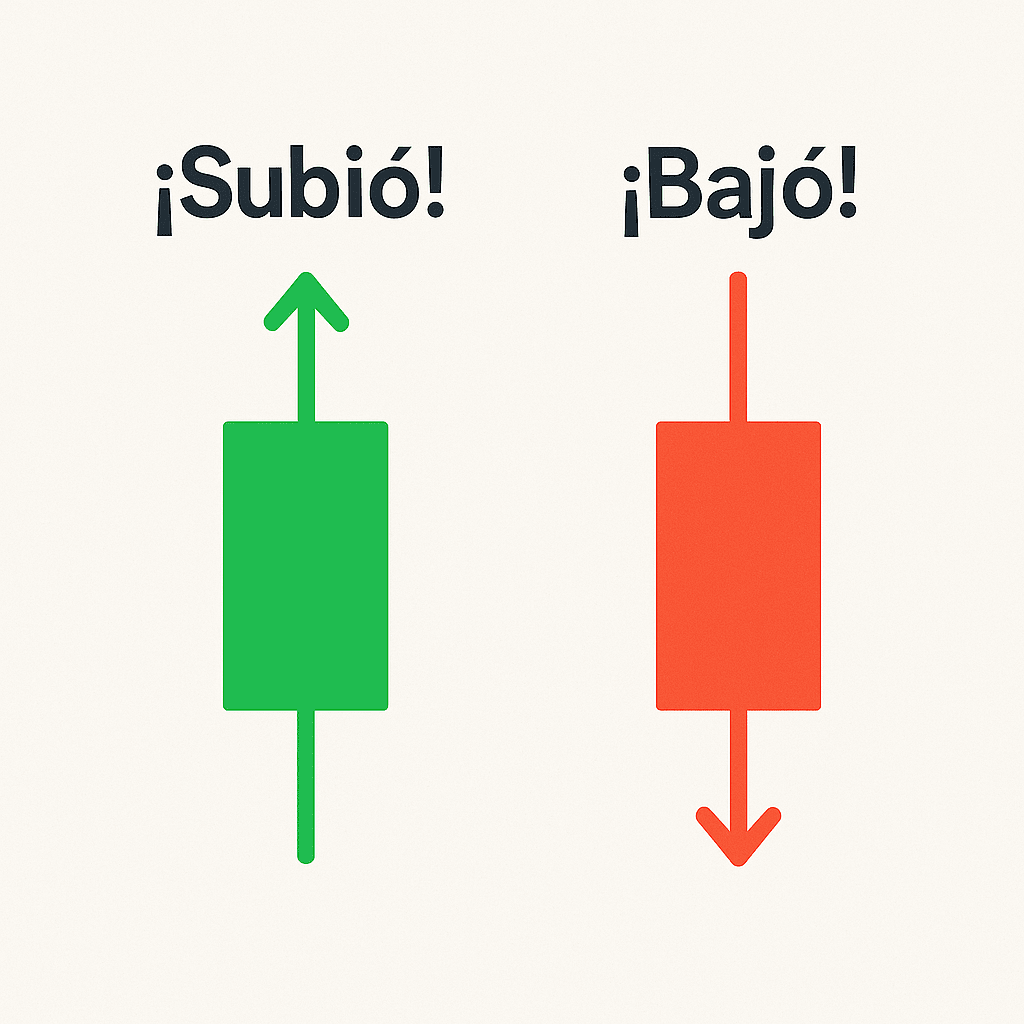
3. Why are some candles green and others red?
Candle colors are like traffic lights that tell you whether the price has gone up or down:
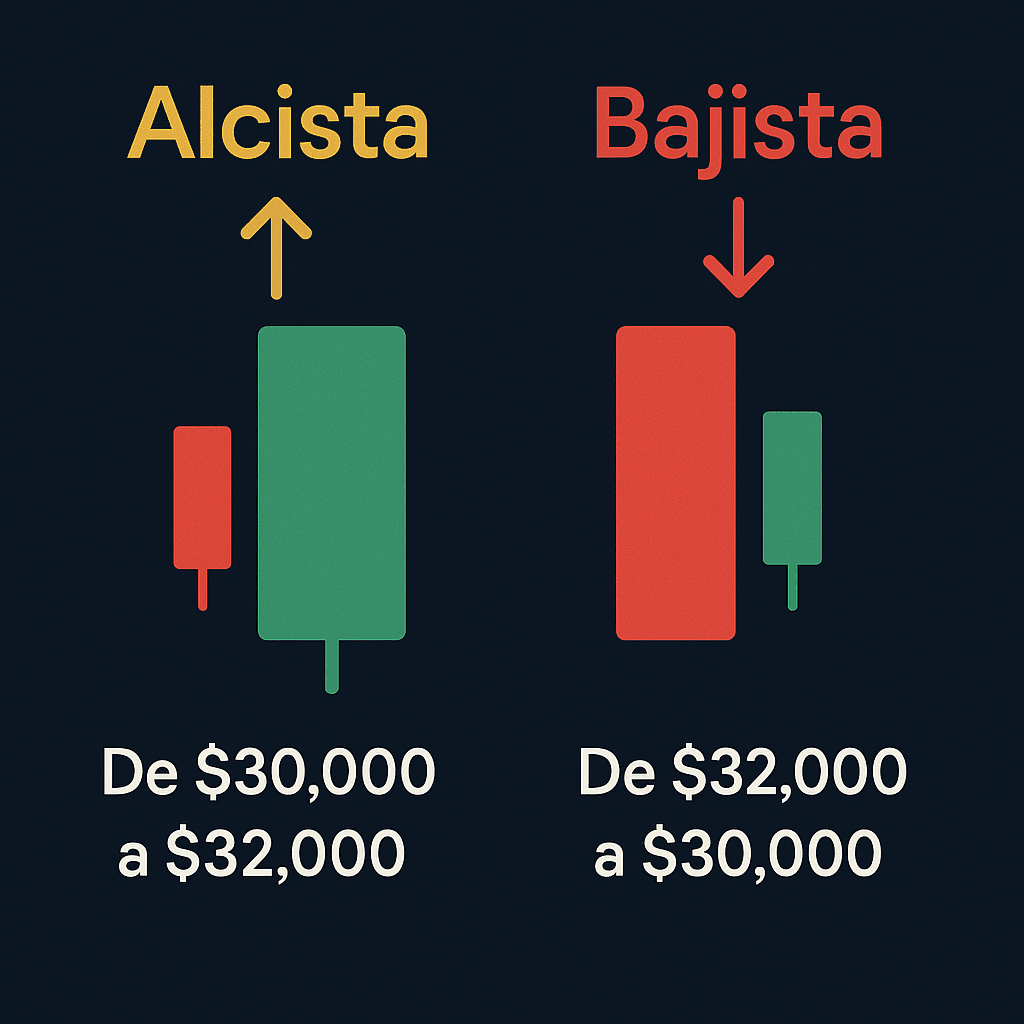
Green candle: The price rose, as if the roller coaster ended higher than where it started. The close is higher than the open. Buyers won!
Red candle: The price fell, as if the roller coaster ended lower. The close is lower than the open. Sellers won!
For example:
If Bitcoin starts the day at $30,000 and ends at $31,000, the candle is green.
If it starts at $30,000 and ends at $29,000, the candle is red.
On Binance, candles are typically green (bullish) and red (bearish), but on other platforms like TradingView you might see other colors, such as black and white.
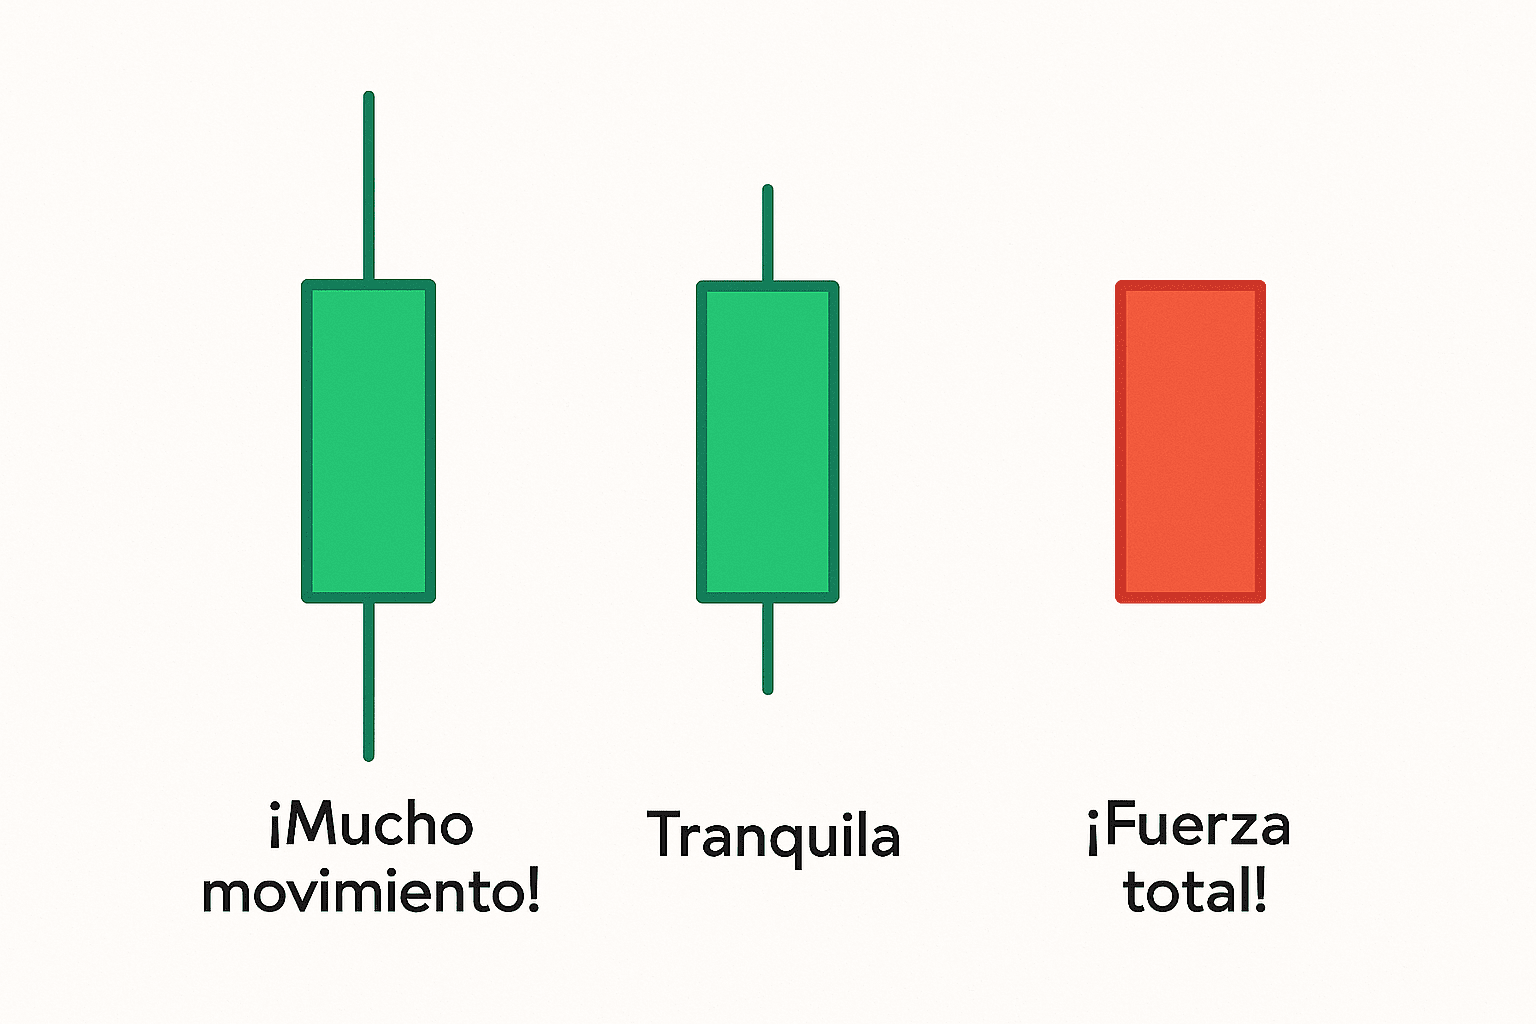
4. What are those long lines (wicks)?
Wicks (or shadows) are the thin lines that extend above or below the candle's body. They're like footprints that show where the price went before deciding where to end.
Long wick up: The price tried to rise sharply, but was rejected, as if someone tried to climb a mountain and was pushed down.
Long wick down: The price tried to go down, but it went back up, as if someone fell and was picked up.
Short wicks: The price didn't move much beyond the body. It's like a gentle roller coaster ride.
No wicks: The price opened and closed near the high or low. That's absolute strength!
For example, a green candle with a long wick below says: "The price dropped to $29,500, but buyers pushed it to $31,000." This may show that buyers are strong, but you have to look at the context (I'll explain this later). Long wicks also indicate volatility, meaning the price has moved a lot.
5. What can I guess by looking at a candle?
Each candle gives you clues about what's happening in the market, but you have to look at them carefully:
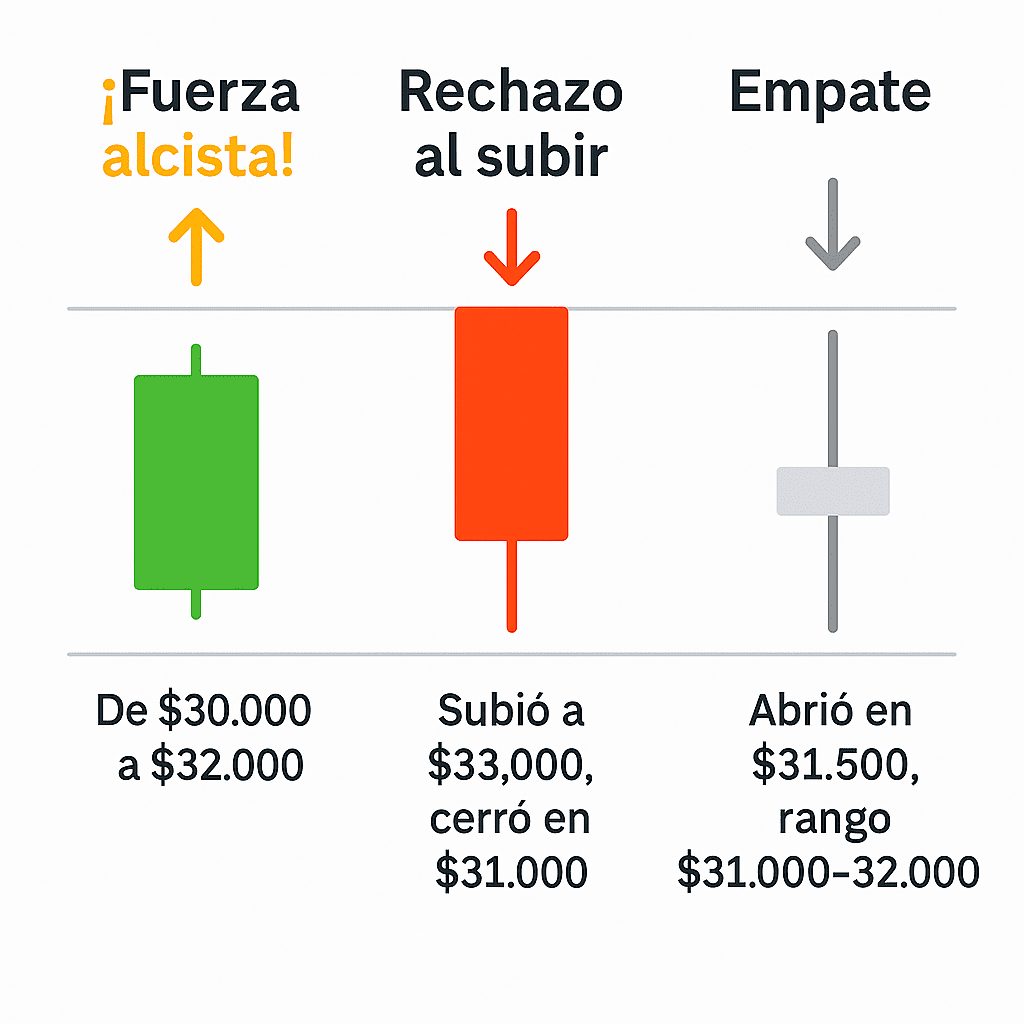
Large body:
Green: Buyers are super strong, as if they were crushing sellers in a match.
Red: Sellers dominate.
Example: A large green candle rising from $30,000 to $32,000 shows bullish strength.
Long fuse:
Above: The price attempted to rise, but was rejected. For example, a red candle with a long wick at the top says: “Buyers attempted to move up to $33,000, but sellers won and closed at $31,000.”
Down: The price tried to go down, but was rejected.
Small body with long wicks: It's a tie between buyers and sellers. No one clearly won. This can be a sign that something is about to change, but not always.
Important: A single candle doesn't tell the whole story. You need to look at it in conjunction with the candles around it and in specific places on the chart, such as support or resistance levels (I explain this in section 7).
6. Special candles I'm learning
Some candles have special shapes that traders look for because they can give clues about what's coming. These are the ones I'm starting to understand:
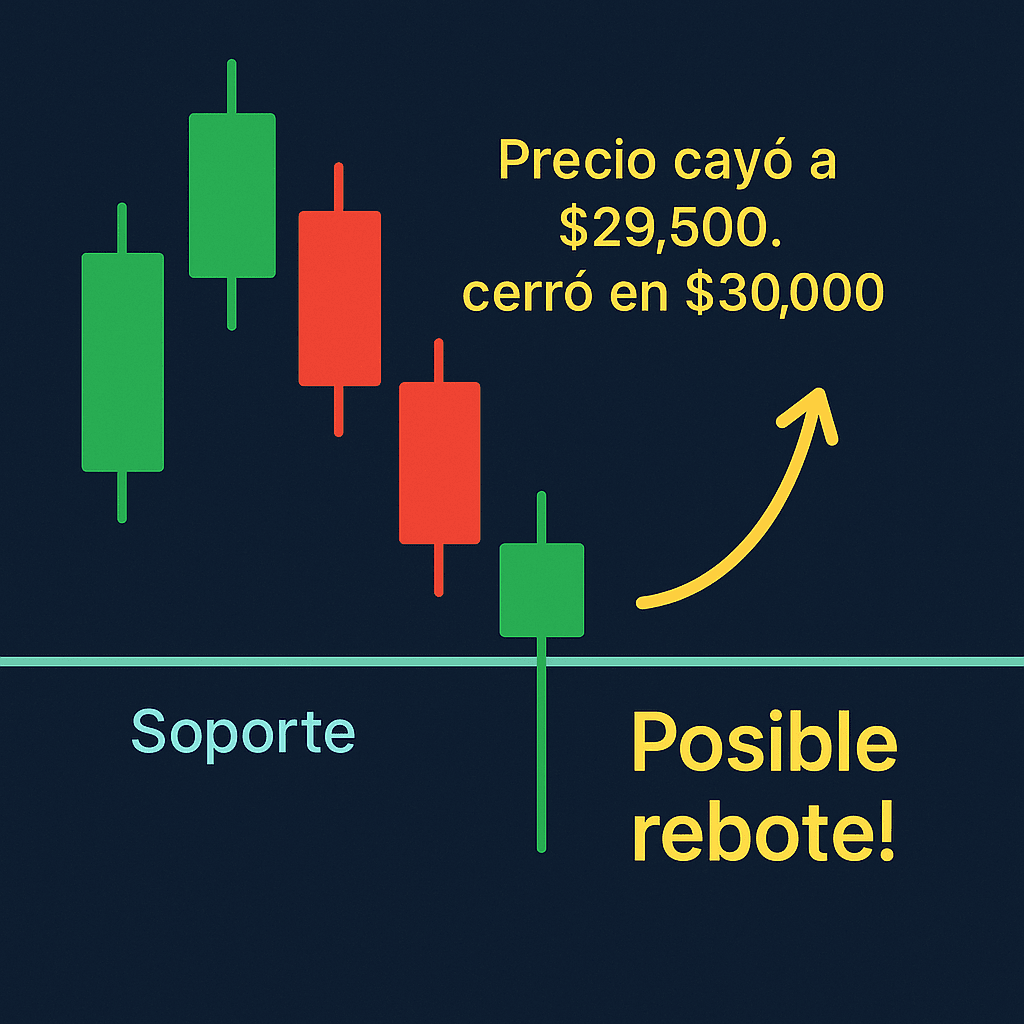
Hammer
What it looks like: A small body (green or red) with a long wick at the bottom, like a real hammer.
What it means: It usually appears at a support level (a place where the price stops falling because there are too many buyers). It's as if the buyers are saying, "We're not letting it go any lower!" It can be a sign that the price is about to rise.
Example: If Bitcoin drops to $30,000 (a support) and forms a hammer with a wick that touches $29,500, it may rebound to $31,000.
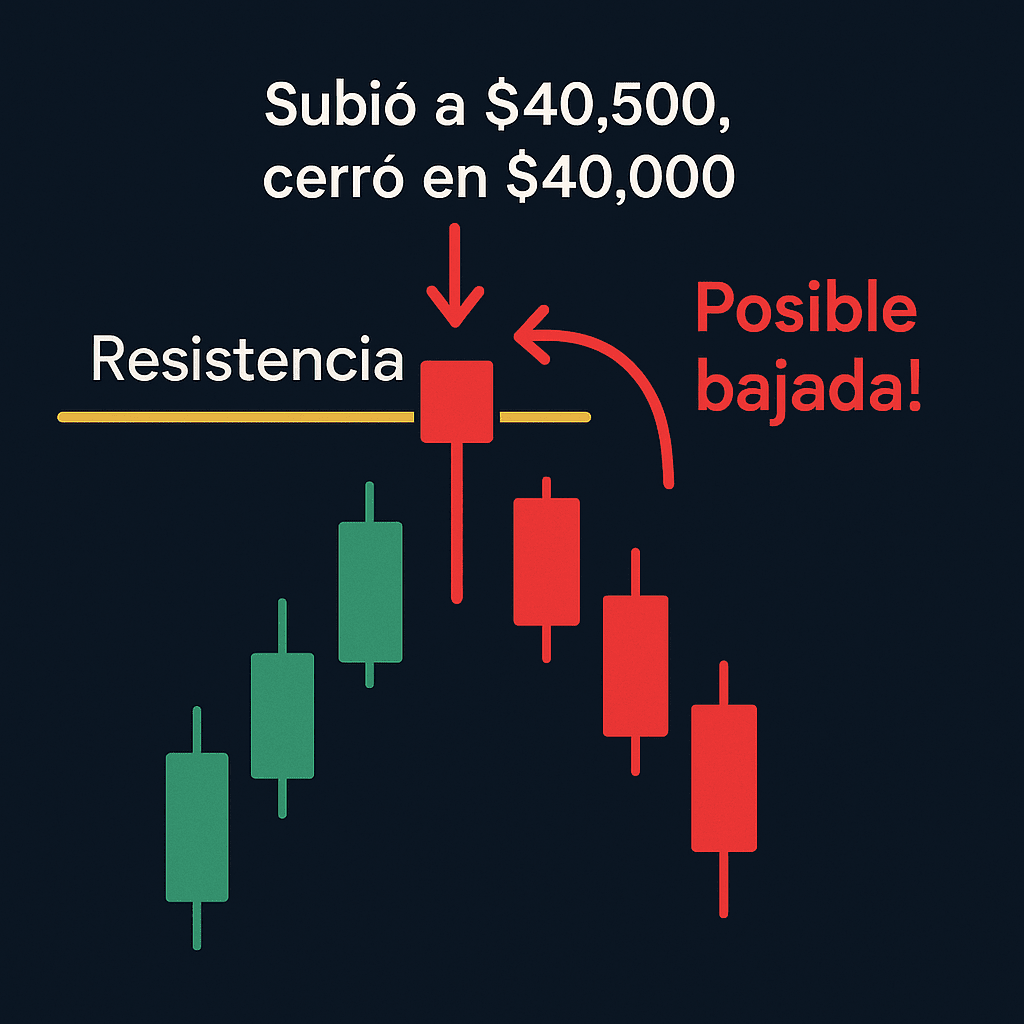
Inverted Hammer
What it looks like: A small body with a long wick on top, like an upside-down hammer.
What it means: It can appear at a support level (bullish signal, the price could rise) or at a resistance level (bearish signal, the price could fall). It depends on the context:
At a support: Buyers tried to move up and, although they were rejected, it shows interest in buying.
At a resistance: Buyers tried to break the ceiling, but sellers won.
ExampleIf Bitcoin reaches $40,000 (resistance) and forms an inverted hammer with a wick touching $40,500, it could drop to $39,000. However, if it breaks through support at $30,000, it could rise.
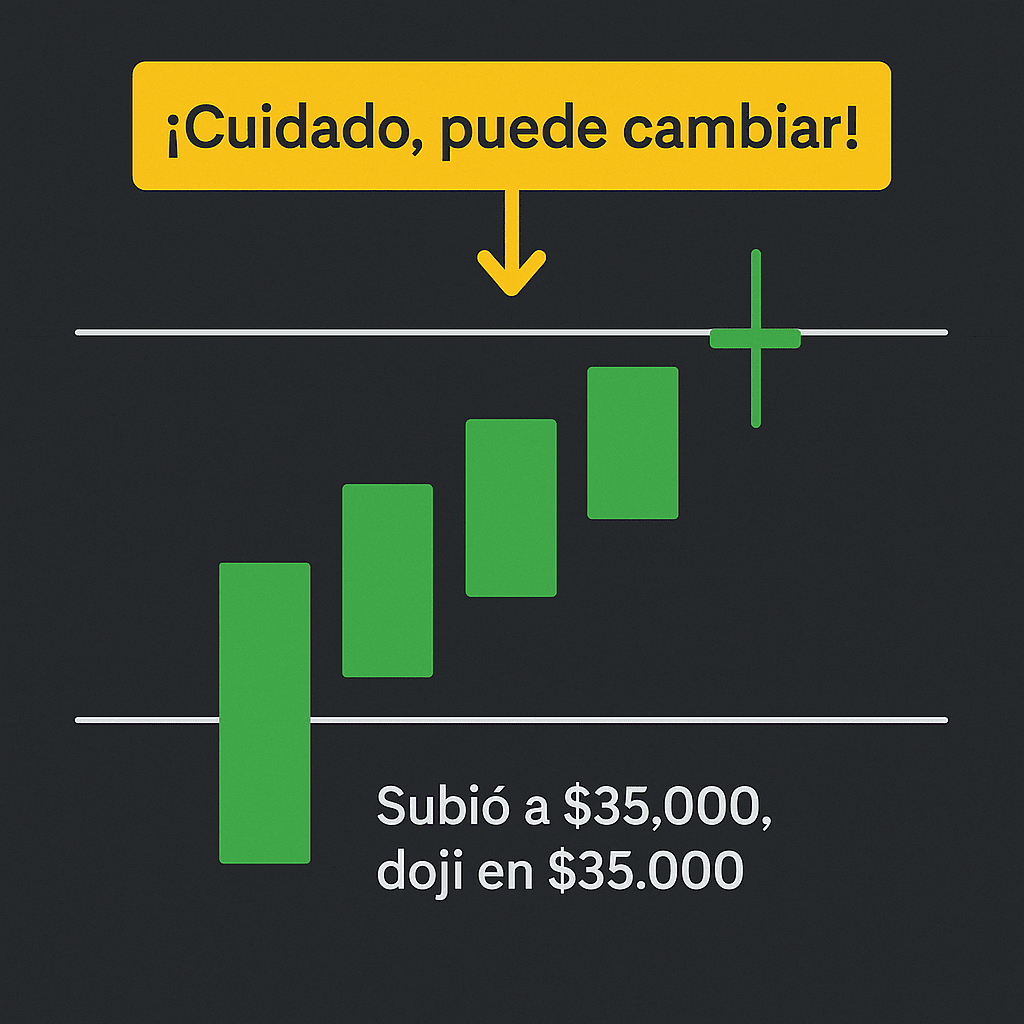
Doji
What it looks like: A super small body, almost a line, because the price opened and closed almost at the same time. It can have long or short wicks.
What it means: It's a "tie" between buyers and sellers. If it appears after a long rise, it could be a sign that the price is "tired" and could decline or pause. The same is true if it appears after a decline.
ExampleIf Bitcoin rises from $30,000 to $35,000 in a few days and forms a doji at $35,000, it could drop to $34,000 or stabilize.
Surrounding
What it looks like: A large candle that completely “covers” the previous candle, as if embracing it.
What does it mean:
Bullish Engulfing: A large green candle covering a small red candle. Buyers have taken control. This could be a bullish signal.
Bearish Engulfing: A large red candle covering a small green candle. Sellers have won. This could be a bearish signal.
Example: If Bitcoin drops to $30,000 (support) and forms a bullish engulfing (green candle covering a red one), it could rise to $32,000.
7. How to use candles with supports and resistances?
Candlesticks are easier to understand if you look at them in special places on the chart: support and resistance levels.
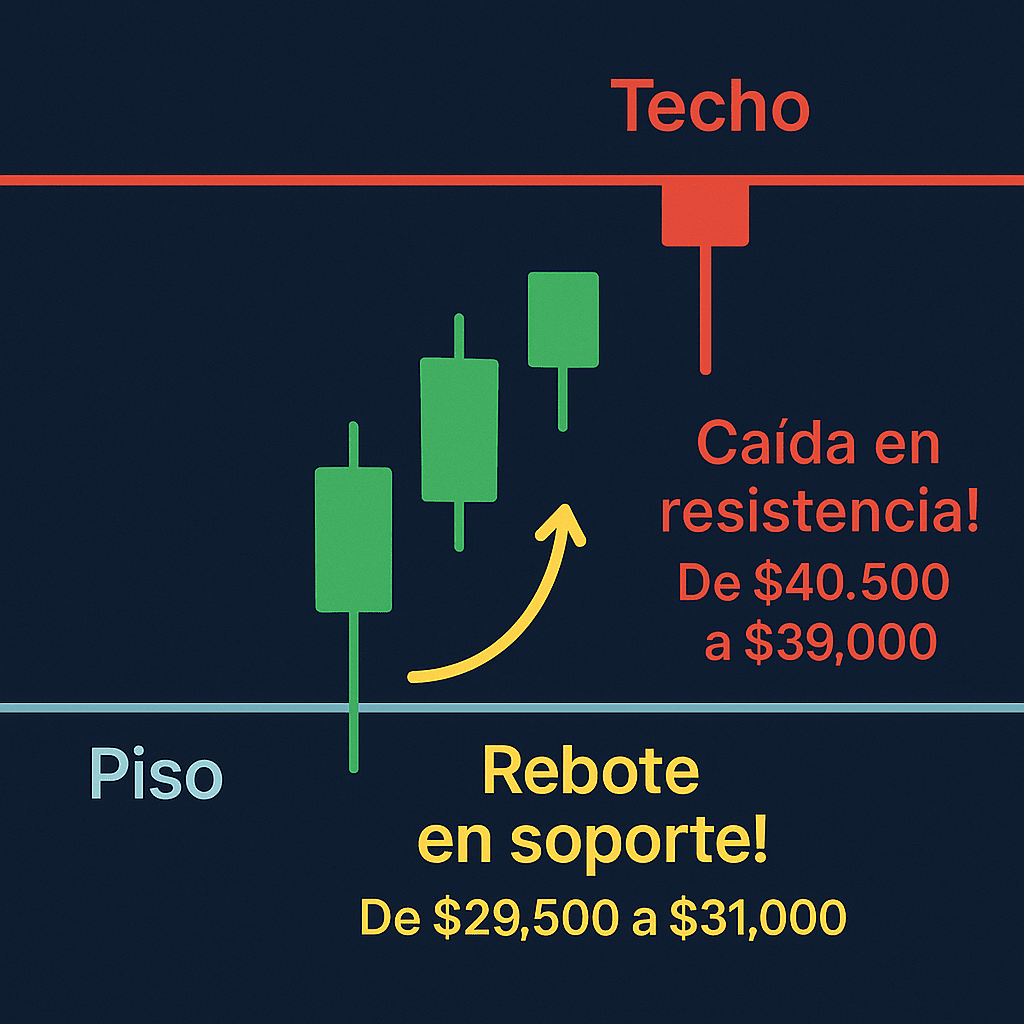
Support: This is like a floor where the price usually stops falling because many people start buying. A hammer or bullish engulfing support is a strong signal that the price may rise.
Example: If Bitcoin drops to $30,000 (a support) and forms a hammer, it could bounce to $31,500.
Resistance: This is like a ceiling where the price usually stops rising because many people are selling. An inverted hammer or bearish engulfing at a resistance level can indicate that the price is going to fall.
Example: If Bitcoin reaches $40,000 (resistance) and forms a bearish engulfing, it could fall to $38,500.
If there's a lot of volume (i.e., a lot of people buying or selling), candlesticks are more reliable. For example, a high-volume hammer at a support level is stronger than one with low volume. On Binance, you can see volume below the chart as green and red bars.
8. How do I view charts on Binance?
To view Japanese candlesticks on Binance, follow these steps:
Go to Binance and select your cryptocurrency pair (e.g., BTC/USDT).
Click on the Trading tab and choose the chart (either the simple chart or the integrated TradingView chart).
Adjust the time frame (1m, 15m, 1h, 1d, etc.) at the top of the chart.
Use the horizontal line tool (in the drawing menu) to mark supports and resistances.
Look at the volume below the chart to confirm whether the candles have strength.
If you are a beginner, start with longer time frames (1 hour or 1 day) because they are clearer and have less noise than 1-minute charts.
9. Indicators that help candles
Candlesticks are great, but they are even stronger if you combine them with other indicators on Binance:
Moving averages: These are lines that average the price over time. If a hammer candle appears near a moving average (such as the 50-day), the signal is more reliable.
RSI (Relative Strength Index): Measures whether the market is “overbought” (very high) or “oversold” (very low). For example, a hammer at a support level with a low RSI (below 30) can be a strong buy signal.
Volume: If a special candle (such as an engulfing) has a lot of volume, the signal is more likely to be correct.
You can activate these indicators on the Binance chart by clicking the “Indicators” button at the top.
10. What did I learn today and what's next?
Today I realized that Japanese candlesticks are like the letters in a story: each one tells me something about the market. I learned:
That the green candles go up and the red ones go down.
The wicks show if there was a fight between buyers and sellers.
To recognize special candles such as hammer, inverted hammer, doji and engulfing.
That candles are stronger at support or resistance levels, especially with high volume.
How to find charts on Binance and use basic tools.
What I like most is that now I look at a graph and don't just see lines; I see a story! You don't have to know everything at once, but I understand a little more every day.
Next steps:
Practice looking for hammers, dojis, and engulfing patterns on Binance charts.
Learn multi-candlestick patterns, such as the “Evening Star” (bearish signal) or the “Morning Star” (bullish signal).
Use a demo account on Binance (if available) to practice without risking any money.
Explore indicators like moving averages and RSI to confirm what the candles are saying.
11. Beware of the risks!
Technical analysis, such as reading Japanese candlesticks, is extremely useful, but it's not magic. Cryptocurrencies are highly volatile, and prices can move based on news, events, or things you can't see on the chart. Never invest money you aren't willing to lose, and if you're a beginner, practice first on a demo account or with small amounts.
12. Question of the day
Have you ever looked at a Binance chart and seen a candle that caught your eye? Did you spot a hammer or a doji that made you think, "This is important"? Let me know in the comments!
If I made a mistake, if you use a different name for candles (shadows instead of wicks?), or if you have any extra tips, leave them in the comments! Also, let me know if you've ever successfully traded a hammer or doji. I'm learning and want to improve every day. Thanks for reading! 🙌
#CriptoDesdeCero #EducaciónFinanciera #velasjaponesas. #DIA7 #BinanceSquare $WTC