It's been 4 days since I started posting on Binance Square.
I don't have great results.
I don't have thousands of followers.
I don't have any income yet.
But I do have something that doesn't show in the statistics:
I'm building a habit. I'm taking something seriously that I used to leave half-done.
What happens after the initial enthusiasm?
The first day is pure motivation.
The second day still has momentum.
But by the fourth day, that feeling of:
"Is it worth continuing?"
And that's where many get stuck. Not because they can't.
But because they expected results more quickly.
I don't want that to happen to me.
I didn't come for an immediate result. I came to understand.
To gain clarity. To develop consistency.
I've been researching: what are moving averages?
Yesterday someone left me a comment asking me to talk about moving averages 7, 25, and 99.
I'm not a trader. I don't use complex charts.
But I got curious and started to research a bit.
Moving Averages
Imagine you're at the beach watching how the waves go up and down.
The water moves quickly, like the price of Bitcoin. Sometimes it goes up, sometimes it goes down. A mess.
Then you take a long ruler and place it on the water.
It doesn't measure every wave, but it does show you if overall the level is going up or down.
That rule is a moving average: a line that shows the average price over the last few days.
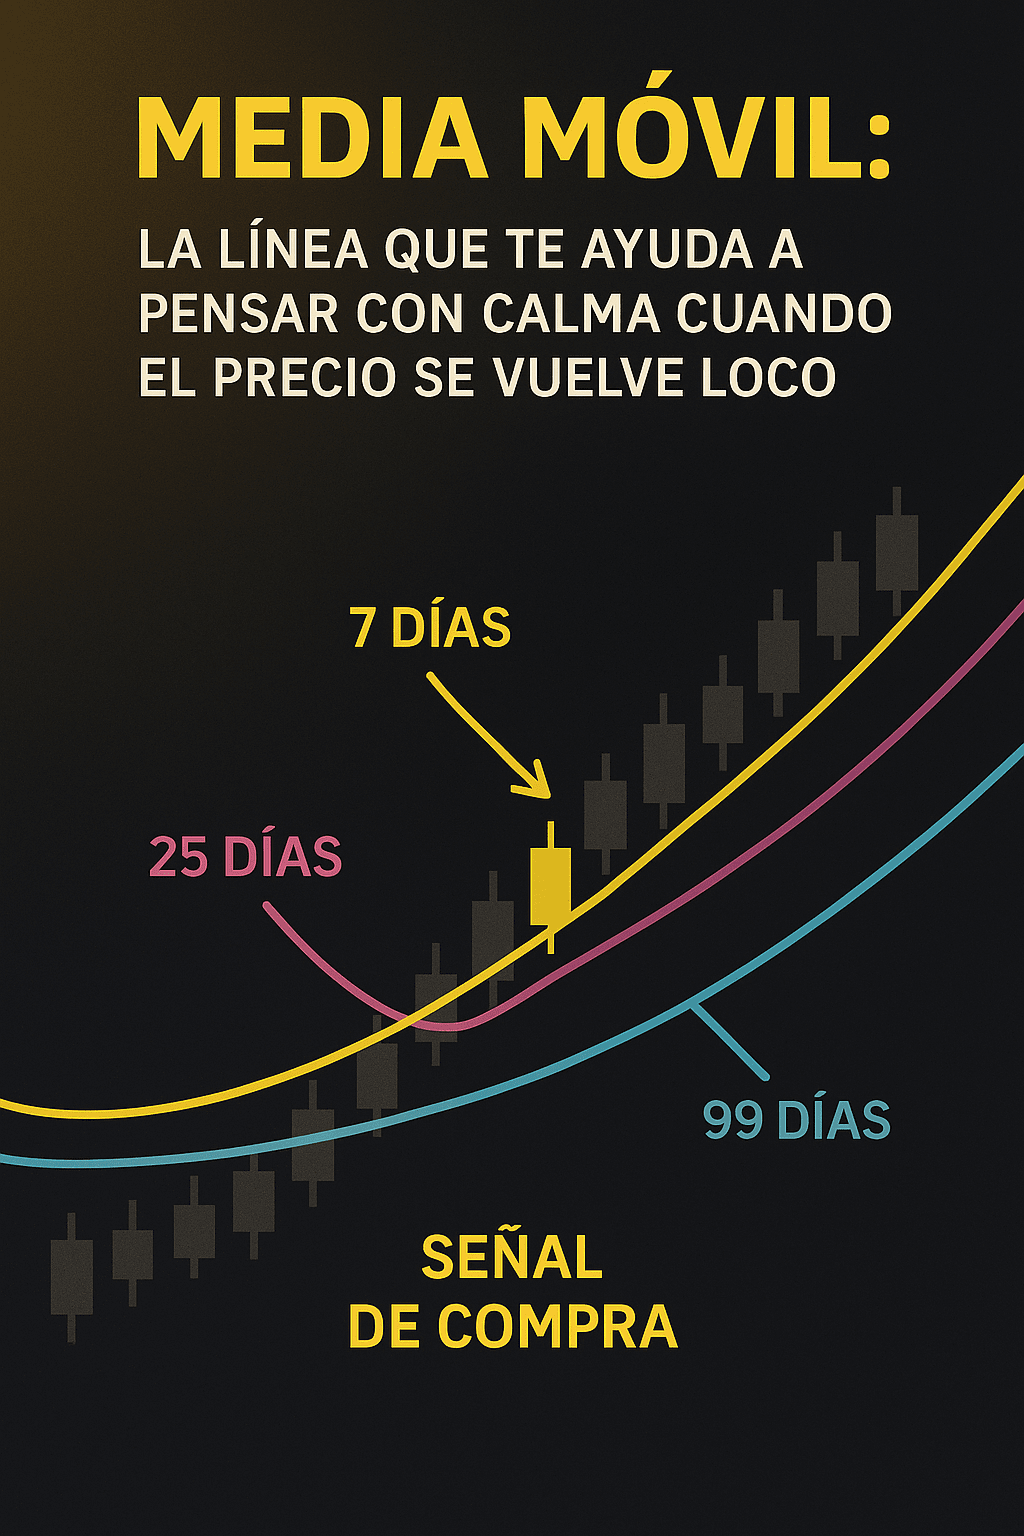
🔢 What do the numbers mean?
7-day average ➜ the average of this last week
25-day average ➜ the average of the last month
99-day average ➜ how everything has been in the last 3 months
Each one views the market differently:
one is fast (7), another more stable (25), and the other slow and calm (99).
And what happens if they cross?
Many traders believe that:
If the 7-day moving average crosses above the 25-day ➜ the price could go up more (buy signal)
If the 7-day crosses below the 25-day ➜ possible drop (sell signal)
If the 7-day crosses above the 99-day ➜ possible strong trend change upwards. Many see this as a more powerful long-term buy signal.
If the 7-day crosses below the 99-day ➜ warning of significant weakness. It can mark the beginning of a prolonged decline or confirm a bear market.
⚠️ But attention:
The moving averagesdo not guarantee success.
They are not magical or infallible.
But they help you tothink more clearlyand tosee the general trend, instead of reacting impulsively to every price jump.
I prefer to understand something that doesn't guarantee winning, rather than follow something I don't understand, just because 'everyone uses it.'
I also understood something about Japanese candles
While researching moving averages, I came across something that everyone mentions: Japanese candles.
I didn't know what they were, but now I understand them like this:
Each candle is like a little box that tells you what happened to the price in a period of time (1 minute, 1 hour, 1 day, etc.)
A candle shows you 4 data points:
Opening price (how much it was worth at the start of the period)
Closing price (how much it was worth at the end)
Highest and lowest price in that interval
If the price went up ➜ the candle is green
If the price went down ➜ the candle is red
You don't need to be an expert to start looking at these things.
Understanding a candle helps you see how the price moved instead of just staying with 'it's going up or down.'
The curious thing is that something as simple as a candle can help you make better decisions if you know how to read it.
And that motivates me to keep learning.
And you? What do you do when you don't see results right away?
I read everything that is shared with me. I'm interested in understanding how those who are also starting out think.
#Día4 #CriptoDesdeCero #BinanceSquare #CryptoParaPrincipiantes #VelasJaponesas $WTC