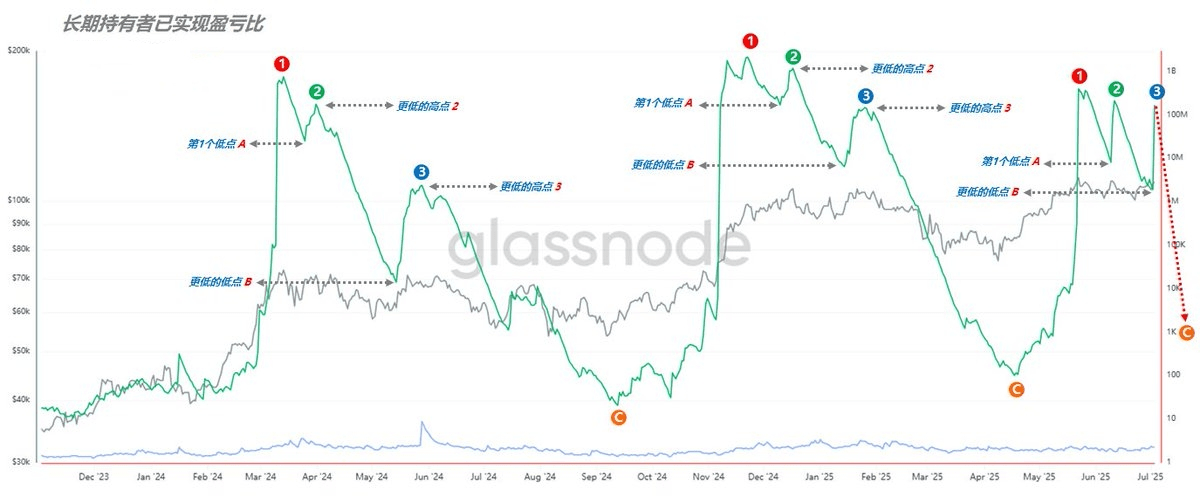
As the Bitcoin price gradually approaches historical highs, key on-chain data is once again releasing important signals — long-term holders have realized their profit and loss ratios, repeating the trajectory patterns seen before past bull market peaks.
From the perspective of indicator change paths, first, on May 22 this year, the data showed 'Peak 1', then on June 9 and July 2, 'Low Point A' and 'Low Point B' were clearly constructed, and 'Peak 2' appeared on June 11. This structure is highly similar to the previous two top cycles.
(Figure 1)
According to historical samples, if this indicator rises again and forms 'Peak 3', we may witness the final rally of Bitcoin price, with the target area expected to fall around $115,000, which is also one of the technical upper limits indicated by the current extreme deviation in MVRV pricing range.
However, it is worth noting that such rebounds often have the nature of 'ultimate baiting', and whether there will be a 'Peak 4' remains unknown. After 'Peak 3', if the price fails to continue rising, and this indicator shows systematic decline, the market structure may gradually enter consolidation or even downward adjustment.
The subsequent key point lies in the confirmation of 'Low Point C'. Once this point appears, it usually marks the formal completion of the adjustment of the major cycle trend, providing the foundation to welcome a new round of trend. If the C point has not yet formed, Bitcoin as a whole will still be in a volatile range, characterized by sideways consolidation or gradual pullback.
Additionally, it's worth considering macro variables. If similar 'black swan' events occur as in the past (such as stock market crashes, geopolitical frictions, or policy shocks), the extent of the pullback will significantly deepen. However, if macro expectations are warmer, it is more likely to complete repairs through a time-for-space oscillation.
(Figure 2)
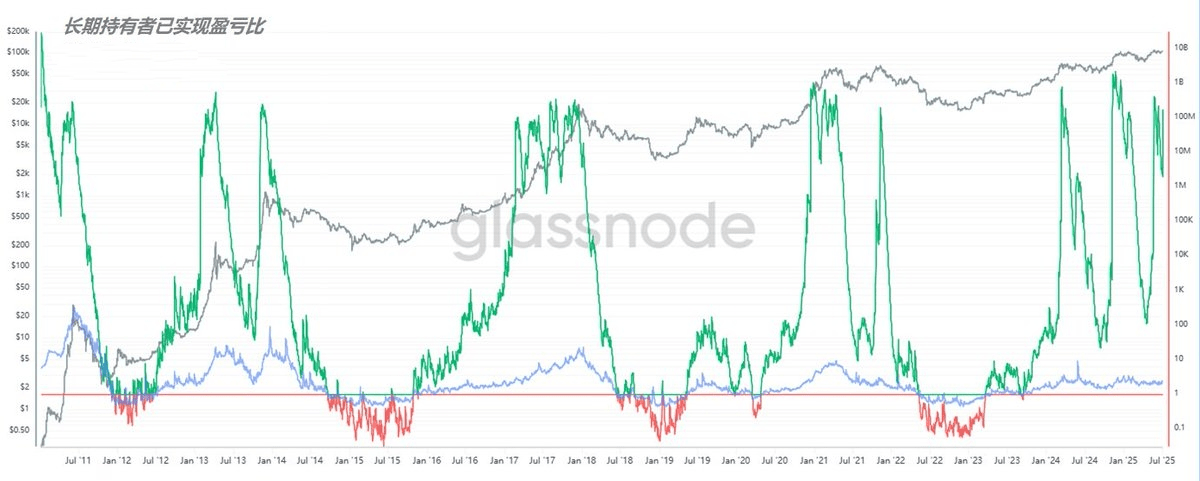
Players should establish a layered understanding framework based on the data structure of different time cycles. The 'demand warming' in the short to medium term should not be confused with the 'profit and loss structure differentiation' in the long term, to avoid misjudging market rhythms due to information mismatch.