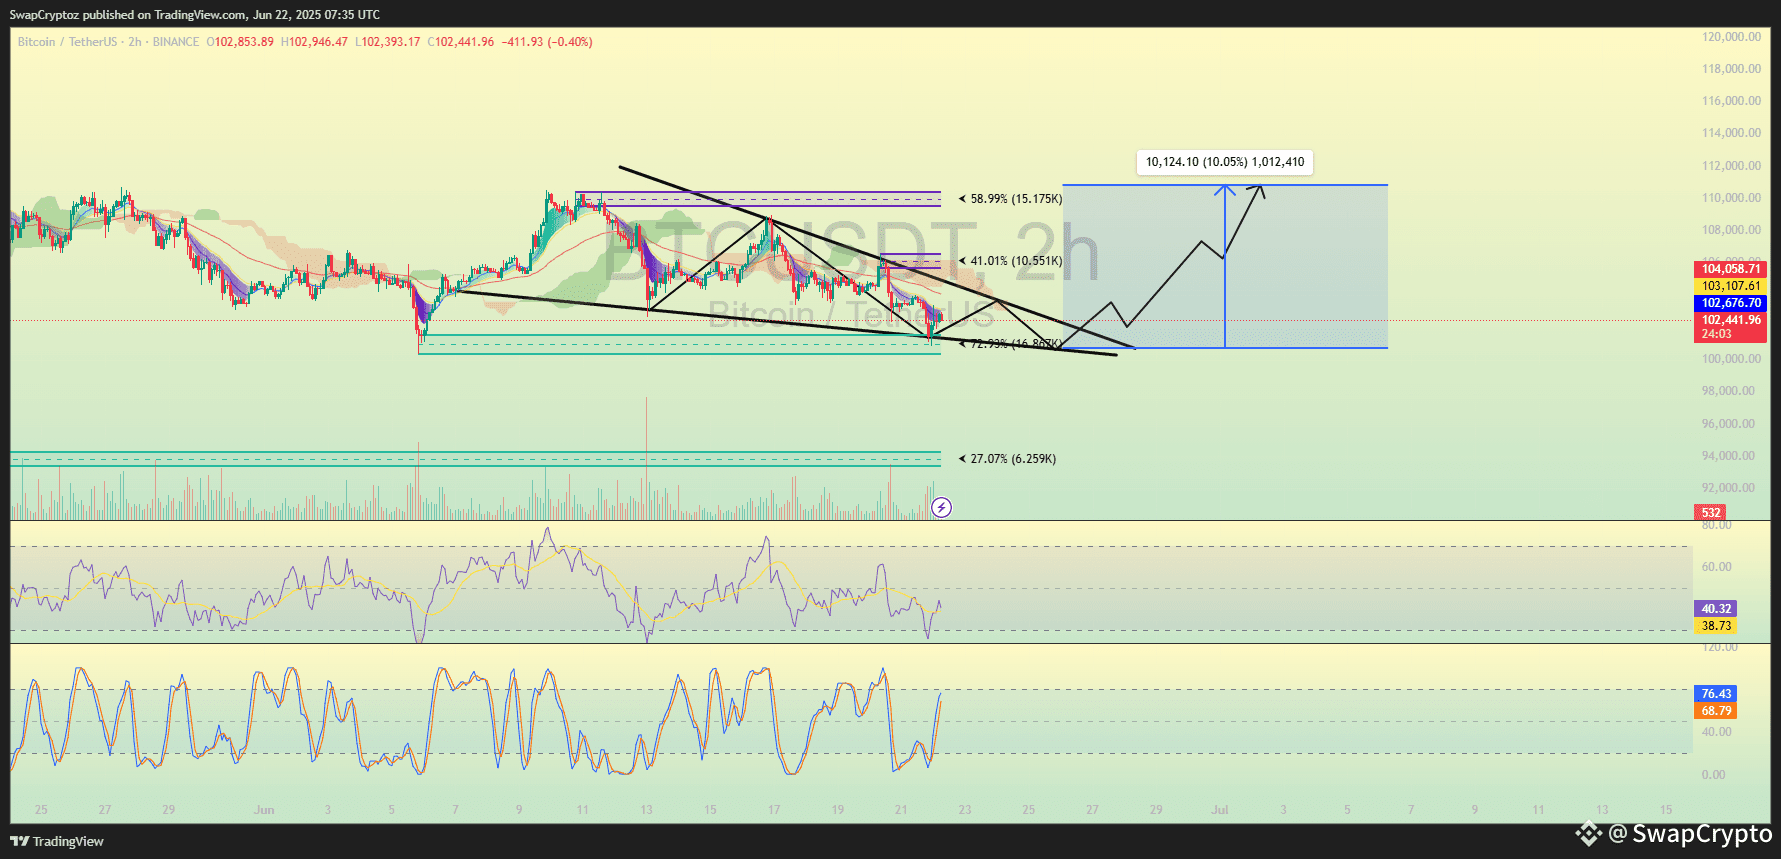
This BTC chart shows a bullish falling wedge pattern with breakout potential. RSI is rebounding from near oversold (38.85), and the stochastic RSI is crossing upward (69.70 & 79.16), signaling bullish momentum. Volume shows buying interest at support. If price breaks the wedge resistance, a 10%+ move toward $112K is likely. I’m 97% sure BTC will pump soon. 🚀
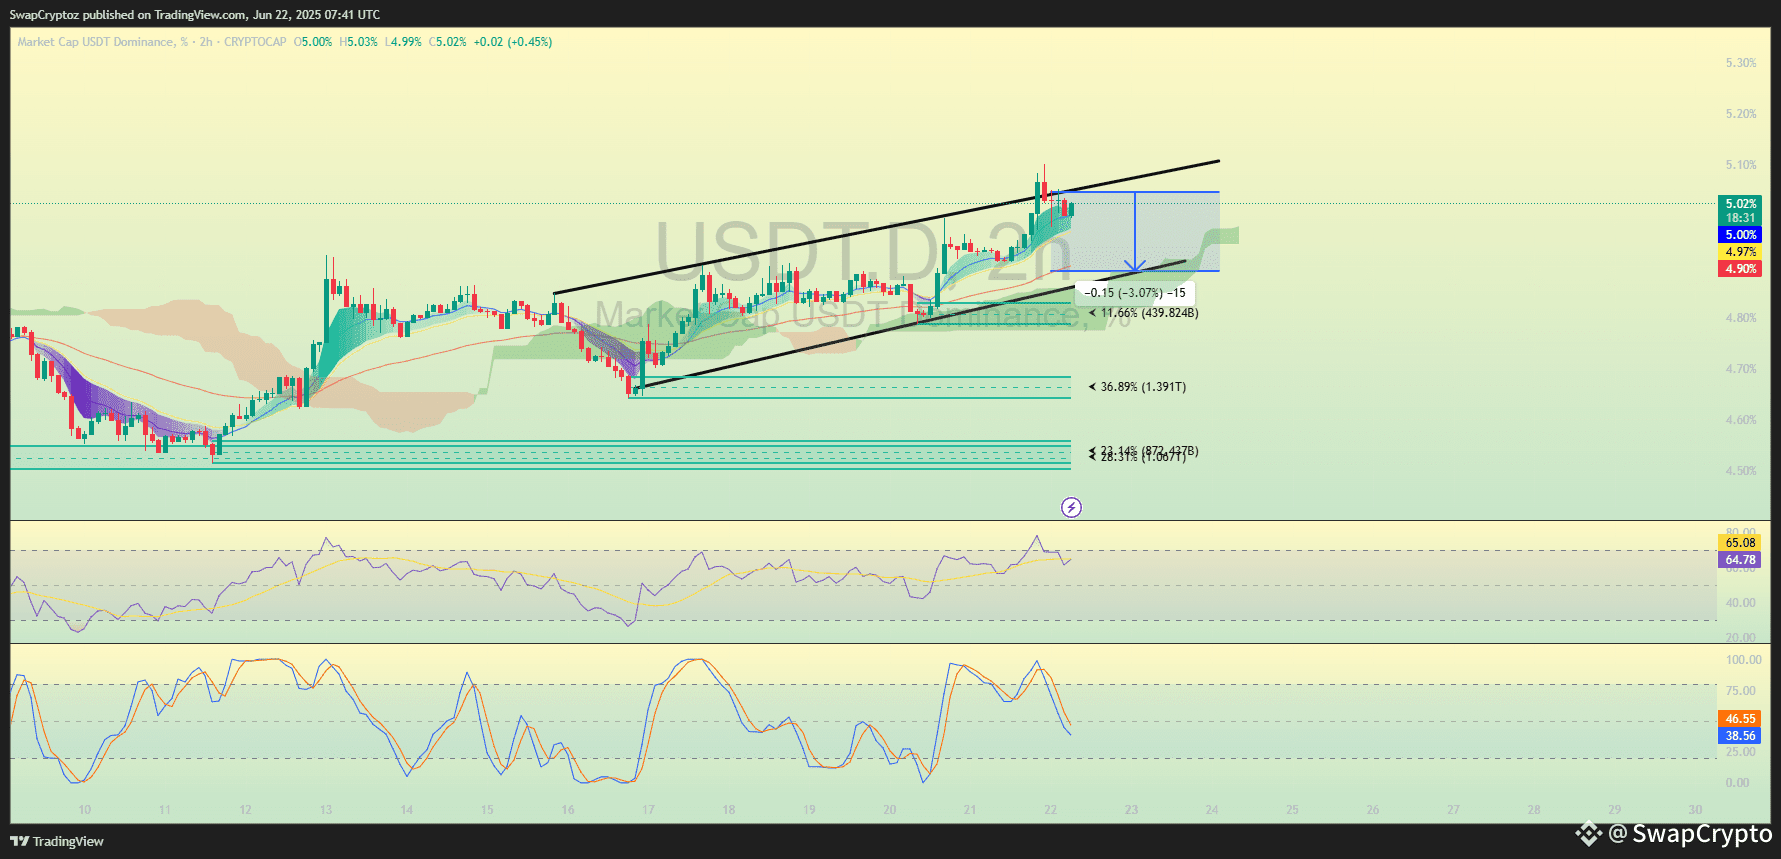
USDT.D is forming a rising wedge, typically bearish. RSI is overbought near 65 and starting to drop. Stochastic RSI is crossing down (46.55 & 38.56), signaling weakening momentum. If support breaks, a 3%+ drop is likely. So I’m 97% sure USDT.D will dump and 99% sure BTC is bullish. 🚀
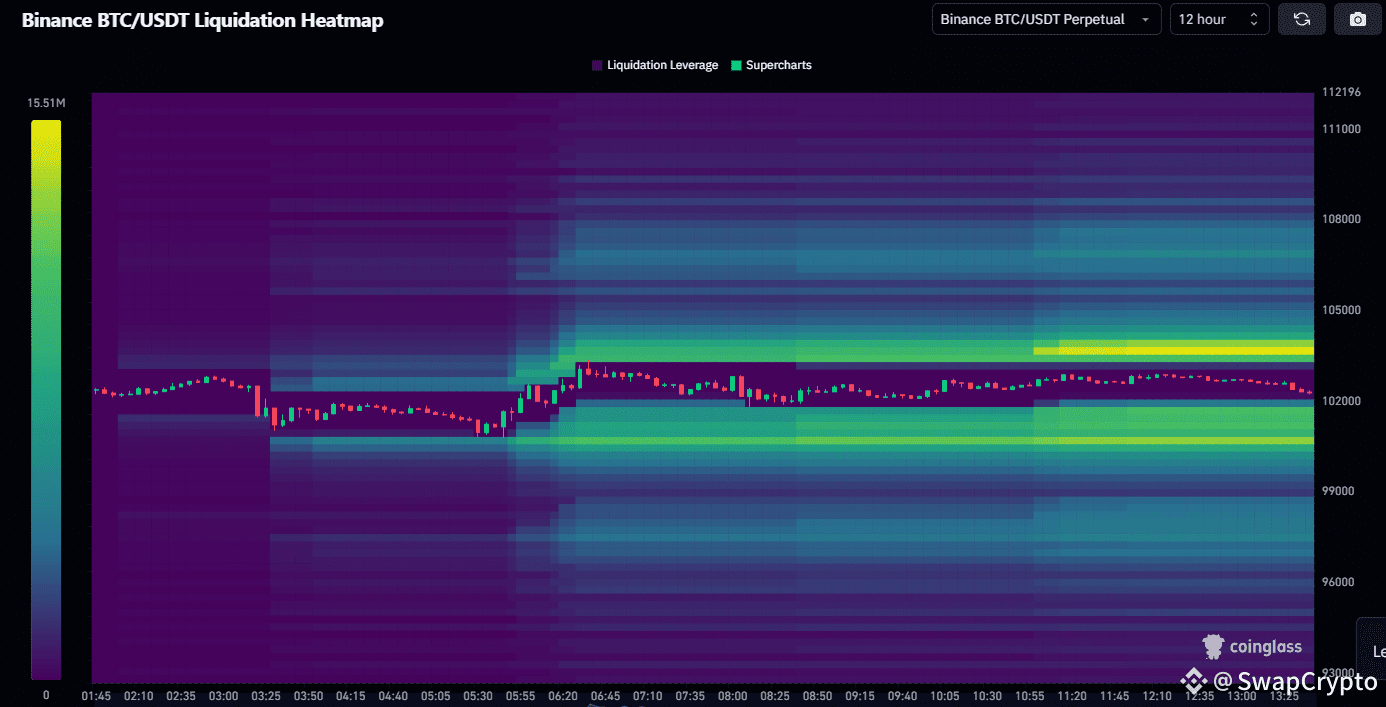
This Binance BTC/USDT liquidation heatmap shows heavy liquidity stacked near $105K–$108K, indicated by bright yellow zones. Price often moves toward high-liquidity zones to trigger liquidations. Current consolidation around $102K with strong upward pressure suggests a breakout soon. So I’m 99% sure BTC is bullish and ready for a strong move. 🚀
Entry: 100852.47
1st Tp: 104762.98
2nd Tp: 106335.69
3rd Tp : 108843.52
4th tp : 110798.78
For more details, check out my bio by clicking on my profile.
This signal is only for spot if you want future signals join my binance live.
Just click on my profile to join my live.