
The situation on the BTC price chart does not favor growth at the moment. In the evening, from the Strong Signal mark of the potential low on the 30-minute timeframe, the price, as forecasted in the chat, went to test the local trend resistance from the high of June 17. The bulls' reaction to it was good; there was a breakout of the trend line, a retest of the breakout, and for now, the price is in a range.

However, it is still difficult to call the situation bullish. Because a sustainable uptrend is currently only on the 30-minute timeframe, on the hourly, 2-hour, and 3-hour timeframes - it is not. And on the 4-hour timeframe, there is a real risk of falling into a sustained downtrend.


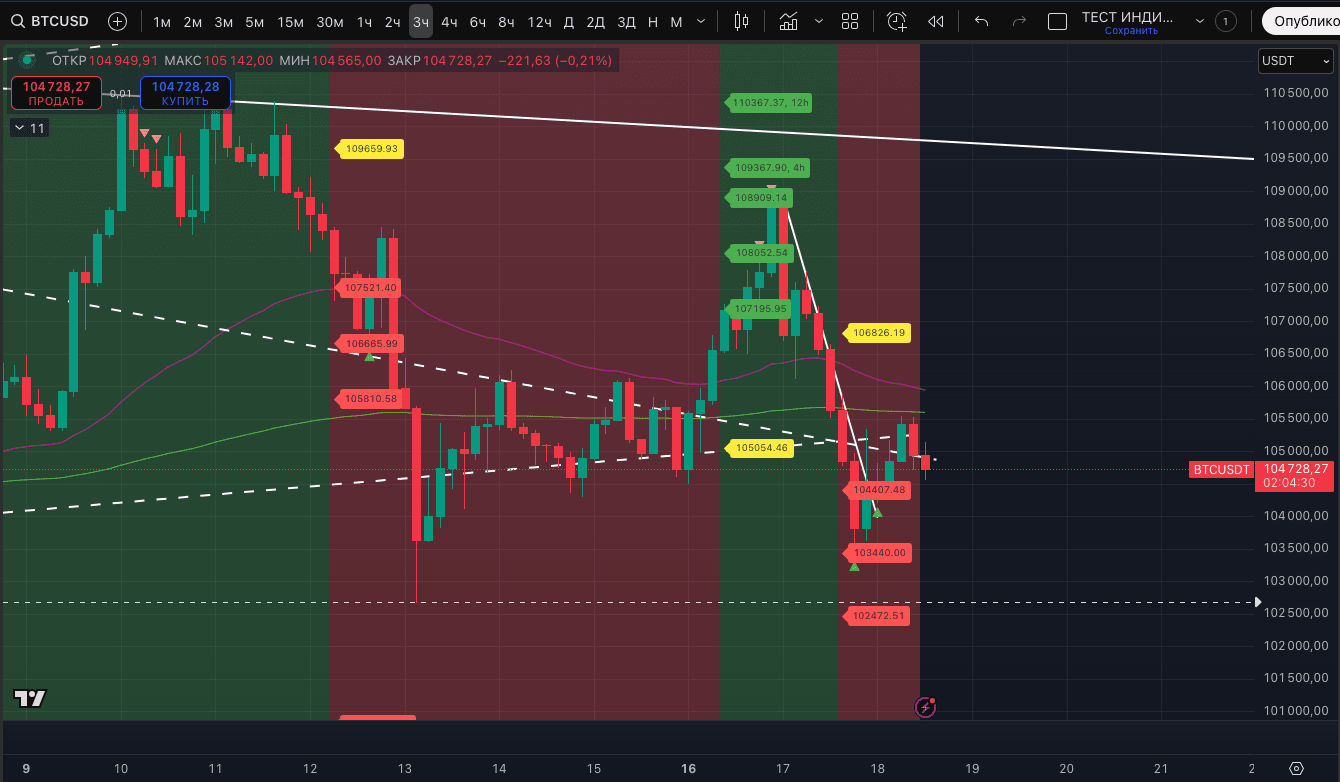

In addition, the price cannot recover above the EMA range on the 30-minute timeframe and higher. All of them are currently in the range of $105,200 - $106,081. Representing crucial resistance. The key level among them is still the EMA 50 on the 12-hour timeframe, which is at $105,593. The more reactions we get from sellers at this level, the higher the likelihood of testing the trend line from the lows of May 12 and June 5. The current level is at $100,265. Such a decline would allow us to gather long liquidity near the recent lows of the last two months. Important support on the way to this is the EMA 50 on the daily timeframe, currently at $103,094. For now, this is our base scenario, and from these levels, we will be looking for reversal signals.
By the way, according to horizontal levels, our second indicator suggests - as long as the price is below $104,842 - it may be impulsively delivered to $103,715. Other important supports and resistances are on the screenshot.

The most bullish scenario we have right now is if a 'Dragon' pattern forms on the chart from June 17. That is, if the price updates the low of $103,371 today or tomorrow, then breaks the trend line from yesterday's high and works out one or two targets of the pattern. The first target is $105,550, the second is $108,952. The chart is currently forming a structure that could result in a 'Dragon', but it's still too early to bet on this scenario; it's just a hypothesis and what we would like to see from the bulls. The technical signals from our indicator currently cast significant doubt on this scenario.
The most bearish correction scenarios we currently consider are tests of two moving averages:
- EMA 50 on the 2-day timeframe (currently at $99,118, not tested since the end of April),
- EMA 200 on the 12-hour timeframe (currently at $98,755, also not tested since the end of April).


The main expectations remain the same - active growth towards a new ATH, most likely already this month. And it's important to catch its start.