
There are still no buyers for BTC capable of bringing the price back up.
Yesterday's correction after the Fed's decision and Powell's speech was quickly 'regained' by the BTC price. Breaking the descending trend line since June 17 and compressing under the EMA 50 of the hourly timeframe. But it all ended in a range, and in the last three hours, the price continued to move down.


The decline since June 17 would be considered a 'Dragon' if not for:
- the fact that the second low did not rewrite the low of the first low. Liquidity below the low of June 17 at $103,371 has not been removed, and this is bad for growth.
- According to our indicator, the price is in a downtrend on all key timeframes from hourly to daily, except for the 8-hour and 12-hour timeframes. And yesterday evening, the price transitioned into a stable downtrend on the important 4-hour timeframe.
All of this has already been mentioned. And the last three hours finally arranged everything in its place - the price went down, which could not happen with a 'Dragon'.
We currently see no reasons to reconsider our expectations for a correction. At least until the price starts to recover above the EMA 50 and 200 hourly timeframes. They are currently in the range of $104,886-$105,833. The key resistance by EMA remains the same - EMA 50 of the 12-hour timeframe, which is currently at $105,495.

Let's repeat the important part from yesterday's review, only updating the EMA levels:
... EMA 50 of the 12-hour timeframe, which is at $105,495. The more reactions from sellers we get from it - the higher the likelihood of testing the trend line by the lows of May 12 and June 5.
The most bearish correction scenarios that we currently allow are tests of the two moving averages:
- EMA 50 of the 2-day timeframe (currently at $99,066, not tested since the end of April).
- EMA 200 of the 12-hour timeframe (currently at $98,922, also not tested since the end of April).
The main expectations remain the same - active growth towards a new ATH, most likely already this month. And it's important to catch its start.
Currently, locally, according to our indicator, there can be no talk of reversal signals - there are no low markers on higher timeframes or at least a Strong signal low on hourly timeframes. Even on the 30-minute timeframe - downtrend.
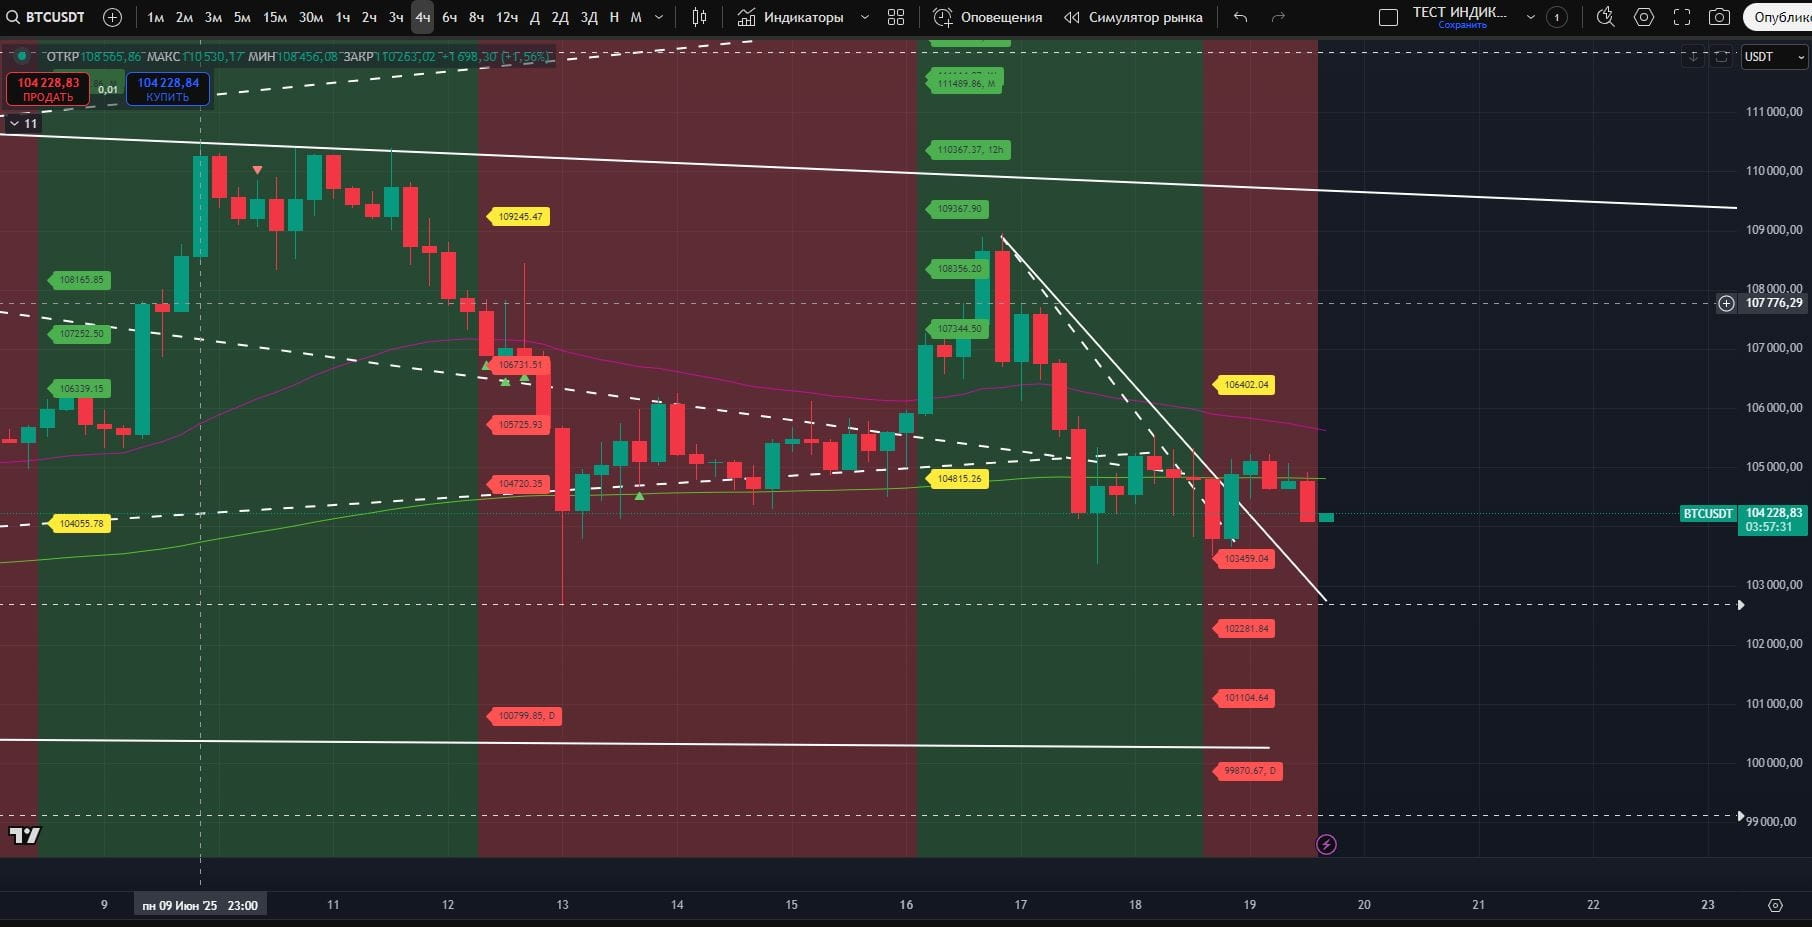
As long as the situation remains, we are focusing on the complete fulfillment of the targets of the stable downtrend of the 4-hour timeframe: $102,281, $101,104. Beyond that - we will see. But with such buyer activity - this is not the limit. Especially if the price plunges into downtrends on the 8-hour and 12-hour timeframes.
On important horizontal levels - as long as the price is below $104,842 - it is heading towards targets of $103,715, $103,152, $102,776, and the next closest one from the screenshot.
