Hello everyone, welcome to watch thousands of trend discussions. We focus only on the trends of mainstream coins. The research on left and right trading models, as well as the understanding of medium to long-term and short-term fluctuations, will continue to be updated. Thank you all for your attention. In the crypto world, when some people laugh, others will cry. I hope everyone is among the former!
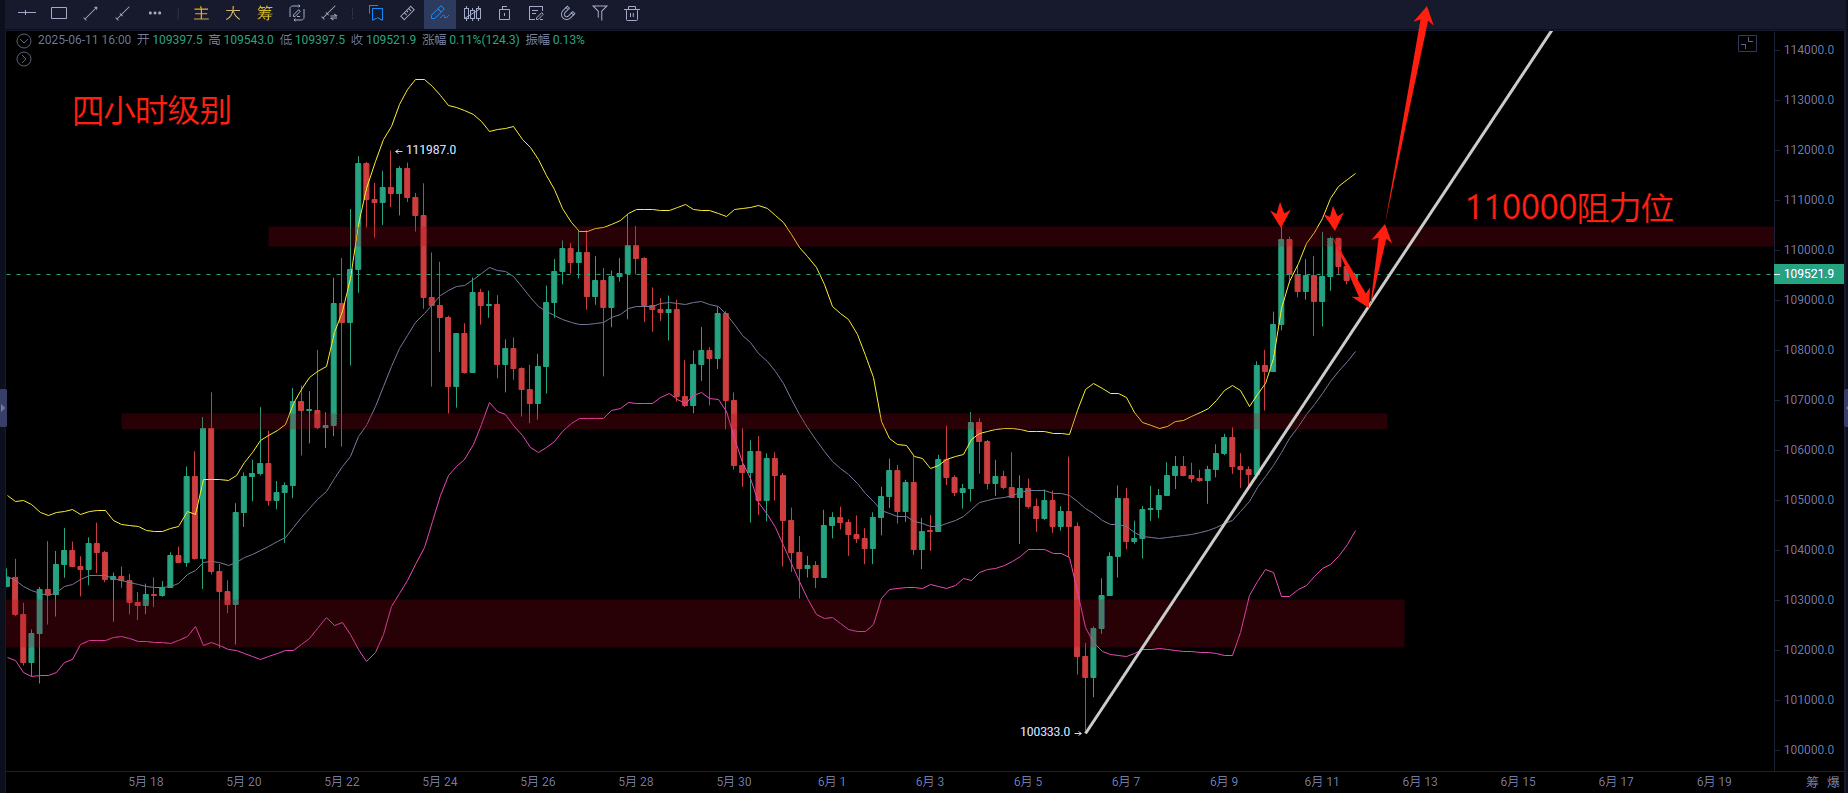
Let’s first look at Bitcoin. Yesterday, after testing the previous high, the effectiveness of the resistance level was very clearly demonstrated, and then it dropped. After testing again, it dropped again. In smaller time frames, it actually provided you with two opportunities to short, which is the key performance of the resistance level. Today, the focus is on the daily chart, which has shown five consecutive bullish candles. Let’s look back in time. The bullish strength of Bitcoin was already very strong in the previous day's bullish candle. Then, immediately yesterday, it formed a bearish candle, indicating that the bears were resisting, but in the end, they were completely pushed back, closing with a long lower shadow. This dragonfly doji is a very bullish candlestick. Today, we will continue to pay attention to whether it closes bullishly and breaks through and stabilizes above. Looking at the current situation of the Bollinger Bands, the three bands are in a very horizontal state, indicating that Bitcoin is currently in a consolidation phase and there are even signs of narrowing. However, if today or tomorrow a series of strong bullish candles occur, the previous high will not hold. This week is expected to create a historical high, and the Bollinger Bands will open up. In the short term, it may quickly reach 120,000, but do not guess right now. What you need to do is wait. This is just a likely trend going forward. The market looks like the resistance level is adjusting and preparing for a big move. We need to give the market some time.
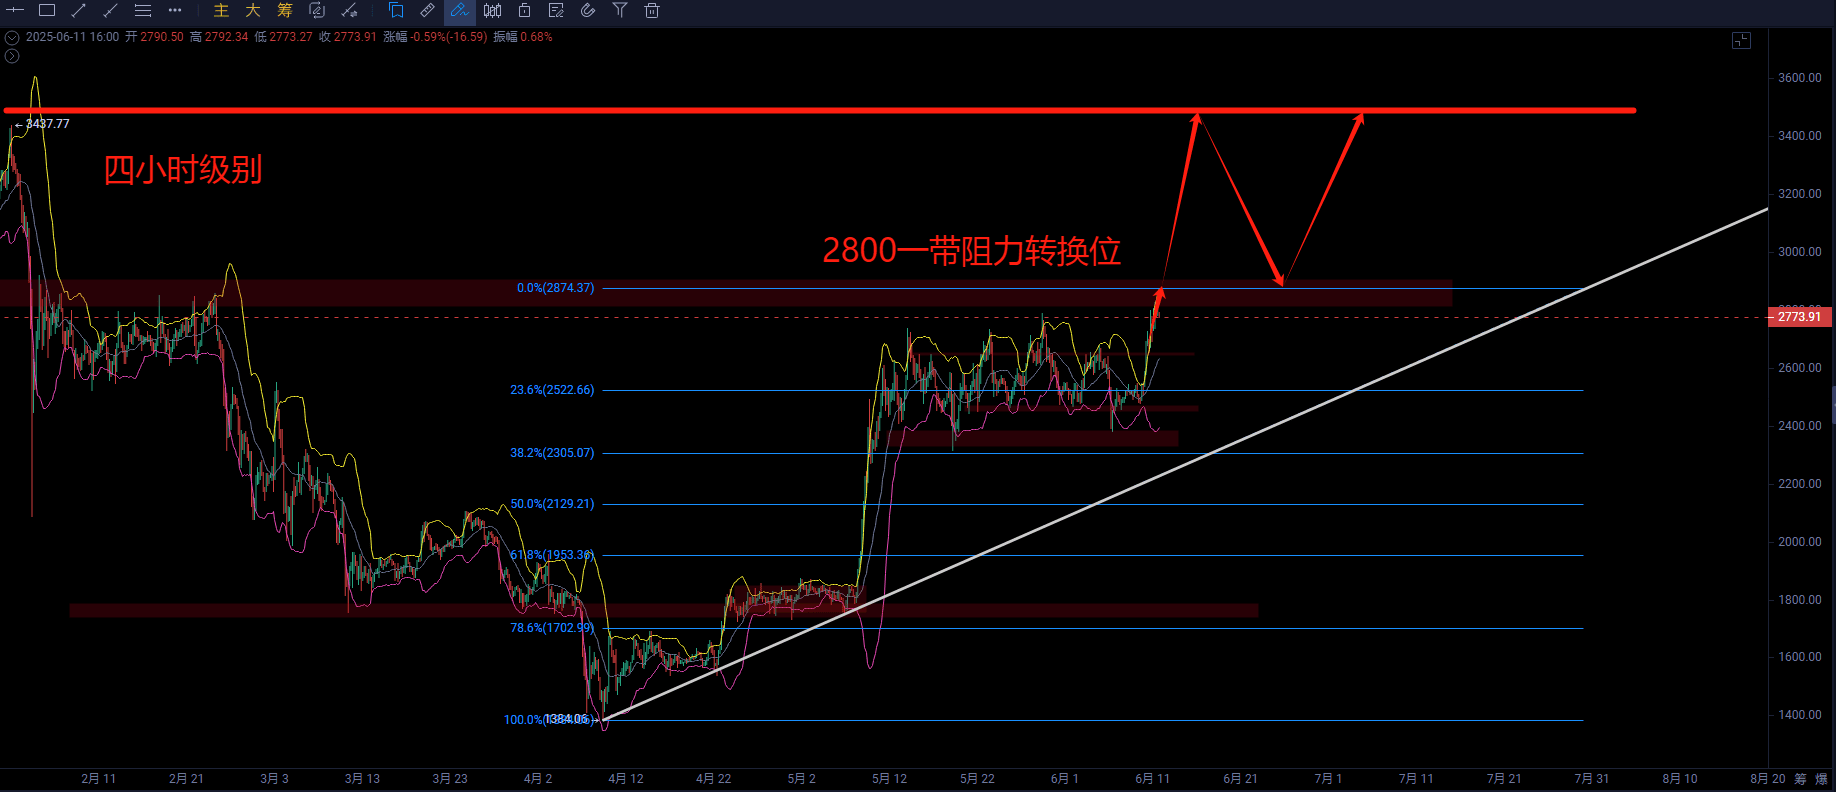
Looking again at Ethereum, the daily chart level has shown strength. The previous oscillation range has been broken. A breakout of the Bollinger Band has now been completed, and the bulls are very strong. Currently, it is highly likely that today will continue with a bullish trend. I do not recommend everyone to rashly guess the top. From the four-hour perspective, Ethereum has been acting strongly since the 2580 mark, and the price has been outside the band. Although it is currently in a retracement state, we see that the lower and middle bands are still in a bullish position. Therefore, I recommend that those who still have profitable long positions can hold on patiently and not rush to short. Although this position previously provided a key support-resistance conversion on the daily chart, from the current situation, I personally believe that this resistance zone cannot hold, so it is very likely to continue pushing upwards. Just how much patience do you have to hold on!
In the crypto world, it is a contest between retail investors and the big players. If you do not have cutting-edge information or first-hand data, your starting line is not equal. The countless efforts are intended to help more people learn to trade and become self-sufficient!
The article is time-sensitive, and the market changes constantly. The real market is the main focus; the above advice is for reference only!
Investment carries risks, and caution is required when entering the market.#BTC #ETH $BTC $ETH

