Ethereum made a strong move again last night, breaking through 2800 and hitting a recent high. Will it continue to rise, or will it peak and fall back?
The daily chart of Ethereum currently shows a clear upward trend, with a new high after the second center formed, entering a divergence phase. From the MACD perspective, the probability of a top divergence in the future is close to 100%.
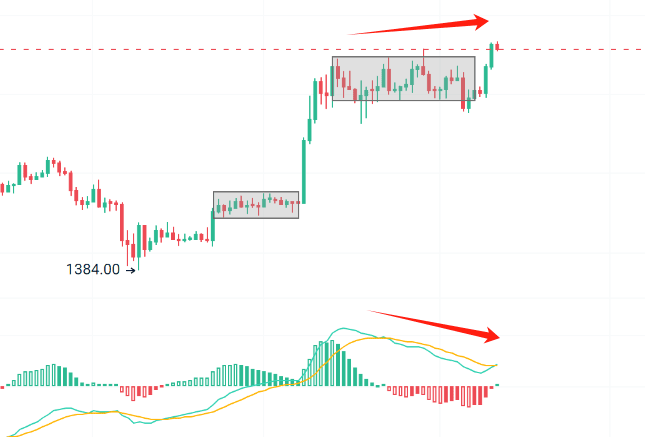
The divergence phase of the upward trend on the daily chart is also a trend structure at the 4-hour level. Currently, the second center is being constructed, and this center is above the previous range. This will create three buying points on the daily chart. Once the 4-hour upward trend completes, the upward trend on the daily chart will also end, at which point a significant pullback will begin.
So, when will this 4-hour period end?

From the trend chart, it is now reconstructing the second 4-hour center, similar to the consolidation from the 6th to the 9th. It needs to consolidate for a while here, and if there is a new high afterwards, it will be time to seize shorting opportunities.