Bitcoin has been on a rollercoaster lately, with eyes glued to the magical $100K level. However, the current short-term price action suggests that the market might not be ready for a clean breakout just yet. In fact, the charts are showing signs that BTC could dip from $100K toward $98K — or lower — in the coming sessions. Let’s break down why:
🔎 1️⃣ High Selling Volume on 15-min & 1-hour Candles

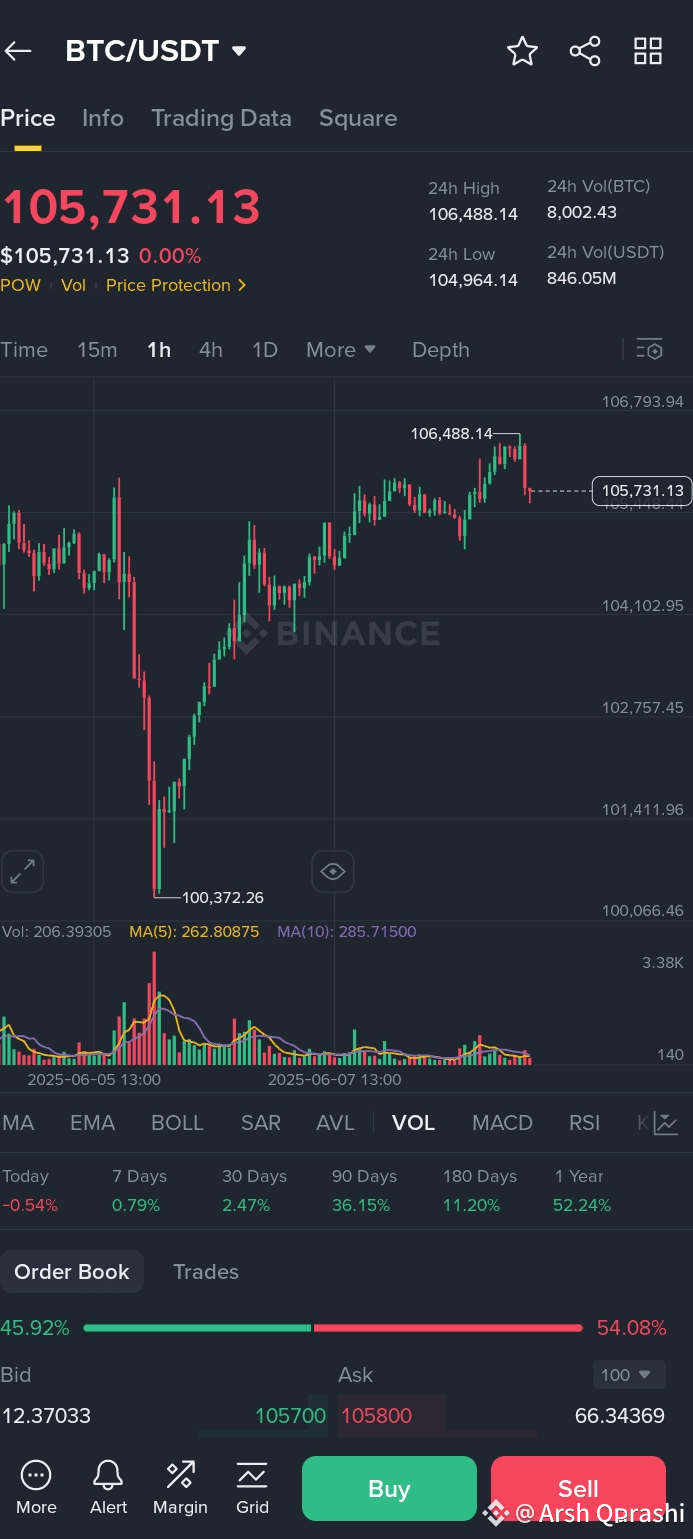
Currently, 15-minute and 1-hour candles are flashing strong selling volume:
The recent 15-min candles have printed red with above-average volume, signaling that short-term traders are locking in profits.
On the 1-hour chart, we’re seeing a consistent pattern of lower highs and heavy sell pressure, hinting that big players (whales & institutions) might be distributing BTC at these elevated levels.
⚠️ 2️⃣ Market Psychology at $100K
$100K is a major psychological resistance:
Many traders have been waiting for this level to offload their holdings.
As BTC touched or hovered around $100K, sellers aggressively stepped in, leading to liquidity sweeps and potential bull traps.
📉 3️⃣ Bearish Signs & Why It Can Go to $98K
Here’s why a bearish move to $98K is on the table:
Bearish divergence is forming between price and RSI/MACD on lower timeframes (1hr especially). Price is trying to push higher, but momentum is fading.
Order books on major exchanges show stacked sell walls around $100K-$101K, while buy walls below $99K are relatively thin.
If this selling volume continues, BTC could easily sweep liquidity down to $98K or even lower to hunt stop-losses and reset before any further rally.
🚨 4️⃣ Traps & Volatility Ahead
With such high volume on short timeframes, this is likely not a healthy consolidation — it looks more like a distribution phase:
If price fails to hold above $99K on a 1hr close, expect increased volatility and quick moves down.
Big players might be preparing to flush weak hands before another leg up or a deeper correction.