Special Reminder: BTC whales continue to buy small amounts.
A large increase in short positions.
BTC funding rates have turned negative, BTC has dropped, but large on-chain whales continue to buy small amounts.
Is history repeating itself? Will the double top from 2021-2022 be the same as the current trend?
👇👇 Please see the following on-chain data analysis for answers 👇👇
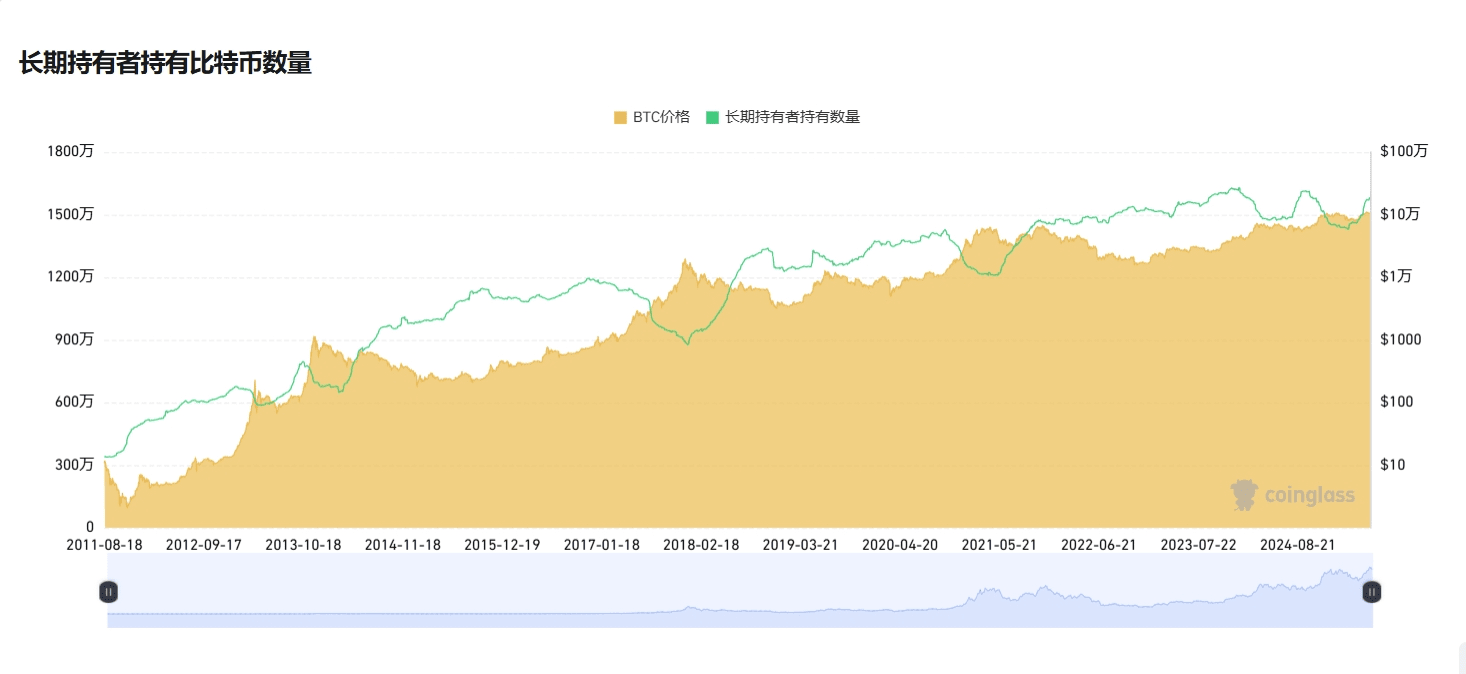
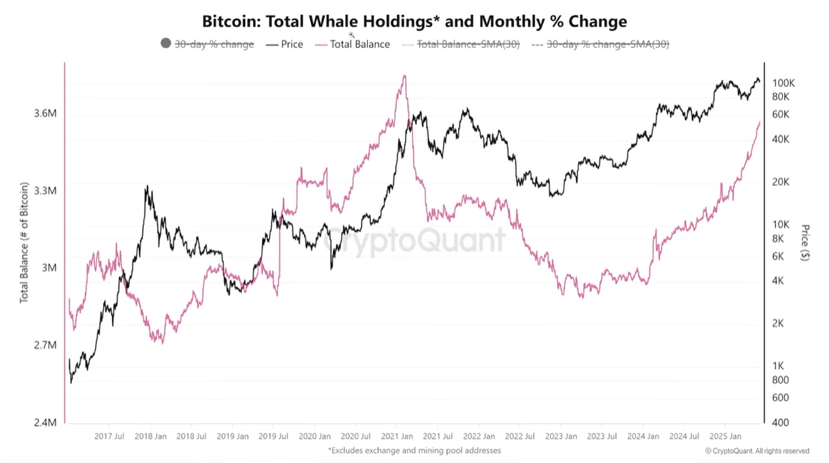
The number of holdings by large whales is continuously increasing each month.
Will the current BTC trend be the same as the double top from 2021-2022?
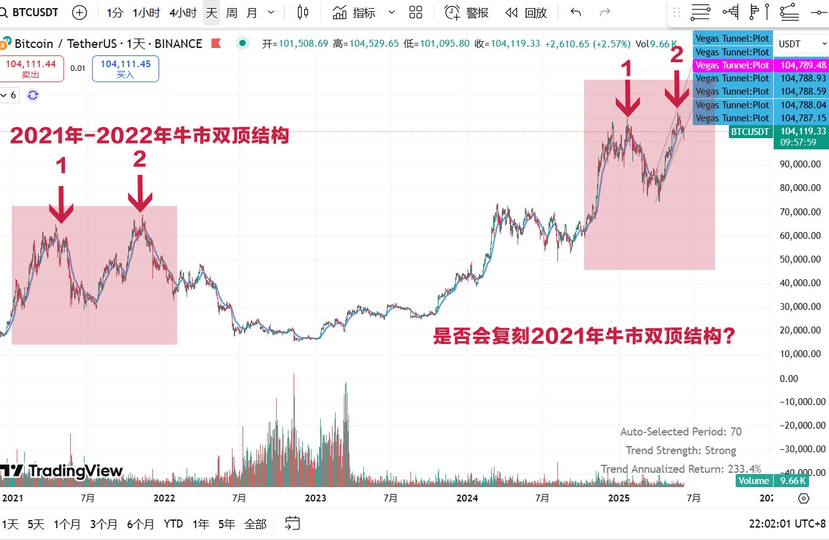
The funding rate has significantly decreased, and short positions continue to increase. Is history repeating itself? Will the double top from 2021-2022 be the same as the current trend?
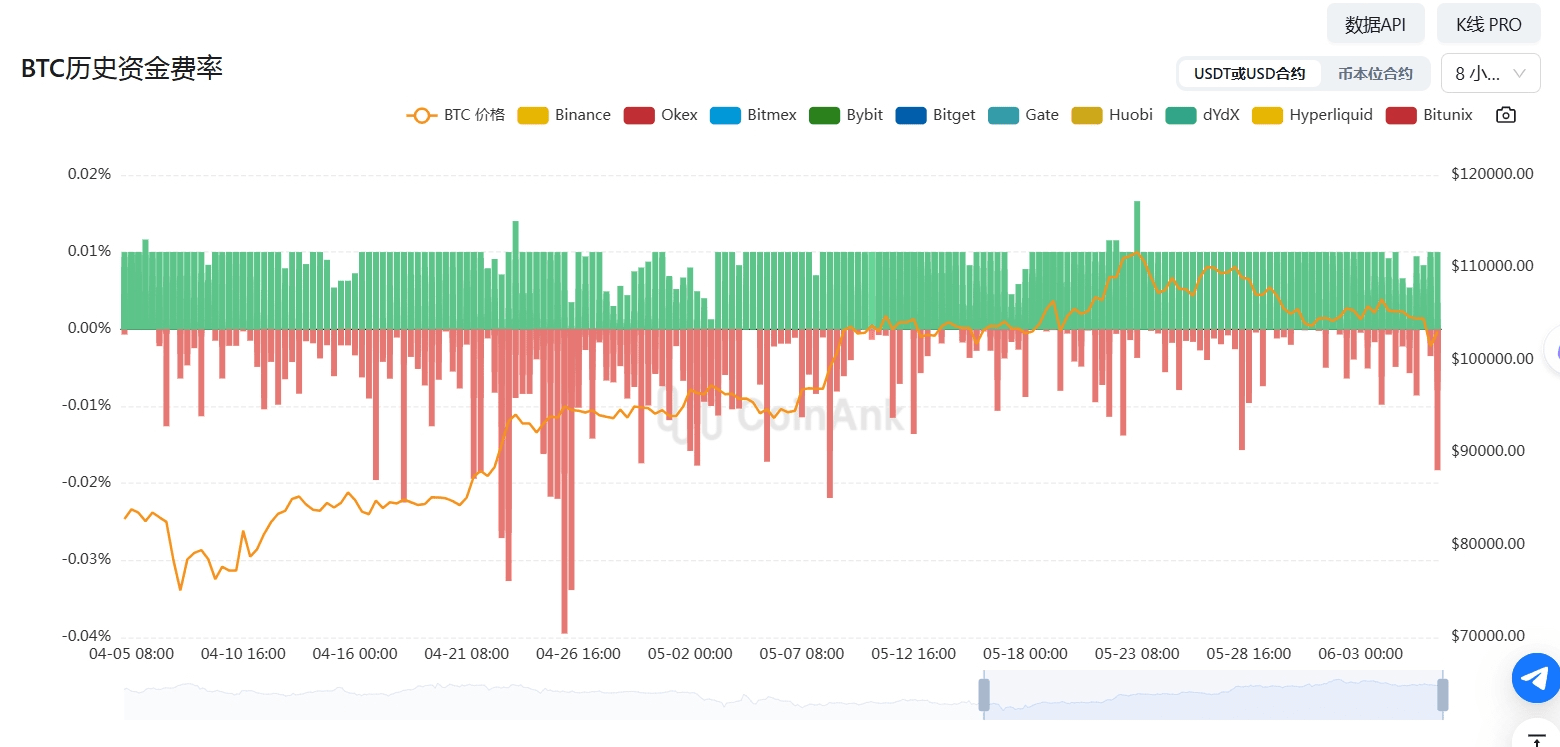
A large number of shorts are starting to go crazy with short selling, the funding rate has turned positive again, position levels are rising, and the negative funding rate is increasing. Will these shorts become fuel for BTC's rise?
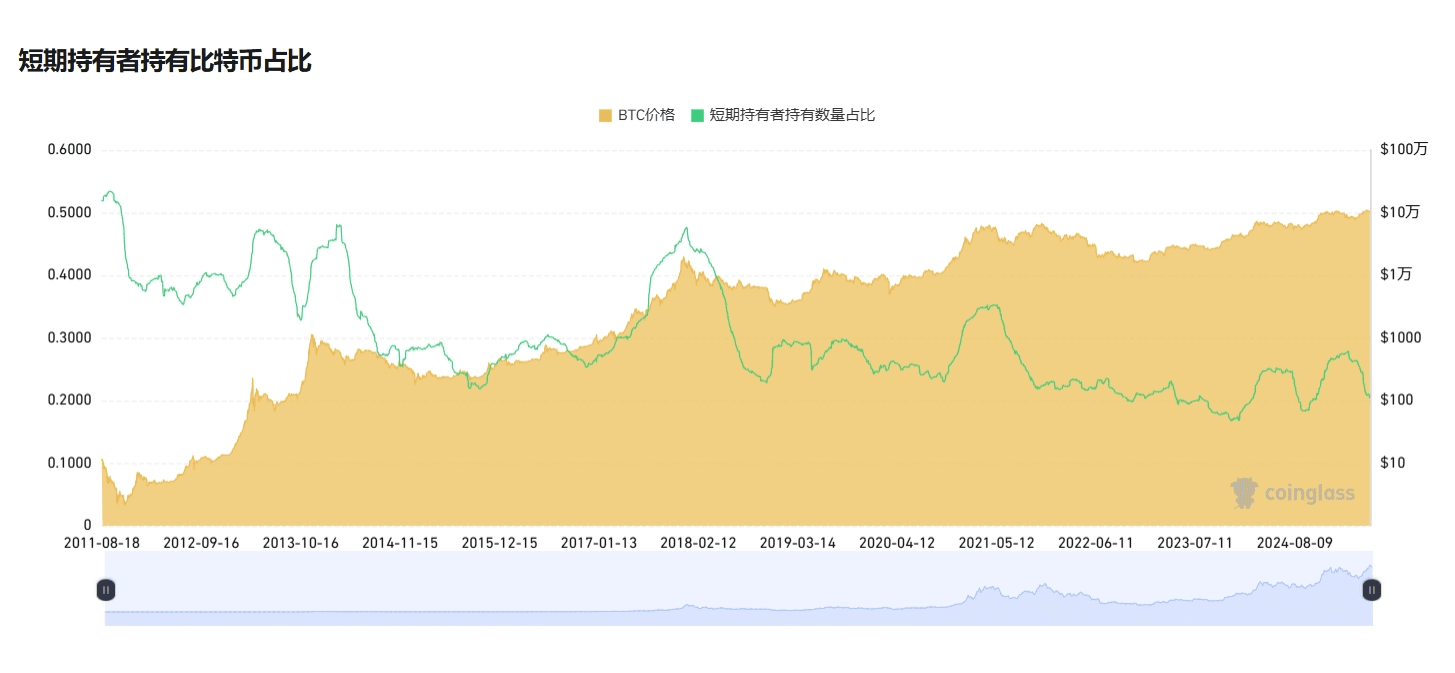
A large amount of selling by short-term BTC holders.
Recent maximum buying by long-term BTC holders.
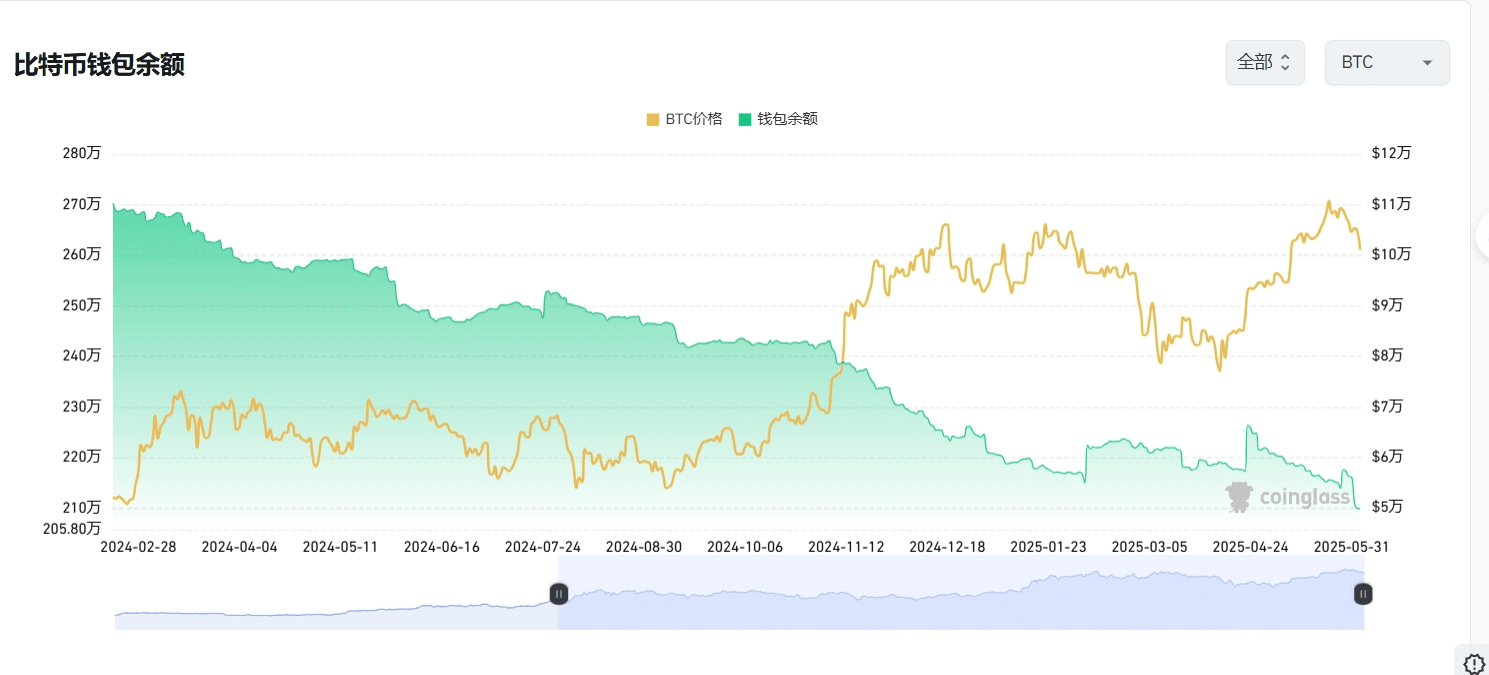
Inflow and outflow of BTC and ETH on exchanges BTC and ETH have seen a continuous outflow from exchanges reaching new lows, but the outflow rate has slowed down.
** Interpretation of BTC and ETH inflow and outflow data.
BTC inflow and outflow on exchange wallets are core on-chain indicators of the crypto market, directly reflecting the movement of major funds and market sentiment.
Inflow ↑ Holders deposit BTC into exchanges, increasing selling pressure expectations, be cautious of a short-term decline.
Outflow ↓ Holders withdraw BTC from exchanges, indicating an increased willingness to accumulate/lock up, suggesting a bullish outlook in the medium term.
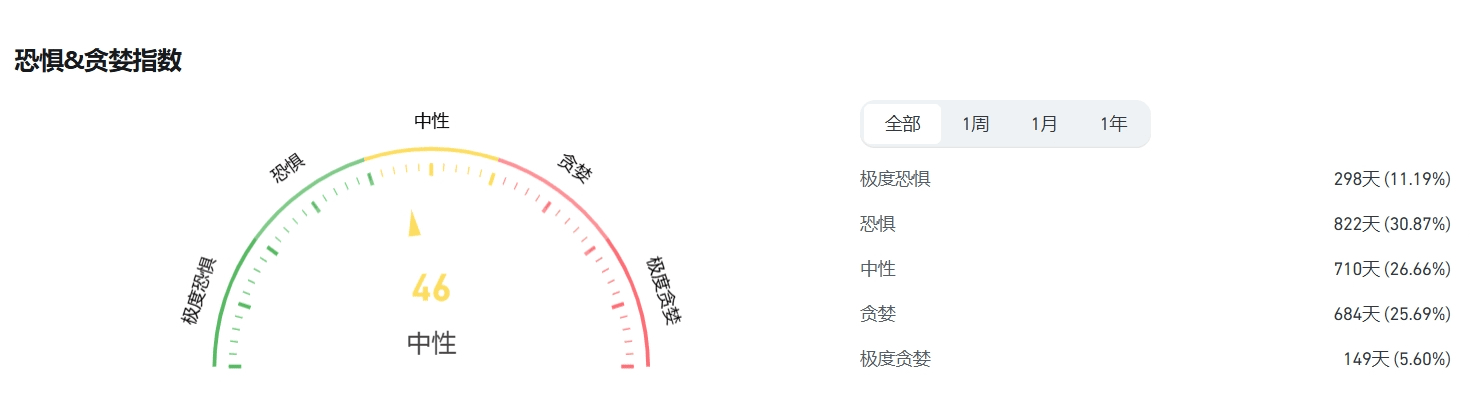
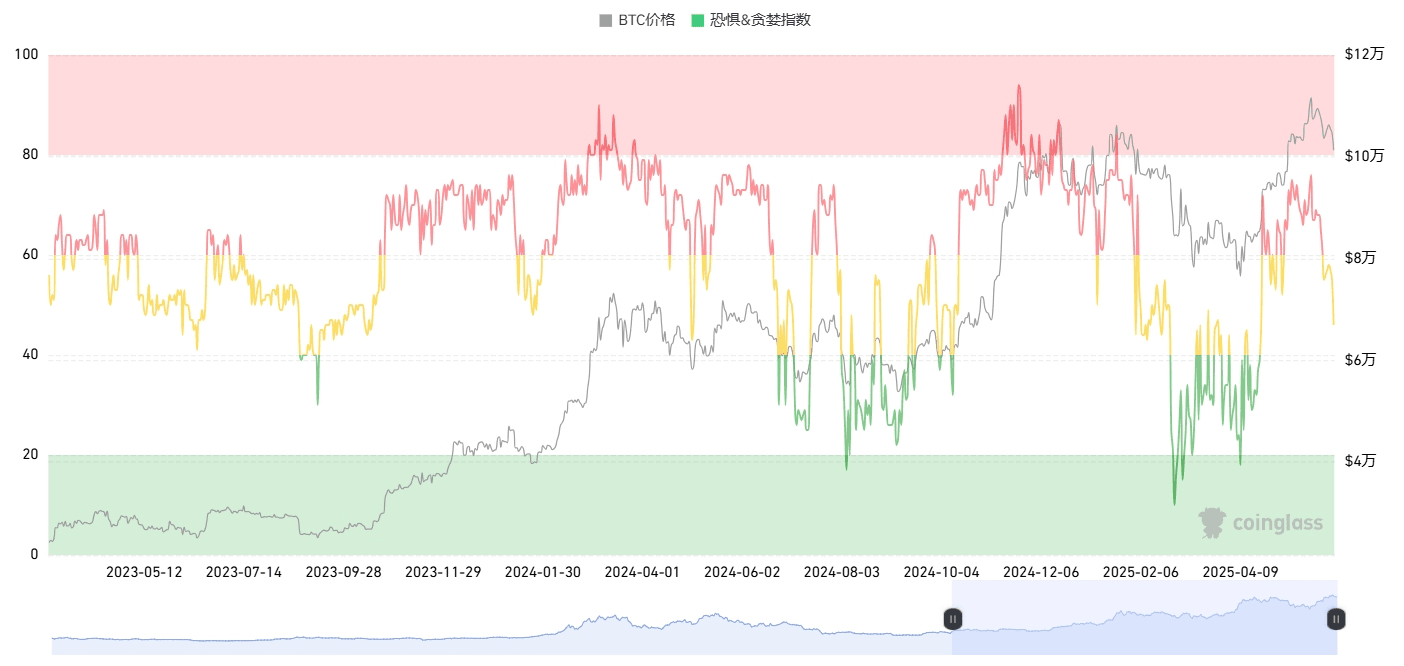
1. Fear and Greed Index Today is: 46 Neutral, showing a slight decline compared to yesterday.
** Interpretation of the Fear and Greed Index.
The behavior of the cryptocurrency market is highly emotional. When the market rises, people tend to be greedy, leading to a fear of missing out; when the market falls, they irrationally sell their cryptocurrencies.
Utilizing the Fear and Greed Index to help friends avoid emotional biases and make rational judgments.
There are two states:
Extreme fear indicates that investors are overly worried, which may be a buying opportunity.
Excessive greed indicates that investors are too excited, and the market may undergo a correction.
2. Bitcoin Total Market Share 63.25 Slightly increased compared to yesterday.
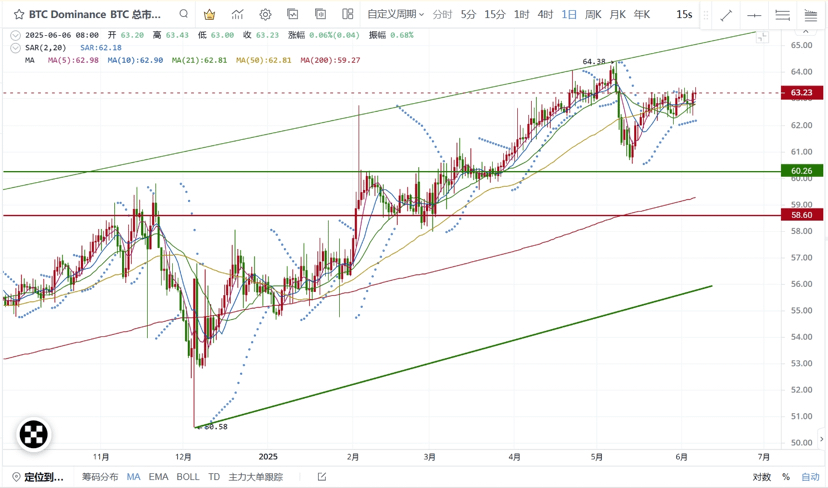
** Bitcoin's total market share is a core indicator of Bitcoin's relative influence in the entire cryptocurrency market. This indicator not only reflects Bitcoin's short-term market position but also reveals changes in fund rotation, investor sentiment, and macro trends.
Bitcoin market share is a 'weather vane' for judging market stages:
Early bull market: market share rises, funds prioritize allocation to Bitcoin.
Late-stage bull market: Market share declines, funds rotate into altcoins, triggering 'altcoin season'.
Market thermometer: >60% = Risk-averse dominant; <40% = Altcoin frenzy period.
Fund flow chart: Reveals institutional and retail allocation preferences (Bitcoin → stable, altcoins → high risk and high return).
3. Bitcoin and Ethereum trading pair 0.023942 Ethereum to Bitcoin trading pair has declined.
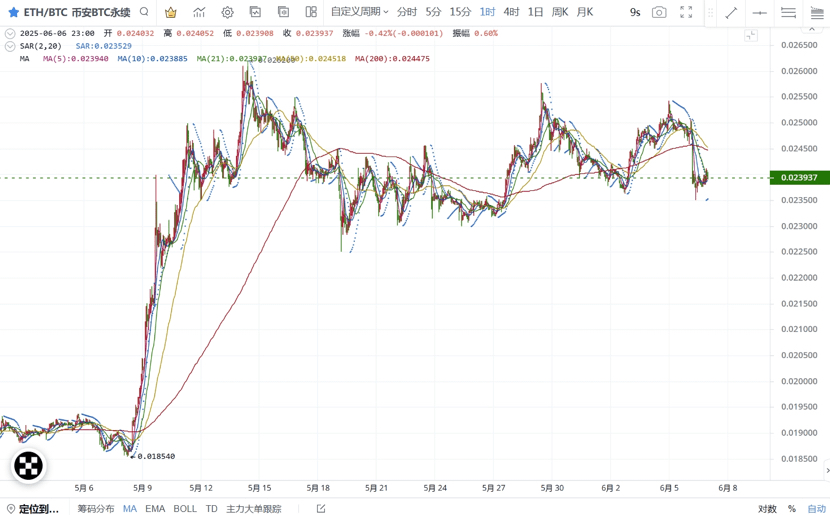
** The Bitcoin/Ethereum trading pair is the 'risk thermometer' of the cryptocurrency market:
Ratio increases → Market prefers high-risk assets (signal for the start of altcoin season);
Ratio decreases → Funds seek safety in Bitcoin (characteristics of a bear market or early bull).
4. ETF inflow and outflow data ETF inflow rate has slowed down, maintaining small inflows.
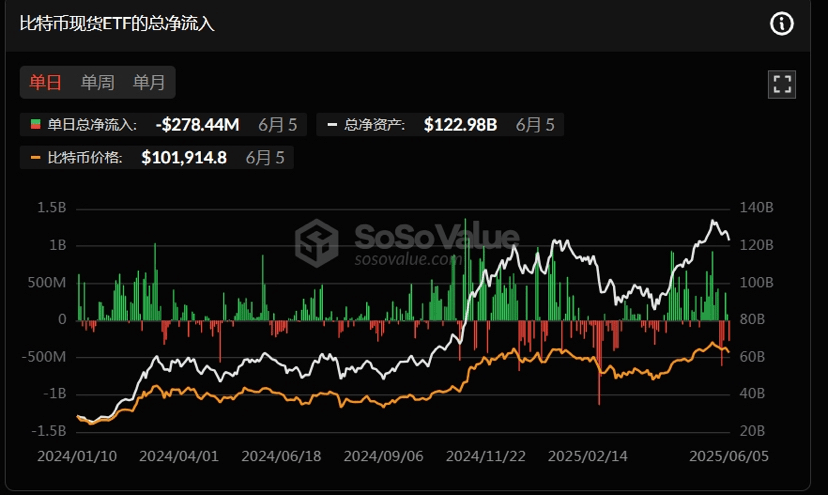
** Explanation of ETF inflow and outflow data: The inflow and outflow data of Bitcoin ETFs is a core indicator for tracking institutional sentiment, market trends, and fund rotation.
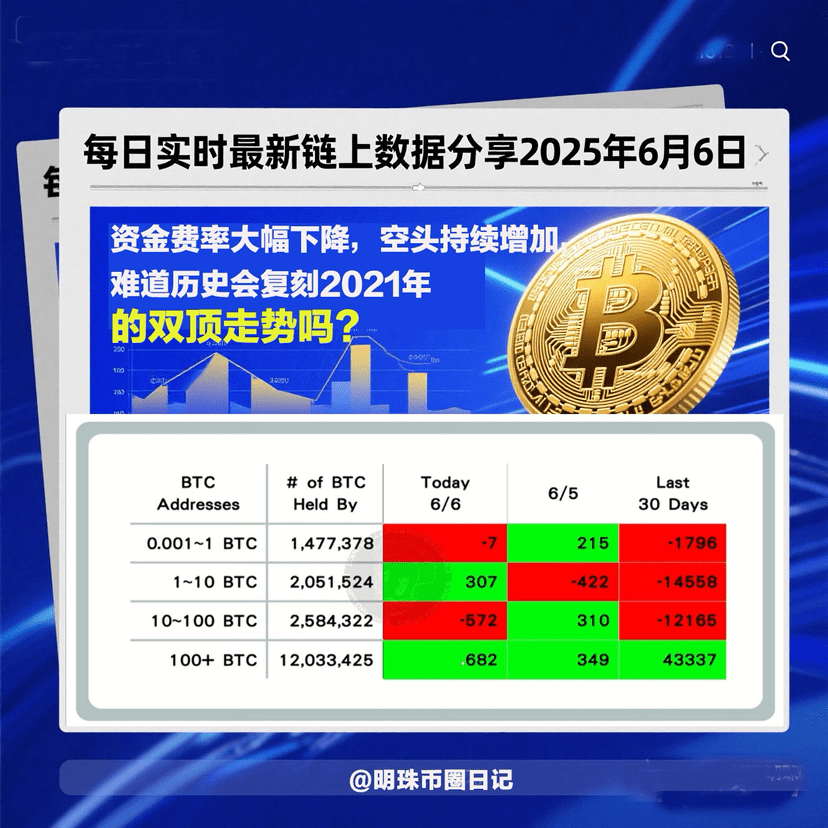
5. Statistics on on-chain BTC buying and selling data for retail investors, large holders, and institutions: Large whales have been continuously buying small amounts for several days.
Thank you @TraderPunk for providing data organization and sharing.
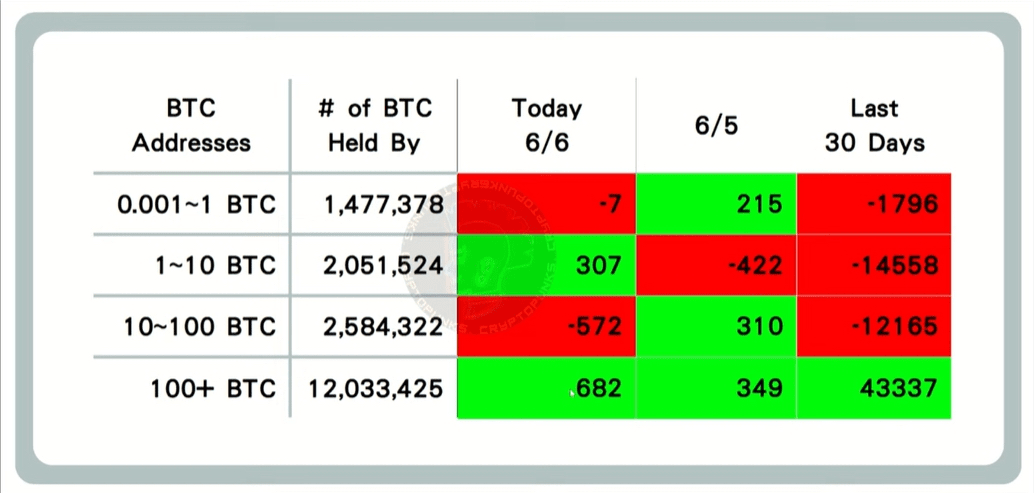
Data description: Represents the increase or decrease of on-chain flows for ≤ 1 BTC, 1—10 BTC, 10—100 BTC, and 100+ BTC, reflecting a type of market sentiment among retail investors, large holders, and institutions.
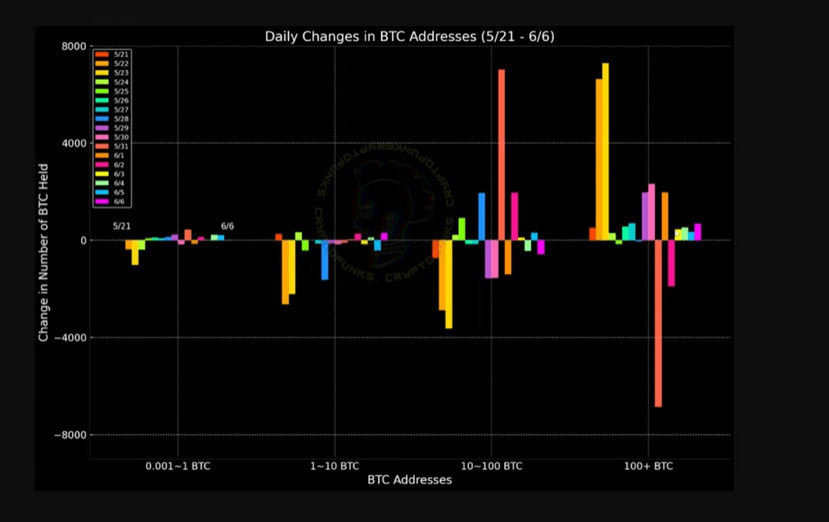
Data Description: This data reflects the increase or decrease of on-chain flows for ≤ 1 BTC, 1—10 BTC, 10—100 BTC, and 100+ BTC over a week. This data can intuitively reflect the flow trends of BTC among retail investors, large holders, and institutions in the market.
When on-chain data shows an extreme situation, a reversal often occurs (for example, if large whales holding over 100 BTC appear to buy massively while others are selling, the probability of Bitcoin rising significantly increases, and vice versa), while also needing to analyze in conjunction with other on-chain data and technical indicators.
The image below is a flow chart of large whale inflows & outflows. Over the past year, large whales have been continuously buying, with recent signs of acceleration.
6. MVRV Realized Market Capitalization Ratio MVRV > 1
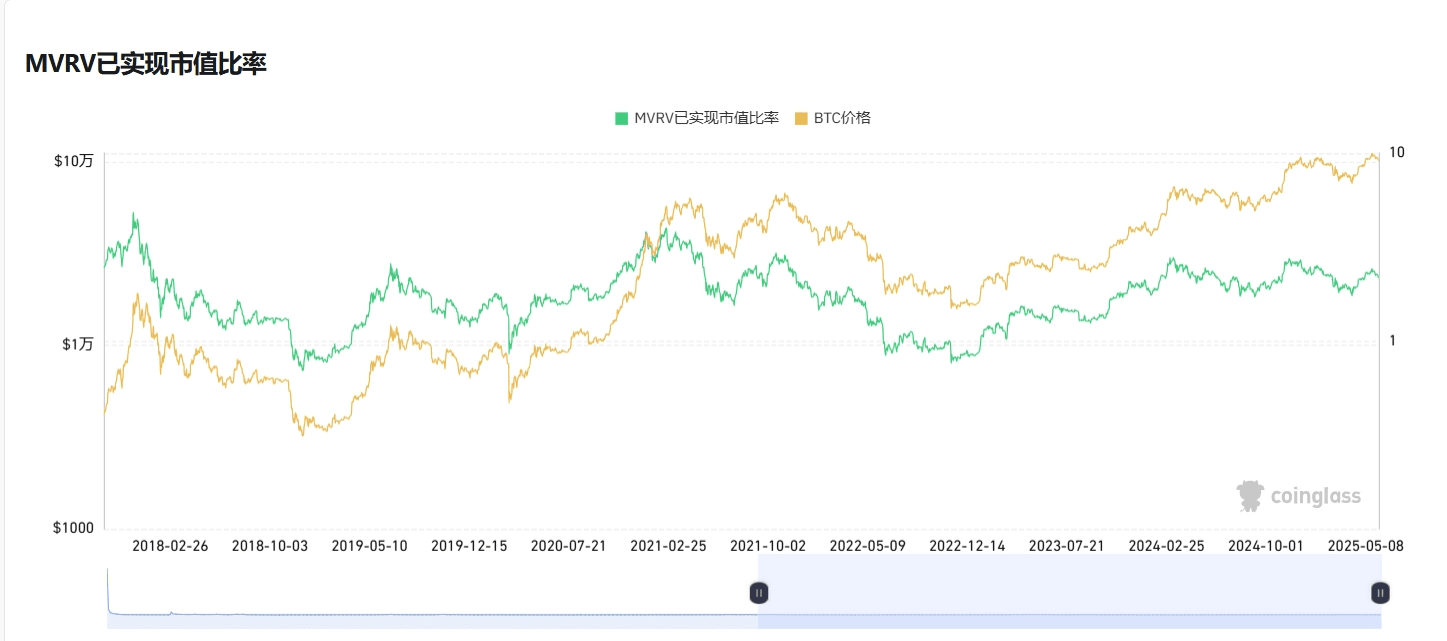
** Explanation of MVRV Realized Market Capitalization Ratio: The MVRV Realized Market Capitalization Ratio is used to evaluate the cryptocurrency market (especially Bitcoin). This metric can help friends judge whether an asset is overvalued or undervalued and identify potential market tops and bottoms.
MVRV > 1
When the ratio is greater than 1, it indicates that the market price is above the realized price, meaning that most holders are in a profit state. This may suggest that the market is overheated, especially when the MVRV reaches historical highs, indicating a possible market top.
MVRV < 1
When the ratio is less than 1, it indicates that the market price is below the realized price, meaning that most holders are in a loss state. This may suggest that the market is undervalued, especially when the MVRV reaches historical lows, indicating a possible market bottom.
7. Altcoin Season Index 20 Is it altcoin season: No It has rebounded slightly compared to yesterday.
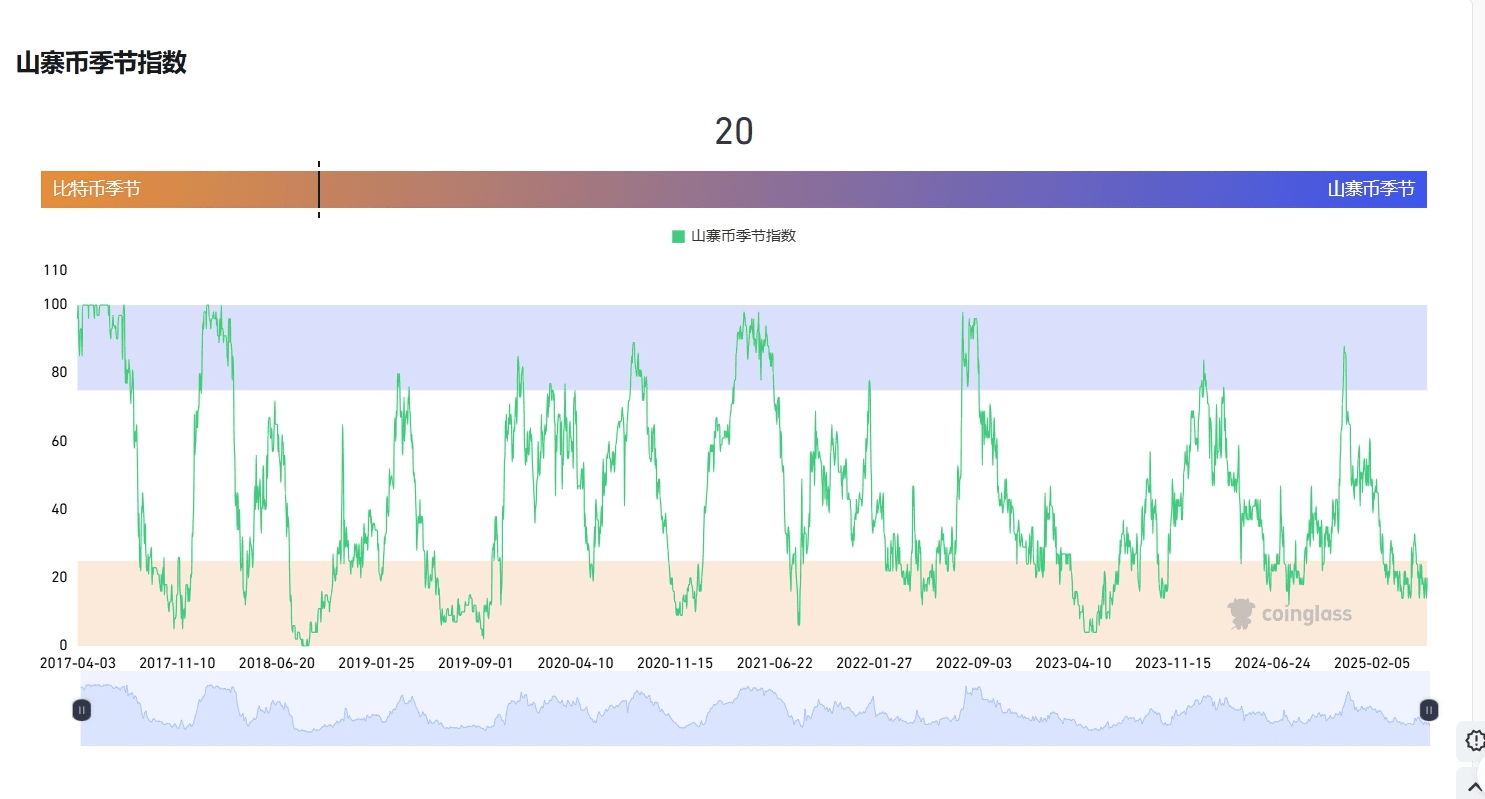
** Explanation of Altcoin Season Index: The Altcoin Season Index is a metric used to measure the performance of non-Bitcoin cryptocurrencies in the market. It is typically used to determine whether altcoins outperform Bitcoin during a specific time period, helping investors understand market trends and investment opportunities.
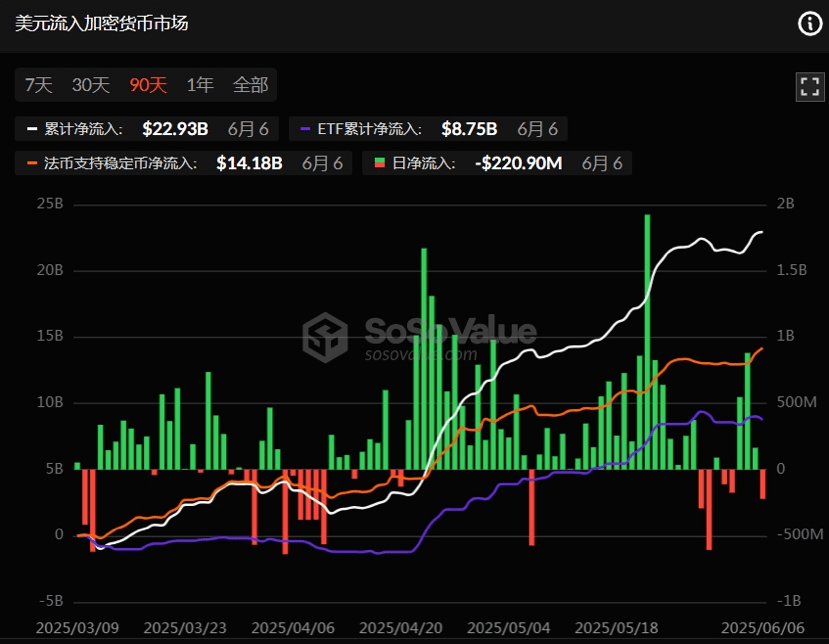
8. Net inflow of US dollars into the cryptocurrency market shows a net outflow.
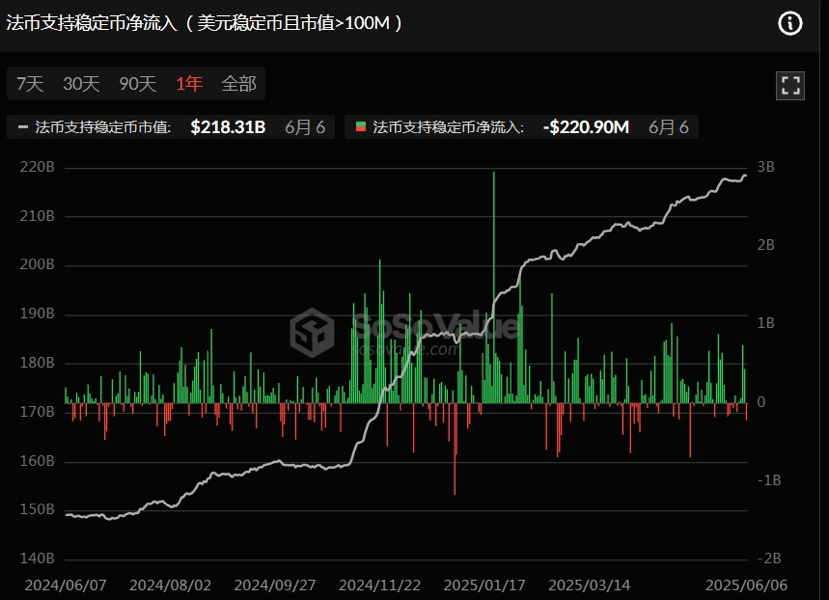
9. Net inflow of fiat-supported stablecoins (USD stablecoins with market cap >100M) shows slight net outflow.
The above data represents an attempt to predict the volatility trends of BTC and market sentiment from the perspective of on-chain data, and does not represent any investment advice. Please make careful decisions!
I am Mingzhu, follow me for daily sharing of real-time on-chain data and dynamics to help friends make predictive decisions. Exciting insights await, feel free to leave comments for discussion.