Special reminder:
Bitcoin on-chain data today 2025/6/7👇
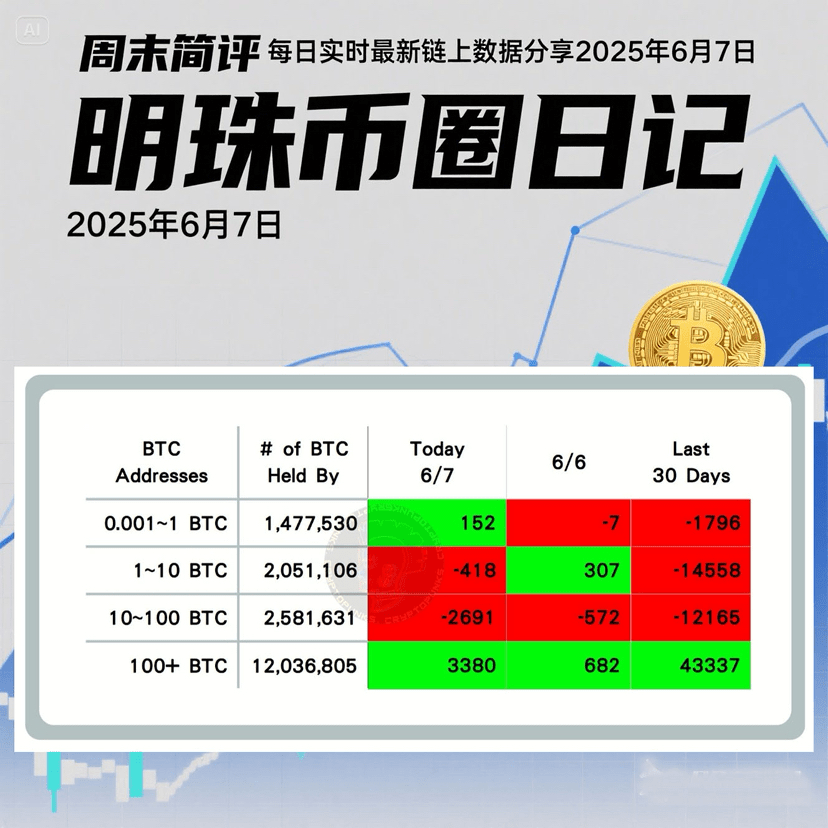
$BTC100+ Large whales are buying in large amounts (the largest amount in the past two weeks)
ETF Fund Flow (as of 06/07/2025)
BlackRock Bitcoin ETF $IBIT net outflow: -1,298 Bitcoin (-131.45 million dollars)
Transaction volume: 2 billion dollars
1. Greed and Fear Index Today: 52 Neutral, up from yesterday
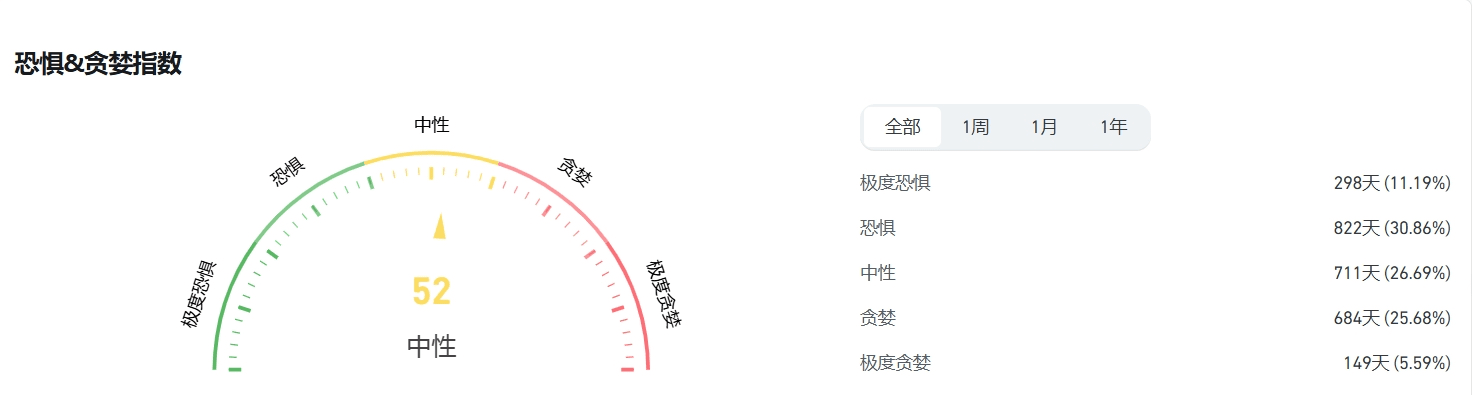
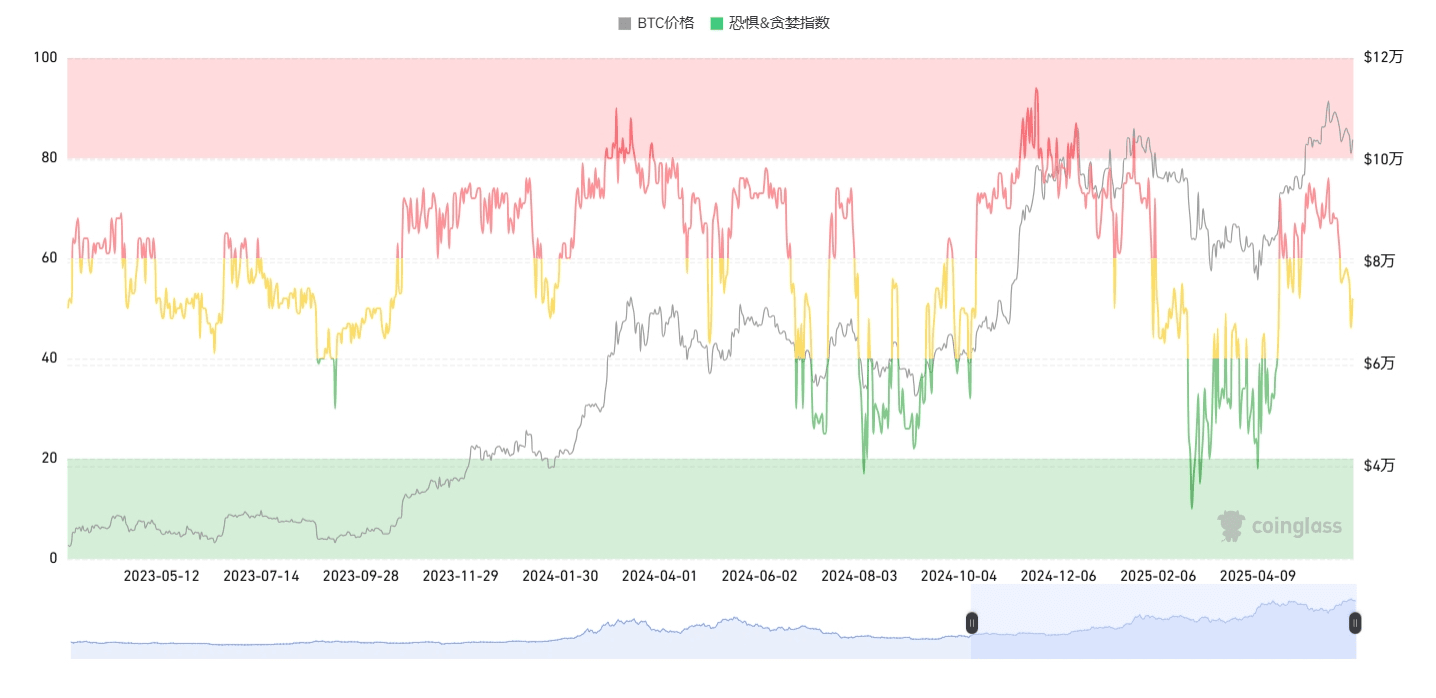
**Interpretation of Greed and Fear/Greed Index
The behavior of the cryptocurrency market is highly emotional. When the market rises, people tend to be greedy, creating a fear of missing out; when the market falls, they react irrationally and sell their cryptocurrencies.
Using the Greed and Fear Index to help friends avoid making irrational judgments influenced by their own emotional factors.
There are two states:
Extreme fear indicates that investors are overly worried, which may be a buying opportunity.
Excessive greed indicates that investors are overly excited, and the market may adjust.
2. Bitcoin total market share 63.23 unchanged from yesterday
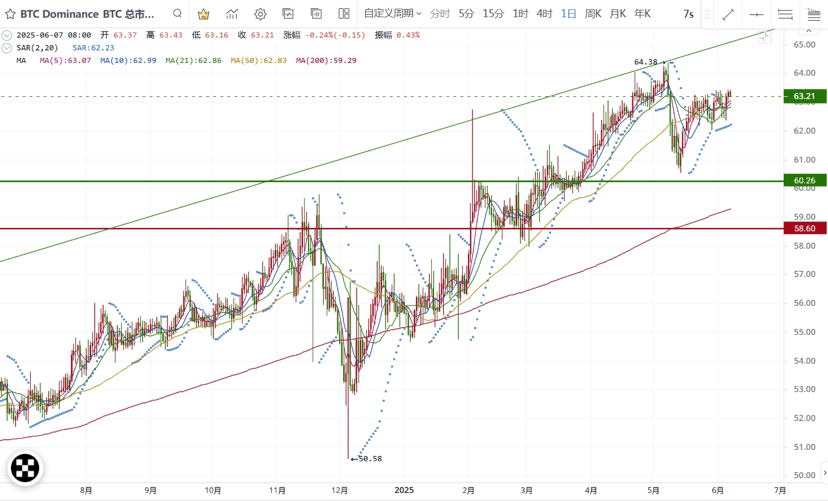
**Bitcoin's total market share is the core indicator for measuring Bitcoin's relative influence in the entire cryptocurrency market. This indicator not only reflects Bitcoin's short-term market position but also reveals changes in capital rotation, investor sentiment, and macro trends.
Bitcoin's market share is the 'weather vane' for judging market phases:
Early bull market: Market share rises, funds prioritize Bitcoin allocation.
Late bull market: Market share decreases, capital rotates to altcoins, triggering 'altcoin season'
Market thermometer: >60% = Risk aversion dominant; <40% = Altcoin frenzy period.
Fund flow chart: Reveals preferences for institutional versus retail allocations (Bitcoin → Stable, Altcoins → High risk, high return)
3. Bitcoin and Ethereum trading pair 0.023864 Ethereum against Bitcoin trading pair has retreated
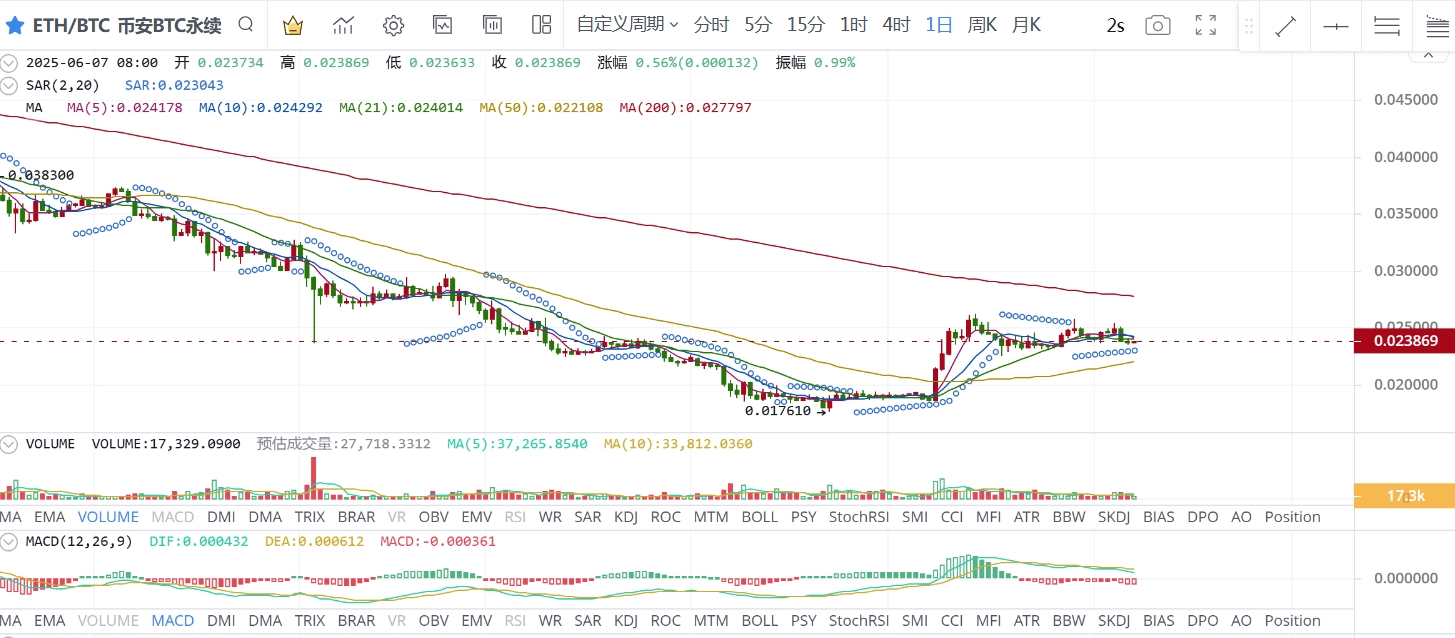
**The Bitcoin/Ethereum trading pair is the 'risk thermometer' of the cryptocurrency market:
Ratio rising → Market prefers high-risk assets (Signal for the start of altcoin season);
Ratio falling → Funds being hedged to Bitcoin (Bear market or early bull characteristics).
4. ETF inflow and outflow data ETF data inflow rate slows, maintaining small inflows
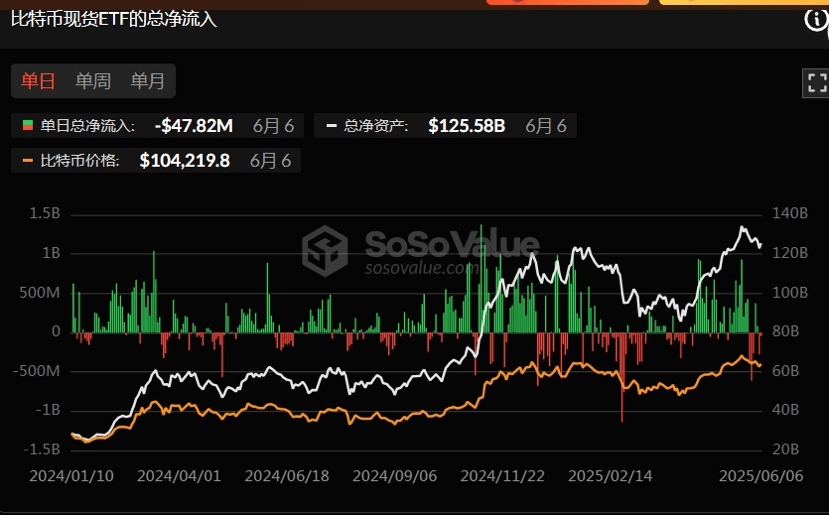
**ETF inflow and outflow data explanation: The inflow and outflow data of Bitcoin ETFs are core indicators for tracking institutional sentiment, market trends, and capital rotation.
5. On-chain BTC retail, large holders, and institutional buying and selling data statistics Large whale inflow in the past two weeks is the largest amount
Thanks to @TradingPunk for providing data organization and sharing
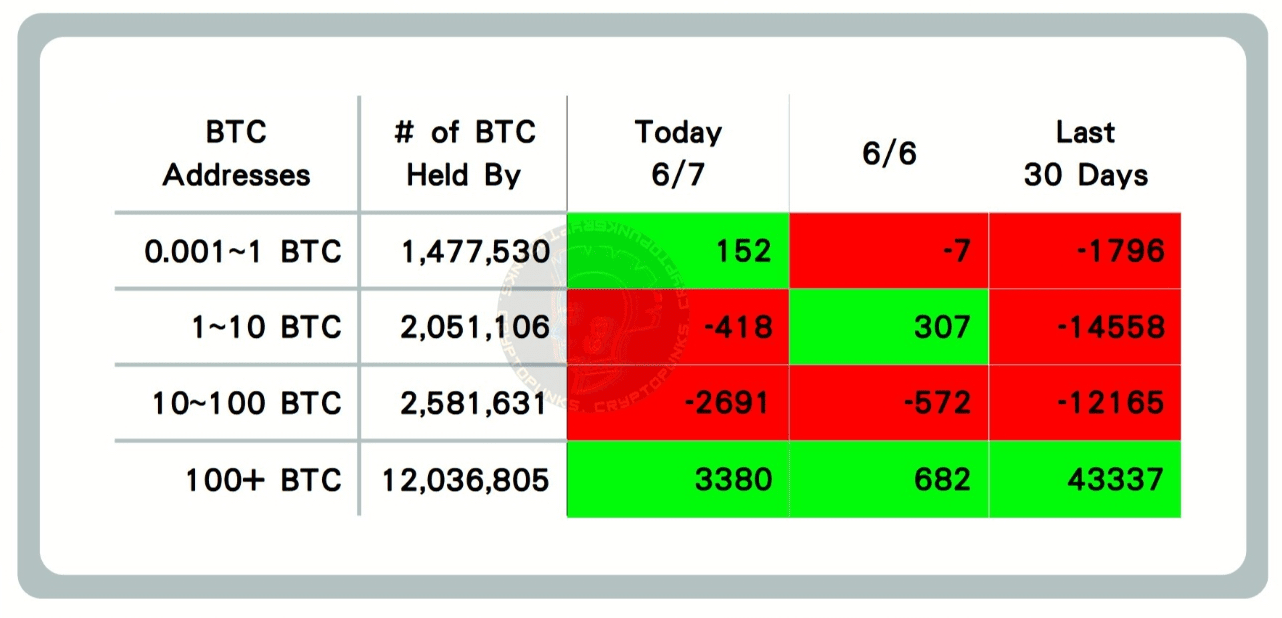
Data说明: Represents the increase or decrease of ≤ 1 BTC, 1—10 BTC, 10—100 BTC, 100+ BTC circulating on-chain. This data can reflect the market sentiment of retail, large holders, and institutions.
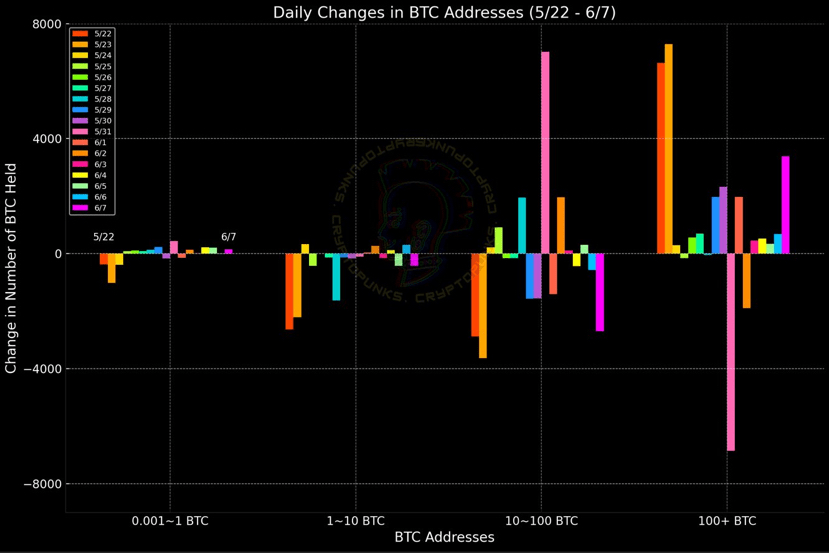
Data说明: This data reflects the increase or decrease of ≤ 1 BTC, 1—10 BTC, 10—100 BTC, 100+ BTC circulating on-chain within a week. This data can intuitively reflect the flow trends of BTC among retail, large holders, and institutions in the market.
When extreme conditions appear in on-chain data, reversals often occur (for example, if large whales with more than 100 BTC appear to buy in large amounts, while others are selling, the probability of Bitcoin rising greatly increases, and vice versa for falling). This should be combined with other on-chain data and technical indicators for analysis.
6. Dollar inflow into the cryptocurrency market saw a net outflow
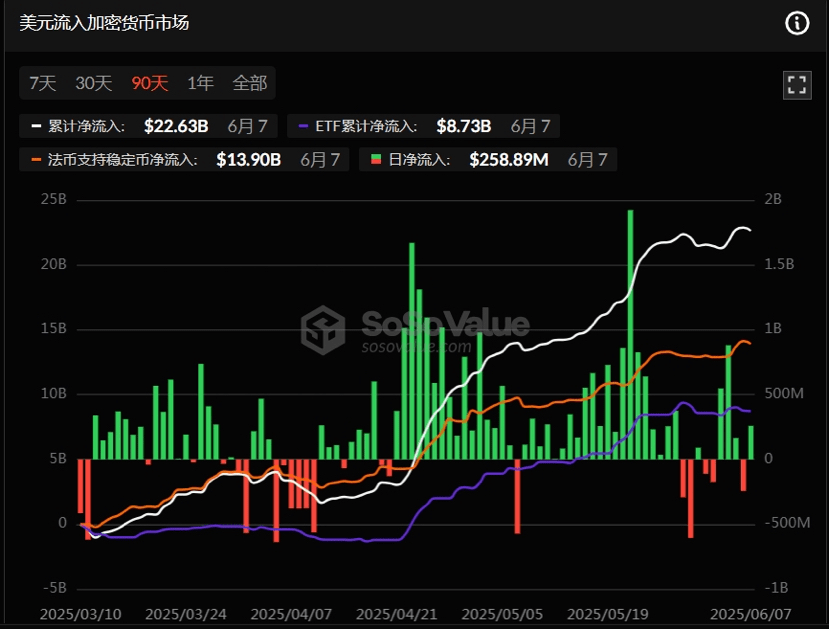
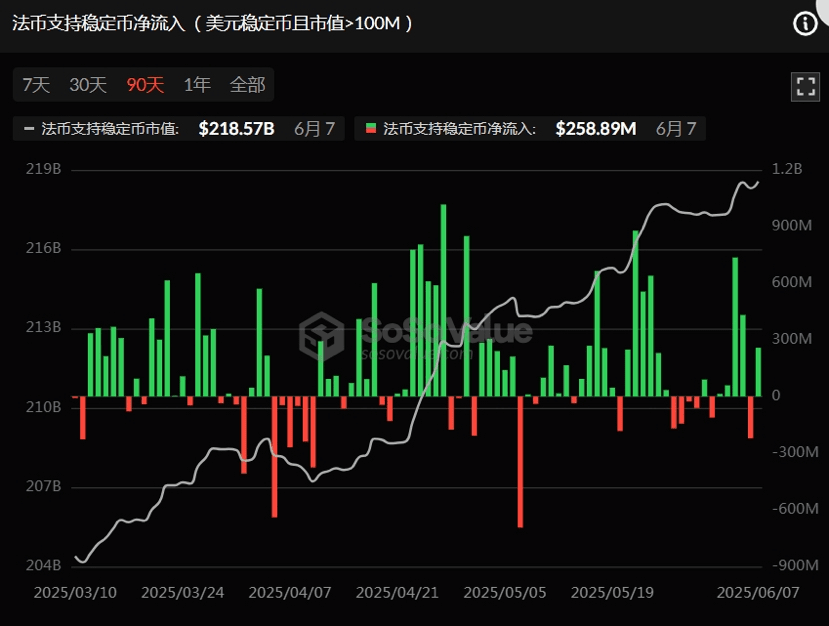
7. Fiat currency supports stablecoin net inflow (USD stablecoins with market value >100M) saw a small net inflow
The above data only represents the perspective of on-chain data to predict BTC volatility trends and market sentiment, and does not constitute any investment advice. Please make careful decisions!!
Weekend Brief Review:
I. Macroeconomic Background & Trend Overview
Risk appetite marginally warming: Trump and Musk 'reconcile', overnight U.S. Treasury yields slightly rose ahead of strong NFP expectations, a stronger dollar suppresses crypto sentiment but did not trigger a new round of selling.
II. Technical Analysis
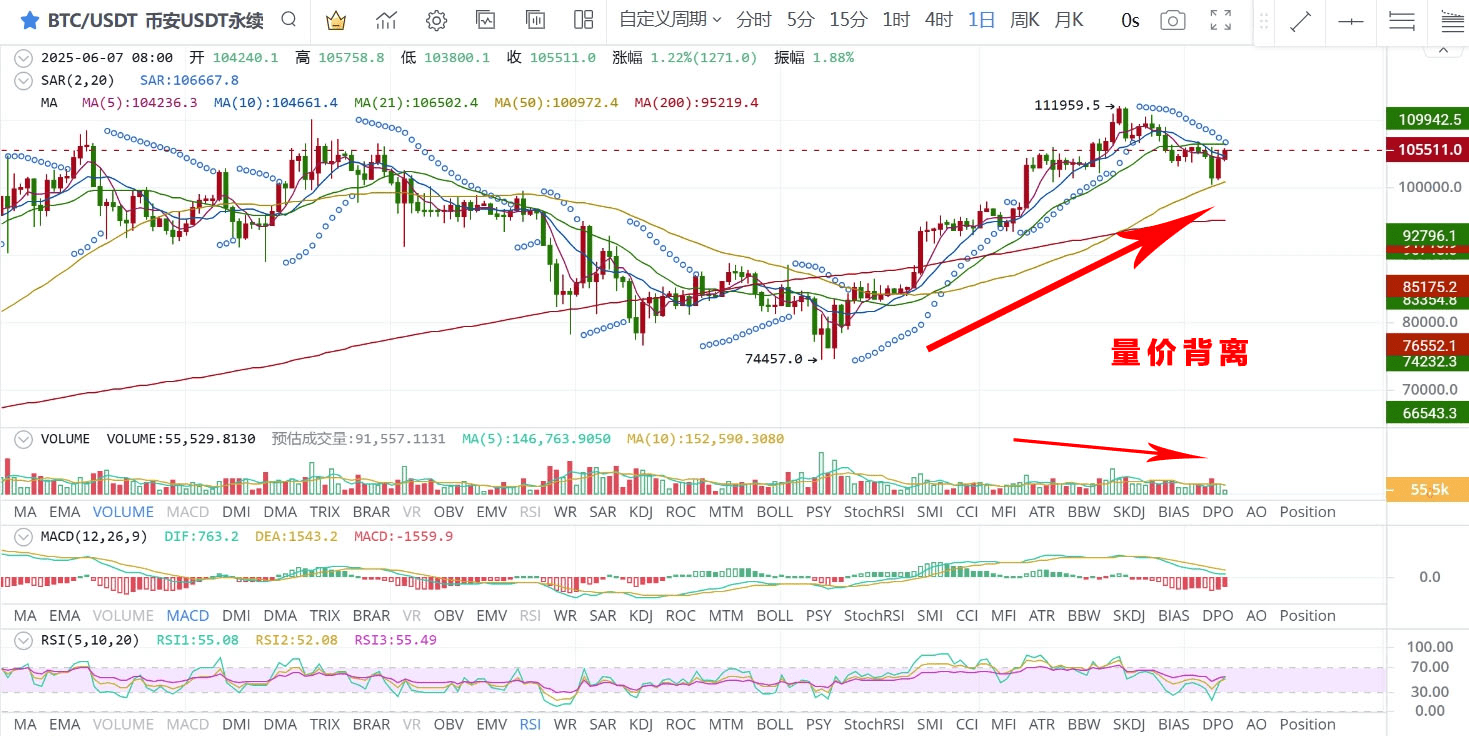
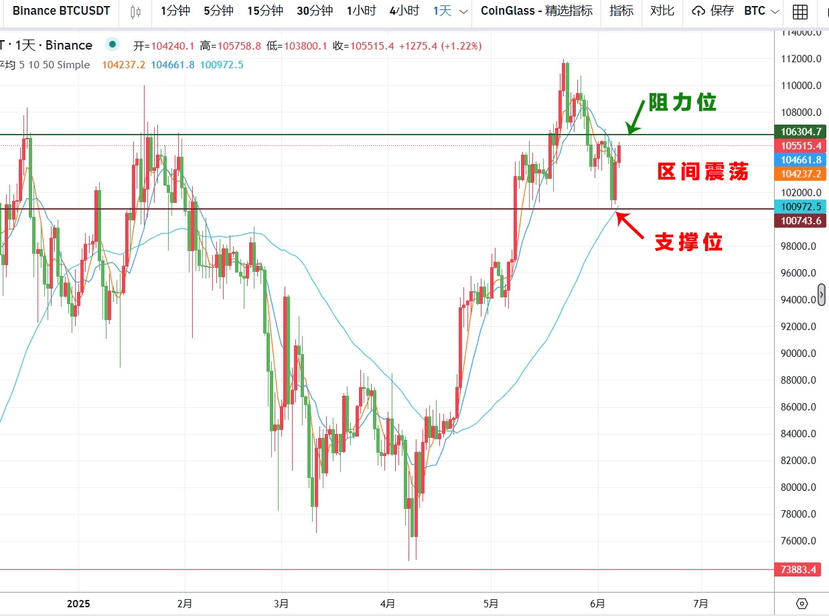
1H structure: Back to the range POC (near 104k), but the first round of FVG above 106k remains densely stacked; before recovering, the pullback is considered technical repair.
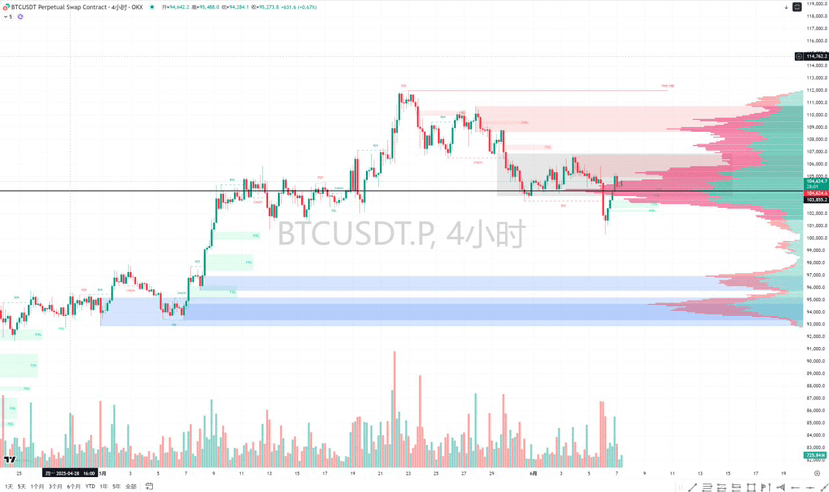
4H level: Breakout pullback to the original box bottom, MACD still consolidating below the zero axis — typical weak rebound pattern.
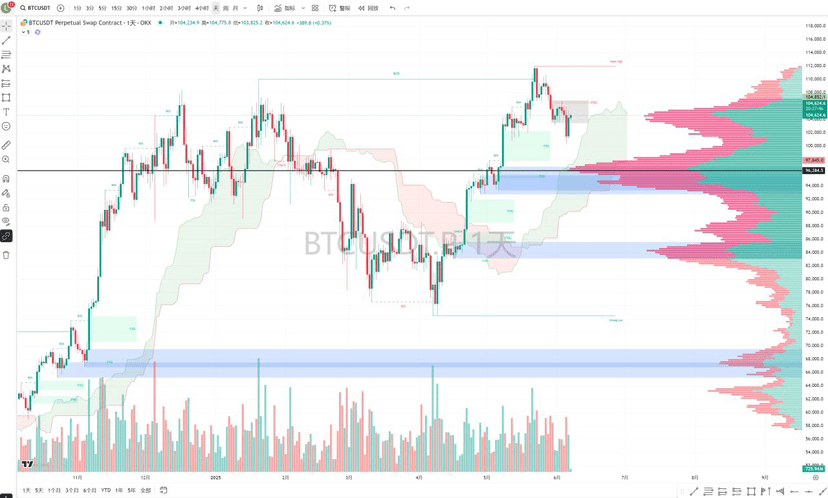 Daily line: Bullish defense level 96.3k (previous high platform + VP peak); if it falls below again, the daily line turns to bearish consolidation.
Liquidation map: Below 101k / 99k two unfilled FVG + bullish stop-loss concentration, still a potential 'pullback grab needle' target.
From a larger cycle perspective, the previous high point of 113,000 remains a medium-term strong resistance (Weak High)
III. Core Conclusions
Giant whale distribution ≠ Take off immediately
Liquidity vacuum combined with continuous ETF redemptions makes the V-shaped pullback look more like a 'technical breather.' The true daily direction still depends on whether the 106.5k pressure can be broken through with volume, or whether the 101k will be lost again — short-term tug-of-war, significant opportunities are left for patience.
Today is the weekend when Wall Street is resting, but I still see a range-bound trend for Bitcoin over the weekend, but I lean bullish on the direction!

I am Mingzhu, follow me, I share real-time on-chain data and trends daily to help friends predict decisions. Exciting content is not to be missed, welcome to leave comments for discussion.