Whether you're swing trading or scalping, recognizing these classic patterns can give you an edge. Most of these apply to candlestick charts, but bar charts work too!
1. Stair-Step Trends: Ascending & Descending
Markets don’t move in straight lines. Even strong trends have pullbacks.
Ascending Staircase ➤ Higher highs + higher lows = Uptrend
📈 Dips = Buy opportunities
Descending Staircase ➤ Lower highs + lower lows = Downtrend
📉 Mini rallies = Sell setups

2. Ascending Triangles
Flat resistance with rising lows
Signals bullish pressure building up
Breakout expected to the upside

3. Descending Triangle
Flat support with falling highs
Selling pressure dominates
Often leads to a breakdown

4. Symmetrical Triangle
Converging highs and lows
A breakout in either direction is possible
Volume contraction followed by expansion = key clue

5. Flag Pattern
Sharp move (flagpole) followed by a tight consolidation (flag)
Continuation pattern — often resolves in the direction of the pole

6. Wedge
Sloping consolidation
Falling wedge = bullish bias
Rising wedge = bearish bias
Volume usually drops during formation

7. Double Top
Two peaks at similar levels
Signals potential trend reversal from bullish to bearish
Confirmed on neckline break

8. Double Bottom
Two troughs at similar levels
Potential reversal from bearish to bullish
Watch for volume spike on breakout

9. Head & Shoulders
One higher peak (head) between two lower ones (shoulders)
A powerful reversal signal when neckline breaks
Can form at the top or bottom of trends

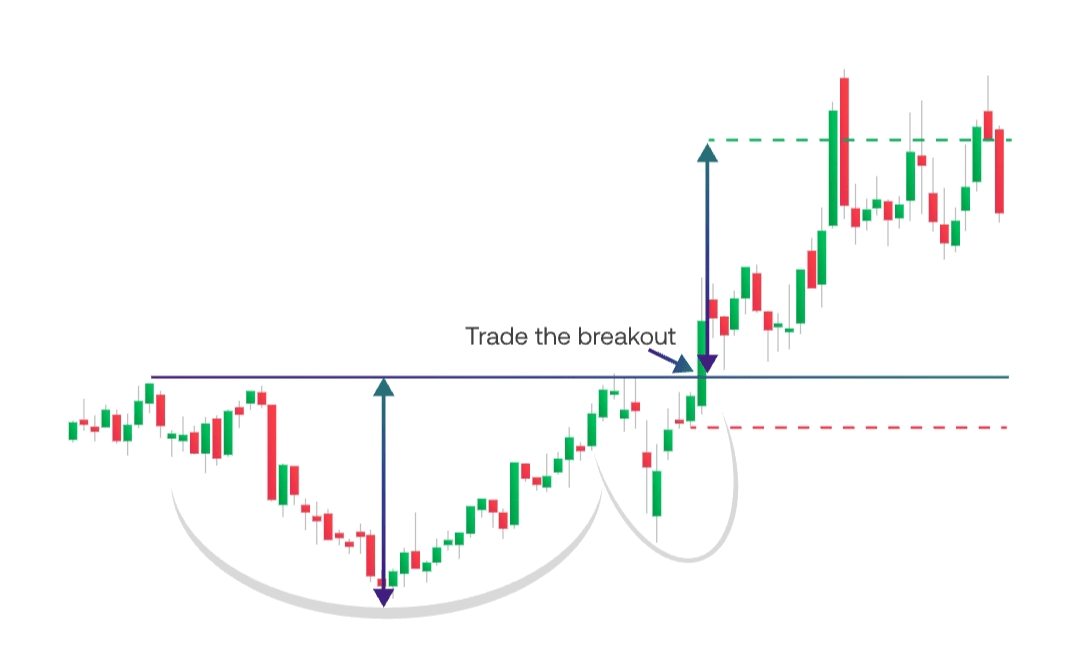
10. Rounded Top/Bottom
Slow, gradual shift in sentiment
Often marks long-term reversals
Think of it like a “U” or inverted “U”

11. Cup & Handle
Looks like a teacup with a pullback handle
Bullish continuation pattern
Breakout above handle = entry trigger
📈 How to Trade Chart Patterns (Smartly)
Recognizing patterns is great — but trading them with discipline is what separates winners from losers.
✅ 3-Step Pattern Trading Strategy
1. Confirm the Breakout
Don’t rush in. Wait for the pattern to play out:
Watch 1–2 candles after breakout
Look for volume spikes or momentum confirmation
Use indicators or past price levels for added conviction
2. Set a Stop-Loss
Protect your capital. Place your stop where the pattern would be considered invalid:
Bullish setup: below last key low
Bearish setup: above recent high
Example: In a bull flag, stop just under the support line
3. Set a Profit Target
Estimate how far the move might go:
Use pattern height as your target range
Example: If the pattern spans 50 points, aim 50 points above/below breakout
Ensure a solid risk-reward (1:2 or better)
📌 Reminder: Patterns are tools, not guarantees. Smart risk management is your real edge.
BUY AND TRADE HERE $BTC