In my journey through cryptocurrency trading, I persevered from being a small retail investor with 5000 yuan to finally becoming a middle-class individual with 25 million yuan!
Today, I will share my insights from my journey with everyone.
The most important thing in cryptocurrency trading is capital management; don't invest all your money at once. I habitually divide my funds into five parts, taking one part to operate each time, so even if I incur losses, I won't be too heavily burdened.
Moreover, I have set a rule for myself: if I lose 10%, I immediately withdraw, regardless of the market. If I lose 10% five times in a row, I've only lost 50%, but if I earn, the profits are much more. Even if I encounter a situation where I'm trapped, I can still maintain my composure.

Survival Guide in Cryptocurrency: Revealing Super Practical Trading Skills (Pure Dry Goods)
In the cryptocurrency circle, the trading strategy is your 'secret weapon'. The following tips are the crystallization of practical experience, so be sure to collect them!
- Entry: Test the waters in the cryptocurrency market, prepare to proceed; enter steadily, refuse to rush in.
- Sideways: Low position sideways making new lows; heavy positions are just right for bottom fishing; high position sideways and spiking; decisively sell without hesitation.
- Volatility: Sell on spikes, buy on plunges; observe during sideways and reduce trading. Sideways means using sideways to replace drops, hold onto your chips, and a rise might be just a second away; during rapid rises, be wary of sudden drops, ready to secure profits at any time; slow declines are a good time to gradually accumulate.
- Trading Timing: Don't sell if it doesn't spike; don't buy if it doesn't plunge; don't trade during sideways. Buy on down days, sell on up days, operate in reverse to stand out. Buy on big drops in the morning, sell on big rises; avoid chasing during a big rise in the afternoon, consider buying the next day on big drops; don't cut losses on a big drop in the morning, and rest during times of no movement; accumulate while trapped to seek break-even; excessive greed is not advisable.
- Risk Awareness: A calm lake can rise to high waves; there may be big waves ahead; after a big rise, there must be a pullback; K-lines show a triangular pattern over several days. During an upward trend, look for support; during a downward trend, look for resistance. Full-position trading is a big taboo; acting recklessly is inadvisable; facing uncertainty requires knowing when to stop and seizing the opportunity to enter and exit. Trading cryptocurrencies is essentially trading mindset; greed and fear are the greatest enemies; be cautious when chasing rises and killing falls, and maintain a calm mind for peace.
In addition to the tips, I have also compiled several highly practical trading methods that can benefit both novice traders and seasoned players.
Oscillation trading method: Most market conditions are in oscillation patterns, using high selling and low buying within a range is the basis for stable profits. With the help of BOLL indicators and box theory, accurately identify resistance and support by combining technical indicators and patterns. Follow short-term trading principles and avoid greed.
Trend change breakout trading method: After prolonged consolidation, the market will choose a direction; entering after a trend change can yield quick profits. However, one must possess accurate judgment skills for trend changes and maintain a steady mindset, avoiding greed and fear.
Unilateral trend trading method: After the market breaks through the consolidation, it will form a unilateral trend, and trading in the direction of the trend is key to profit. Enter trades during pullbacks or rebounds, referencing candlesticks, moving averages, BOLL, trend lines, etc.; only by mastering these can you maneuver skillfully.
Resistance and support trading method: When the market encounters key resistance or support levels, it often gets blocked or supported; entering the market at this time is a common strategy. Use trend lines, moving averages, Bollinger Bands, parabolic indicators, etc., to accurately judge resistance and support levels.
Pullback and rebound trading method: After significant rises or falls, a brief pullback or rebound will occur; seize the opportunity to profit easily. Mainly judge based on candlestick patterns, and good market sense can help you accurately grasp highs and lows.
Time-based trading method: The morning and afternoon sessions have low volatility, suitable for conservative investors; although the time to profit from trades is long, the market is easier to grasp; the evening and late-night sessions have high volatility, suitable for aggressive investors, allowing for quick profits but with higher difficulty, requiring strict technical and judgment skills.
The tips for the cryptocurrency market are as follows:
Tip 1: Don't sell if it doesn't spike up, don't buy if it doesn't plunge, and don't trade during sideways markets. Stick to buying on down days and selling on up days; go against the trend to stand out as a hero. If you encounter high and low consolidations, it might be wise to wait a bit. After a high position sideways consolidation, when it spikes again, be sure to seize the opportunity to sell quickly; if it consolidates at a low position and makes new lows, this is an excellent time to buy in fully. I hope these tips are helpful to everyone.
Tip 2: Consider buying on a big drop in the morning, and sell on a big rise. Avoid chasing during a big rise in the afternoon, and consider buying on a big drop the next day. Don't cut losses on a big drop in the morning, and rest during times of no movement.
The four shortcuts to financial ruin are:
1. Blindly chase rises and kill falls;
2. Get involved in futures leverage;
3. Engage in margin trading;
4. Frequently engage in short-term miracle operations.
The four main avenues to reach the peak of life are:
1. Work diligently;
2. Invest with spare money;
3. Buy at the bottom and hold for the long term;
Make money when prices rise, earn coins when prices fall.
As long as you hold on and don't sell, you won't incur losses.
Be sure to remember: Never go all in.
No more nonsense!
Share my trading strategies and insights with friends. There's an old saying, standing on the shoulders of giants means less struggle for ten years. If you have the fortune to see this,
Friends who want to improve their cryptocurrency trading skills must read more, study diligently, and I suggest saving this!
Viewing the market with a developmental perspective in cryptocurrency trading is a state of limitless potential.
How should this sentence be understood?
To put it simply, it means that whenever you have time, you can open your computer and check the market to see if you can make a trade to earn some money.
Many traders recognize the importance of stop-loss, but do not know how to set stop-loss points. Here are two stop-loss strategies: one is a simple, practical trailing stop-loss strategy widely adopted by experienced traders - the channel stop-loss; the other is a stop-loss strategy that tightly tracks the market highs - 'Hanging Lamp Stop-Loss'.
To this day, every investor, upon entering the market, must judge trends and expected returns, but the most important action is to set a stop-loss line. Many experienced traders adopt a 'trailing stop-loss' method, which sets instructions in the profit stage, following the latest prices to set a stop-loss at a certain point as the price moves favorably.
1
The most commonly used and simplest trailing stop-loss strategy is 'Channel Stop-Loss' - investors use the recent X candlestick's lowest or highest point as a reference for stop-loss points in both bullish and bearish directions. All these highs and lows form a band-shaped area resembling a channel, hence we call it a 'channel'. This method actually derives from a popular market entry strategy, where one enters the market when breaking through those mentioned highs and lows. Stop-loss is more of an exit strategy, and mostly only one boundary is used; the name is merely due to habit.

Assuming an investor chooses a 20-day channel as the stop-loss point for the trading system, they must continuously measure the lowest point of the recent 20 days and use this as the stop-loss point. When the price moves in the direction of their trade, the lowest point of the last 20 days also rises, thus this strategy can not only 'track' the trend but also protect the continuously accumulating profits.
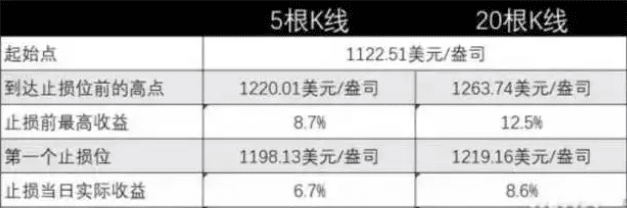
However, '20 days' is not fixed; the selection of 'X candlesticks' depends on the degree of volatility the investor can tolerate. The more candlesticks used to determine the stop-loss point, the greater the room for trading changes. Using closer highs or lows results in a faster triggering of the stop-loss. Analyzing the trend of gold from December 16 to March 10 this year.

It can be seen that the gold price's upward trend lasted from December 16 to February 27, reaching a peak of $1263.74 per ounce, and then started to reverse. During the rise, the gold price experienced several minor pullbacks, and there were two instances where it fell below the 5-day stop-loss line.
If an investor constructs a channel stop-loss point using 5 candlesticks, they will close their position on January 25, catching only about a trend up to $1220 per ounce of gold, still over $40 away from the highest point. However, if a longer period is chosen, such as using 20 candlestick lows as the stop-loss point, it won't trigger until March 7, allowing the investor to fully capture the rise from about $1122 to $1260 per ounce.
However, some readers may have noticed the flaw in this strategy. The longer the time period used by the investor, the more profits can be captured, but once the stop-loss point is triggered, more profits are given back. In the trending example above, the 20-day candlestick stop-loss point gave back significantly more profits than the 5-day candlestick. The greater the profit, the greater the risk; this is an unchanging rule in the financial world.
In response, an effective countermeasure is to use a long-period channel stop-loss strategy in the early stages of futures trading. Once the trade achieves considerable profits or a very strong trend movement occurs, investors should gradually shorten the channel period, aiming to only give back a tiny portion of the large floating profits.
Using this trend as an example. The lowest point in the first major correction is near the 13-day low; this means that as long as the investor uses 13 or more candlesticks to construct the channel stop-loss point, they can avoid this stop-loss and welcome the next upward trend. Similarly, the lowest point in the second correction is the near 7-day low; if an investor uses a period of more than 7 days, they can also avoid premature stop-loss exit.

Next, continue to shorten the channel period. You can see that on the second trading day after this trend began to reverse, the price fell to nearly the lowest point of the past 5 days. If the investor had shortened the channel period to less than 5 days by this time, they could exit the downtrend early, effectively capturing the profits from the previous round of increases.
The last point to consider is a very important weakness of the channel stop-loss. The channel breakout method is so popular that it triggers a large number of stop-loss or entry orders at previous low or high points, resulting in noticeable price slippage when you use these techniques in futures trading. In this case, setting some distinct stop-loss points is a better method, at the cost of having to bear slightly more losses.
2
Another stop-loss strategy available in the market - 'Hanging Lamp Stop-Loss', which dynamically quantifies the amplitude of fluctuations, can effectively compensate for this flaw.
The hanging lamp stop-loss strategy often sets the trailing stop-loss point below the highest price (or highest closing price) within the market range. This highest price (or highest closing price) is calculated from the time we enter the market, and the stop-loss point generated by this strategy hangs down like a lamp from the 'ceiling' of the market's highest price, hence the name.

So how do you select the hanging position from the high point? Generally, experienced traders will consider ATR (Average True Range). This indicator is mainly used to understand the price's oscillation amplitude and rhythm. Usually, the price's volatility will remain within a certain norm, but if there is significant capital entering or exiting, the price's fluctuation is often aggravated. Additionally, during price consolidation, when the volatility reduces to an extreme, it often leads to a trend shift. The ATR indicator is designed based on this principle, with its calculation formula being:
TR = max(Highest Price - Lowest Price, Today's Highest Price - Yesterday's Closing Price, Yesterday's Closing Price - Today's Lowest Price);
ATR = N-day simple moving average of TR.
However, in general, investors do not need to calculate the ATR indicator, as most software platforms provide it readily. In practical applications, since there are usually 22 trading days in a month, most traders will choose the 22-day ATR indicator as a parameter. With the ATR parameter, you can calculate the stop-loss line, and this dynamic changing stop-loss line calculation method is as follows:
Hanging Lamp Stop-Loss Point (uptrend) = 22-day high - ATR(22) x 3
Next, let's see how this method is specifically applied. Taking the example of the gold price from December 21 to March 10, during its rising trend and reversal, on January 9, the first 22-day high point appeared, and calculations began from there.


Some may wonder why from January 12 to January 16, the highest point has moved up, but the stop-loss point is declining? This is actually the biggest advantage of this stop-loss strategy. One must realize that market fluctuations are inevitable; past stop-loss indicators often trigger premature exits due to sharp fluctuations. The hanging lamp stop-loss is different; by incorporating the assessment of actual volatility, this stop-loss point will dynamically adjust according to market fluctuations, using a more typical 5-day period for measurement.

On the candlestick chart, it is very intuitive that before the gold price reached the highest point of the first wave in the trend on January 17, there was a relatively sharp rise, causing the actual volatility on that day to rise; while before another high point on February 27, the price had been steadily rising with relatively small volatility. It can be seen that when using this method to calculate stop-loss levels, the former tolerates a larger volatility amplitude, thus avoiding premature exit; as the market transitions from stability to volatility, it may lead to significant market movements, so the latter tolerates a smaller amplitude.

Let's take a look again; when using the channel stop-loss strategy, different periods represent different volatility amplitudes. Setting stop-loss points based on long periods allows for greater tolerable volatility, but also results in higher profits being given back when a stop-loss occurs. Conversely, the shorter the period, the less tolerance for volatility. Therefore, investors must choose the cycle carefully before applying it and continuously adjust during the process. In the hanging lamp stop-loss, the application of the ATR indicator has already incorporated volatility calculations, so investors do not need to consider too many factors and can comfortably make profits.

Of course, this method can be applied not only for long positions but also for short positions. However, the calculation method for the hanging lamp stop-loss point changes to (22-day low + ATR * 3). Taking the example of the time period in November 2016 during a downtrend in gold price, after finding the first 22-day low, the stop-loss level will continue to drop as the price falls.


The martial arts secrets have been given to you all; whether you can become famous in the world depends on yourself.
Continue to watch: $LPT $PARTI $dexe