The spotlight was on HUMA, the native token of Huma Finance, as it made its official debut on Bitget. While the token initially saw bullish momentum, the latest chart shows a sharp pullback of -9.59%, closing at $0.056, down from a 24h
So, what happened after the initial hype? Let’s break it down
Huma Finance Recap 📘
Huma Finance is pioneering on-chain income-backed DeFi, allowing users to tokenize real-world income streams like salaries and freelancing payments for borrowing and lending. It’s an innovative twist on #RWA DeFi — and that’s why its launch was highly anticipated.
Updated Technical Analysis (1D Chart) 📉
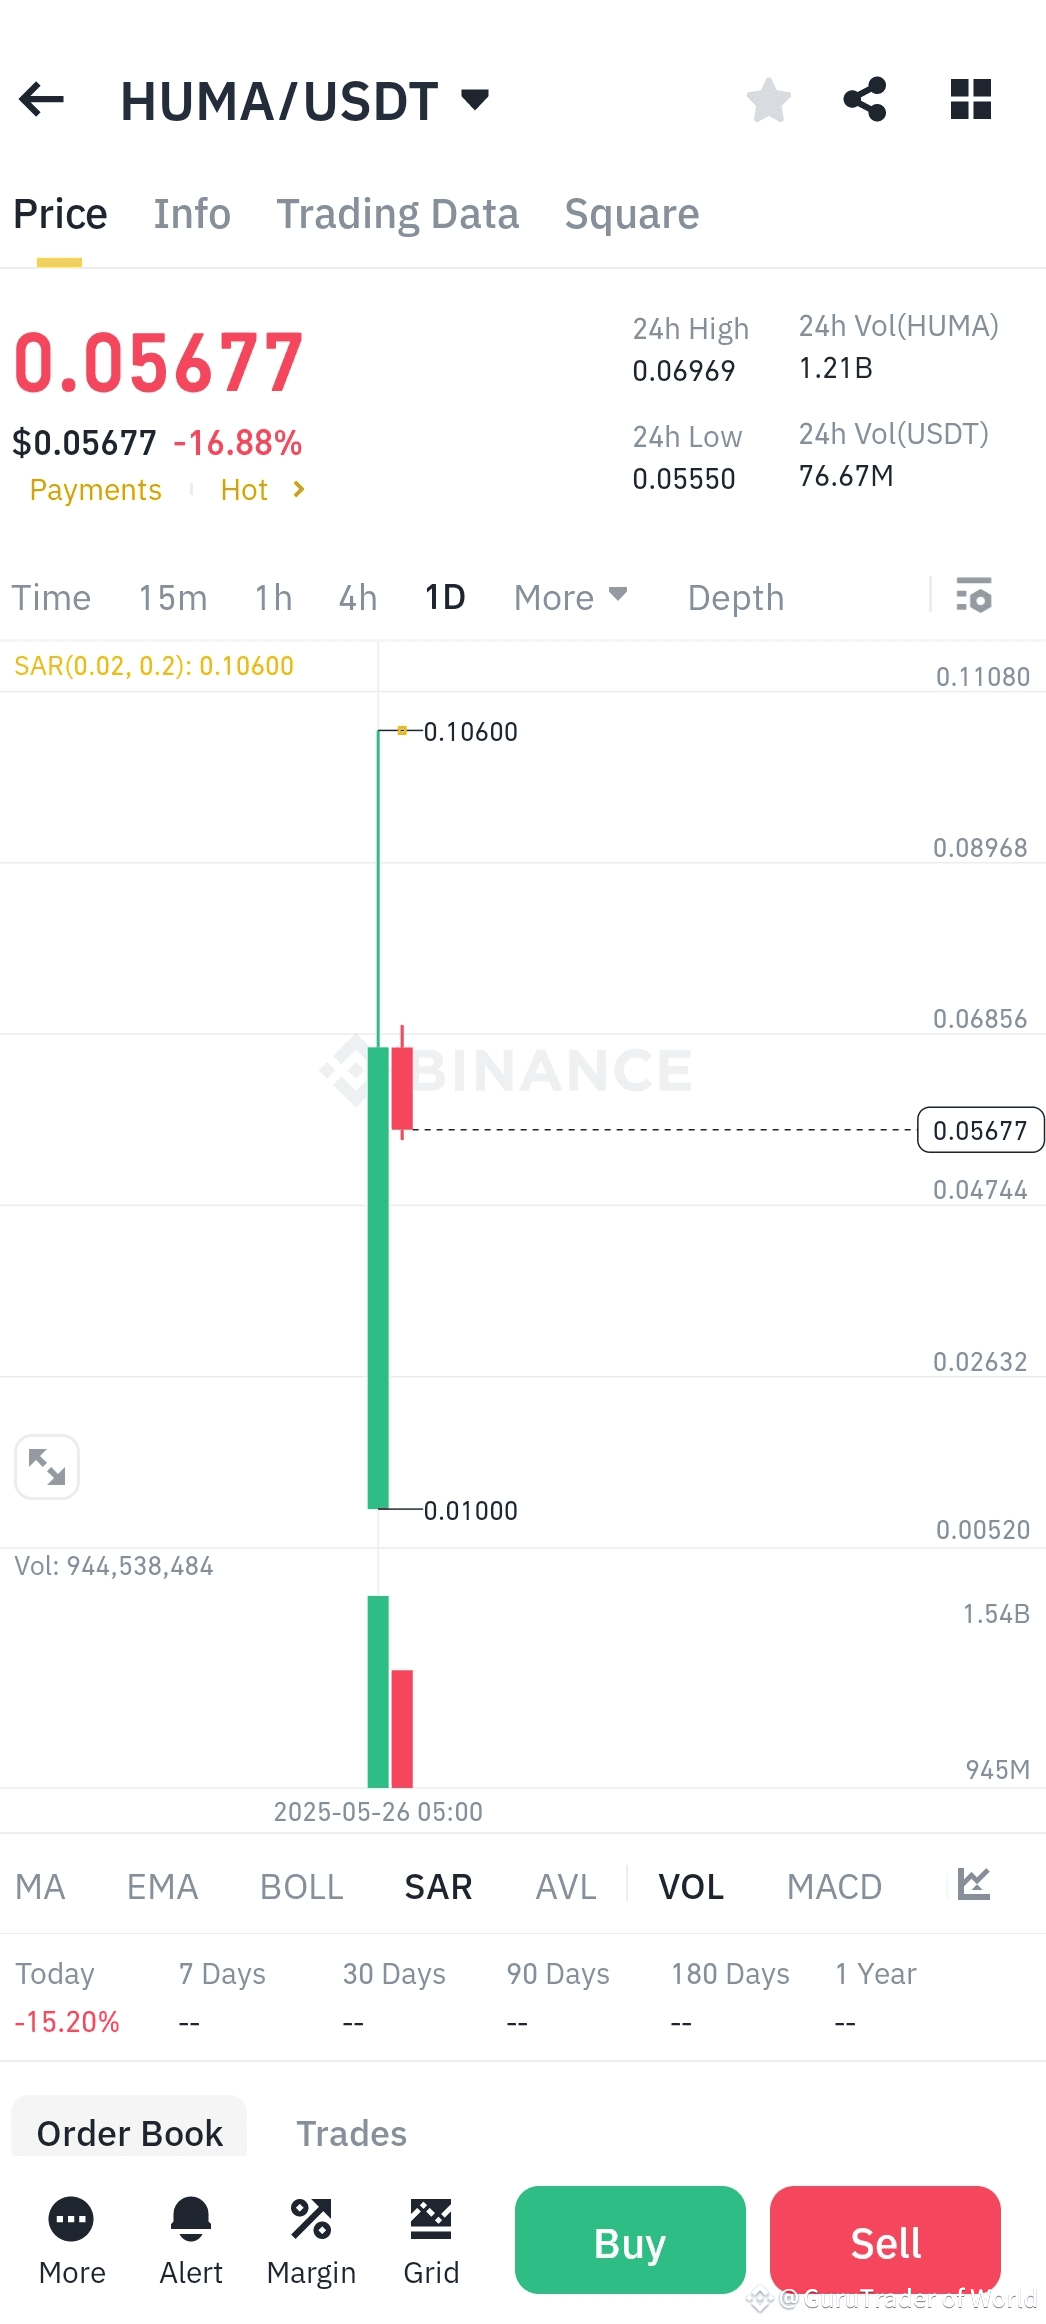
1. Price Movement
Opening Surge: $HUMA briefly spiked to $0.07397 after listing.
Sharp Reversal: It plummeted to a daily low of $0.05582, now stabilizing near $0.06178 — suggesting a sell-the-news reaction or profit-taking phase.
2. Volume
Massive 24h Volume: Over 867 million HUMA traded, with $57M USDT turnover, showing intense speculative activity.
Volatility is high — which is typical during early price discovery post-listing.
3. MACD (Momentum Analysis)
MACD Line: -0.00033
DIF: -0.00041
DEA: -0.00008
These values signal a bearish crossover, meaning downward momentum is currently dominating the chart. The histogram bars are extending downward — a red flag for short-term bulls.
4. RSI (Relative Strength Index)
RSI indicators are not fully plotted yet, but given the steep drop, RSI is likely near oversold territory, possibly around 30 or below, hinting at a potential bounce zone.
5. Candle Structure
The chart shows a long bearish candle, indicating overwhelming sell pressure.
Support: Forming around $0.055–$0.057
Resistance: Short-term resistance is at $0.068–$0.070
Outlook: Short-Term Weakness, Long-Term Potential? ⏳
While the short-term technicals show weakness, this correction might offer entry opportunities for long-term believers in the Huma protocol. Post-listing volatility is common, and tokens often retrace before resuming their true trend.
Final Word 💬
$HUMA’s early chart paints a story of speculation, hype, and healthy market correction. Whether you're watching from the sidelines or planning to enter, keep an eye on volume stability, MACD reversal signs, and RSI recovery to catch the next potential move.
DYOR and stay sharp — the DeFi space moves fast!