

Bitcoin price settled at $109,718 as of May 26, 2025, with a market capitalization of $2.18 trillion and a 24-hour trading volume of $29.24 billion. The intraday price action was bounded within a range of $106,802 to $110,078, reflecting a volatile yet structured trading session.

Bitcoin
The 1-hour chart indicates a choppy trading environment with bitcoin (BTC) bouncing from a local low of $106,666 back to the $110,000 level. Volume spiked during the dip, likely driven by short-covering activity, and diminished during the recovery, signaling a lack of strong buying conviction. Current price behavior shows consolidation just below $110,000, pointing to trader indecision. Entry opportunities are visible near $109,000–$109,200, with tight stop-loss placements below $108,500. Profit-taking near $110,500–$111,000 is advisable unless upward momentum accelerates significantly.

BTC/USD 1-hour chart via Bitstamp on May 26, 2025.
On the 4-hour chart, bitcoin shows a minor downtrend from its recent $112,000 peak down to approximately $106,500, followed by a tentative recovery. Volume during this recovery has thinned out, hinting at weak demand. A bear flag pattern may be forming, characterized by a gentle upward drift post-drop on subdued volume. If the price faces rejection around $110,500–$111,000 with heightened volume, a bearish outlook could intensify. However, a bullish reclaim of $111,000 with strong volume would validate a potential breakout back toward $112,000.

BTC/USD 4-hour chart via Bitstamp on May 26, 2025.
The daily chart reflects a broader bullish momentum initiated in early May, peaking recently at $112,000 per BTC. Volume patterns support the uptrend but also show a notable red candle post-peak, suggesting a swift rejection at that resistance. The price currently finds support within the $106,000–$108,000 consolidation zone. A pullback toward $108,000–$109,000 could offer attractive long entries, particularly if accompanied by bullish candlestick formations. A failure to surpass the $112,000 mark on subsequent tests, especially amid declining volume, may trigger exit signals and caution among buyers.
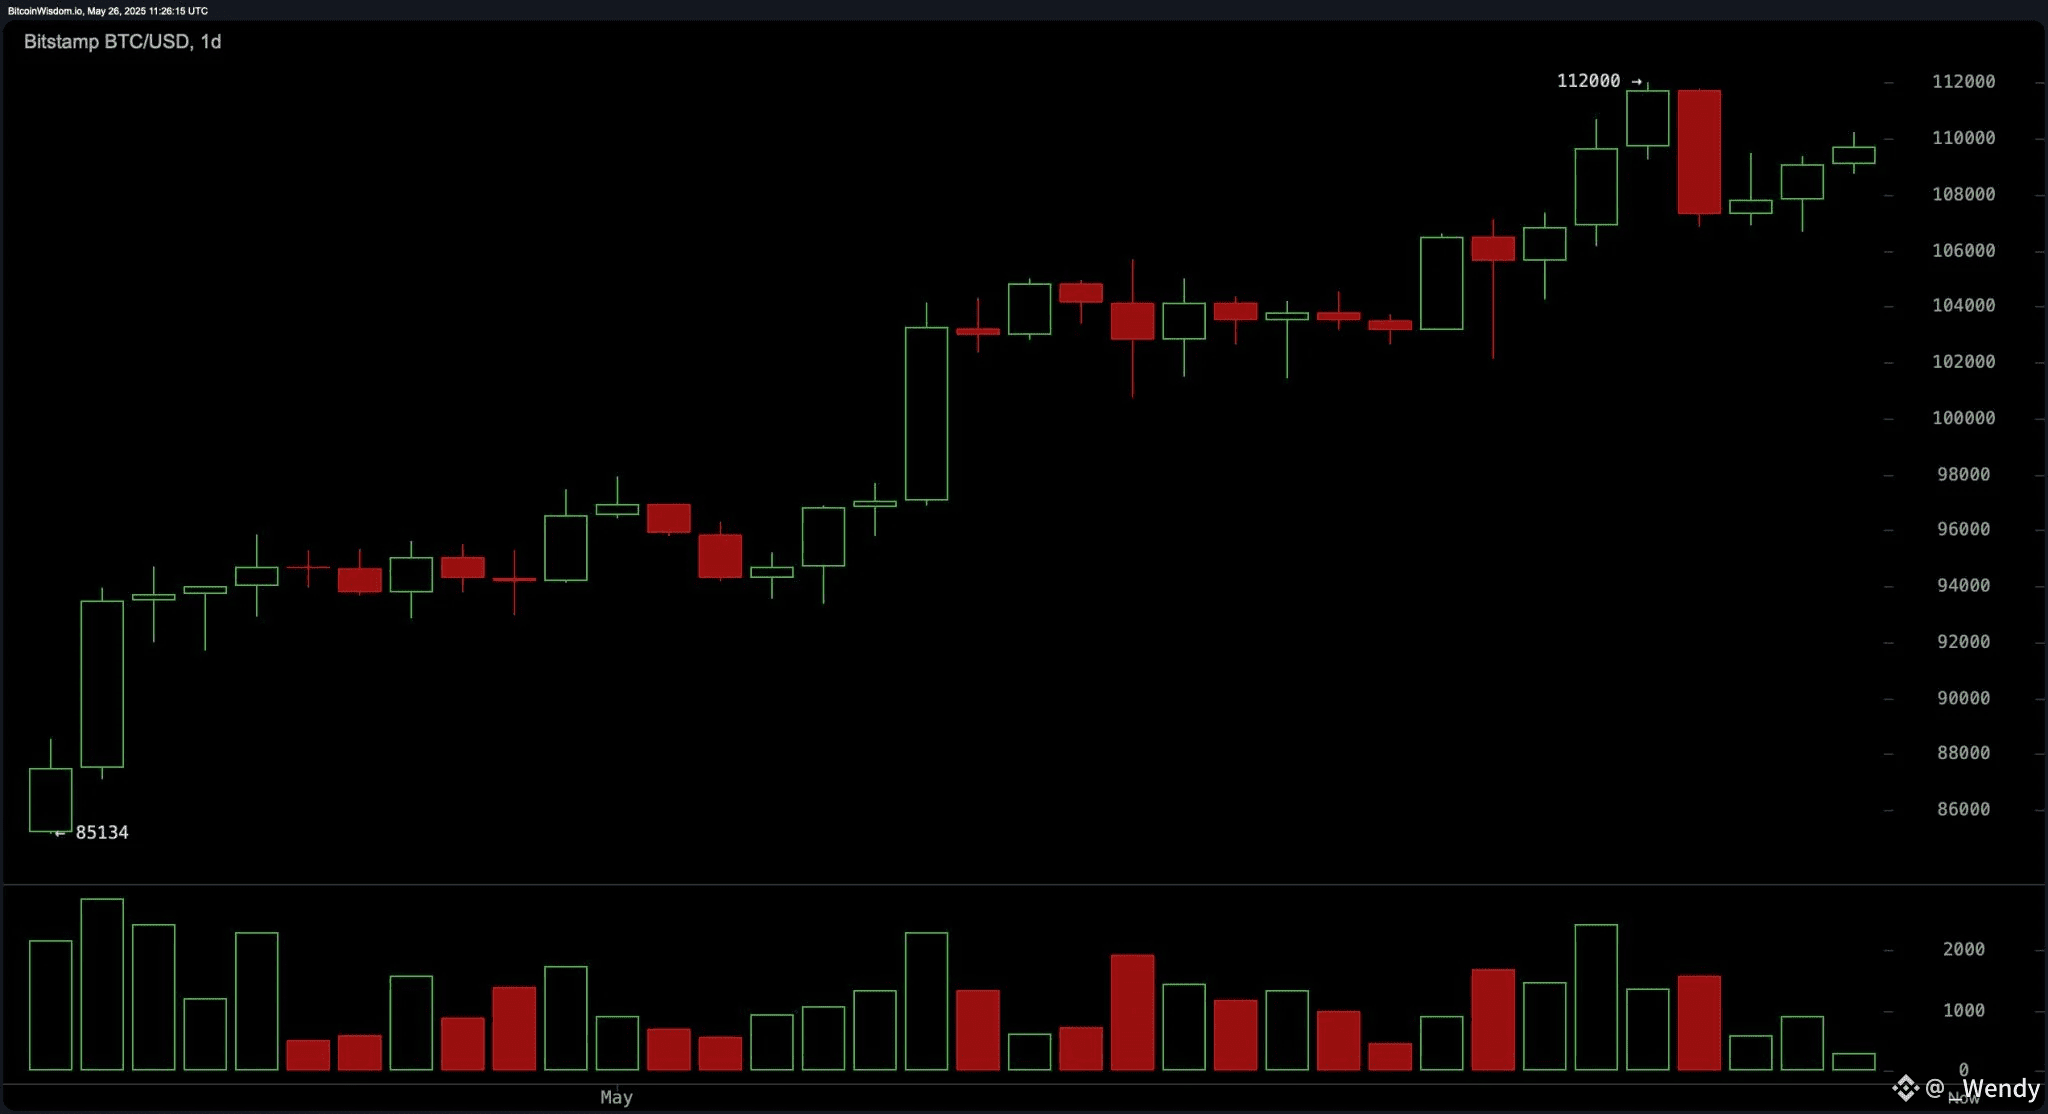
BTC/USD 1-day chart via Bitstamp on May 26, 2025.
Oscillator readings present a nuanced perspective. The relative strength index (RSI) stands at 67, suggesting the asset is approaching overbought territory but remains neutral. The Stochastic oscillator registers at 72 and, like the commodity channel index (CCI) at 118, signals neutrality. The average directional index (ADX) at 32 indicates a developing trend without extreme strength. While the momentum indicator shows a bullish signal at 6,214, the moving average convergence divergence (MACD) level at 3,793 signals a bearish divergence, presenting mixed oscillator sentiment that demands trader caution.
Moving averages (MAs) across all timeframes are uniformly bullish. The exponential moving average (EMA) and simple moving average (SMA) across the 10, 20, 30, 50, 100, and 200-period settings all align in favor of a continued upward trend. Specifically, short-term EMAs such as the 10-period EMA at $107,654 and 20-period EMA at $104,933 confirm bullish momentum with price action above these thresholds. Longer-term indicators like the 200-period EMA and SMA at $89,874 and $94,143 respectively underline a strong foundational trend. These aligned averages reinforce the bullish structure unless disrupted by a volume-driven reversal.
Fibonacci retracement levels further clarify support and resistance. On the daily chart, key levels include 38.2% at $101,737 and 50% at $98,567, both representing strong support if bitcoin experiences profit-taking. For the 4-hour chart, the 38.2% to 50% range between $109,032 and $108,116 is critical due to its confluence with volume clusters, making it a likely buy zone upon retest. On the 1-hour chart, the retracement levels between 50% ($108,466) and 61.8% ($108,041) present ideal zones for short-term scalping with stops set below the 78.6% retracement at $107,436. These retracement clusters provide precision in risk management and entry planning.
In summary, bitcoin remains in a technically supportive structure across timeframes, though price action near key resistance levels and mixed oscillator signals warrant a disciplined trading approach. Momentum remains largely bullish with caveats, especially near the psychological and technical thresholds of $112,000.
Bull Verdict:
Bitcoin’s strong positioning above all major moving averages, coupled with bullish momentum on higher timeframes and a well-supported price base around $106,000–$108,000, supports a continuation of the uptrend. If the price reclaims $111,000 with convincing volume, a breakout to new highs above $112,000 appears likely.
Bear Verdict:
Despite a broadly bullish structure, the presence of a potential bear flag on the 4-hour chart and mixed oscillator signals—including a sell from the MACD—introduce downside risk. A failure to reclaim $111,000 or a rejection accompanied by high volume could catalyze a deeper pullback toward the 38.2% or 50% Fibonacci retracement levels near $101,737 or $98,567.
#binance #wendy #BTC $BTC

