1. Daily level: Losing the BOLL middle track, the reversal signal begins to appear
From the daily chart, DOGE has been falling continuously, and the price has fallen below the middle Bollinger band (about 0.1775), and has moved down to near the lower Bollinger band, showing an obvious adjustment trend. The MACD fast and slow lines have a dead cross, and the red column has shortened to a green column, indicating that the bullish momentum has obviously weakened and the bears have begun to dominate the rhythm.
In terms of K-line structure, MA30 (0.1765) and MA7 (0.1729) have been lost, and there is no obvious support. If it cannot recover above 0.173 today, it will confirm the formation of a downward trend, and the support bands near 0.167 and 0.165 below may be tested during the day.

🔍 Technical conclusion: The daily line has confirmed a break, the trend has weakened, and the structure is bearish.
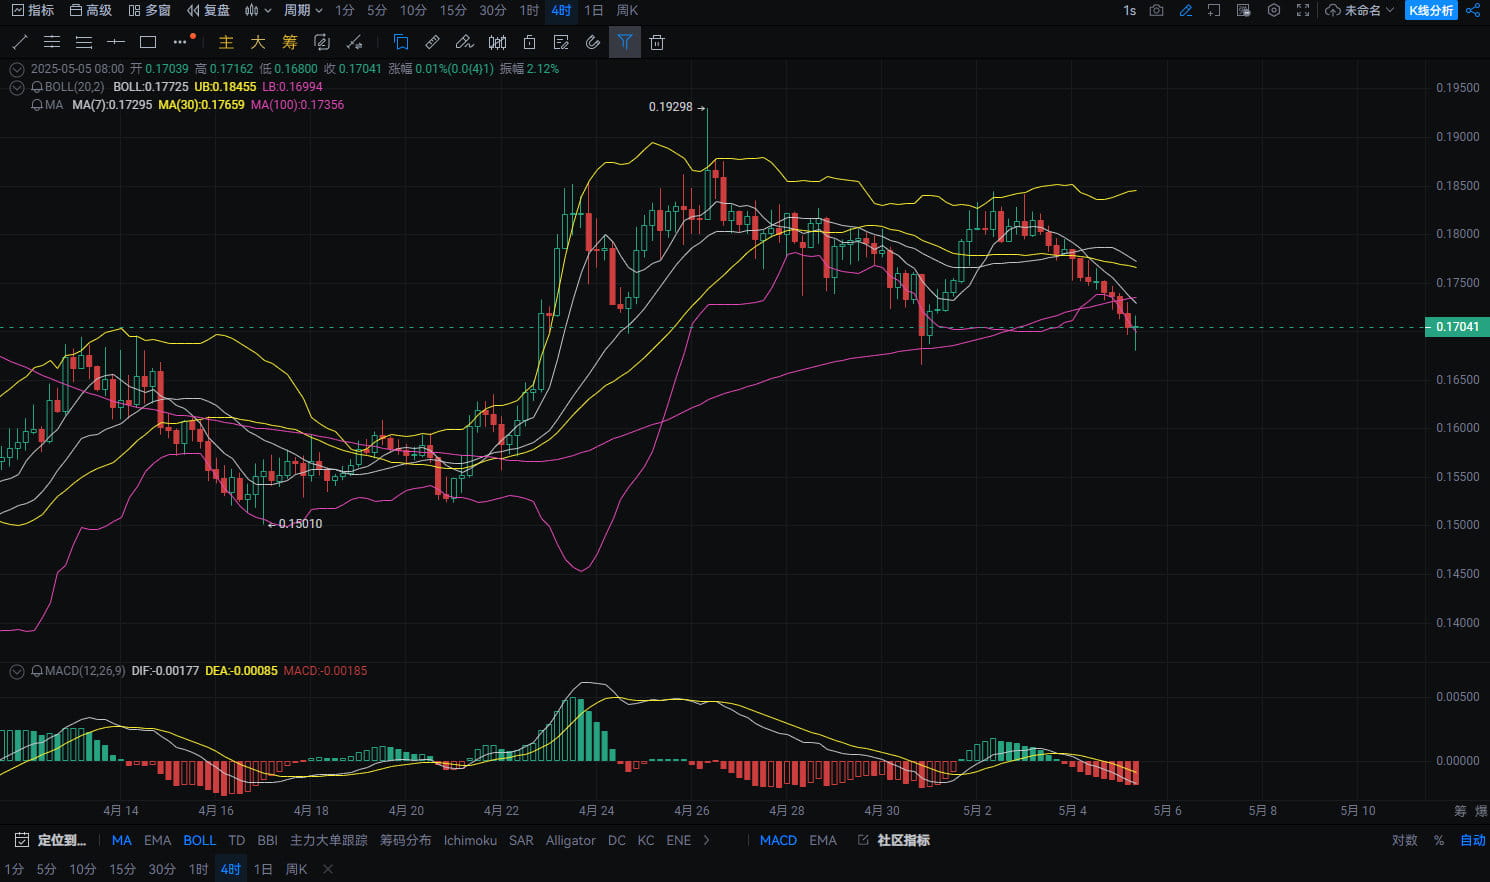
2. Four-hour level: Breaking below the key moving average support, a short position structure is formed
On the four-hour chart, DOGE has fallen below the BOLL middle track and all moving average supports. The current K-line is running near the lower track 0.169, and the BOLL channel opening is widening, indicating that the market may accelerate its decline.
The green column of the MACD indicator continues to increase, the fast and slow lines spread downward after an obvious death cross, and the short-selling energy continues to increase. The K-line has been falling continuously without any obvious rebound, and the weak structure is obvious. If it continues to maintain below 0.171, it is very likely to test 0.168 and 0.165 in the short term.
🔍 Technical conclusion: The four-hour chart is strongly bearish, so prevent a sharp drop.
3. One-hour level: Weak rebound with no volume, there is still downward momentum in the short term
From the hourly chart structure, DOGE has a slight short-term pullback, but it is still running below the middle Bollinger band. The volume is insufficient during the rebound and it is difficult to form a substantial reversal. The current Bollinger band is still opening downward, and the price is running close to the lower band, which is a typical bearish trend continuation pattern.
After the MACD crossover, the green column continues to expand, and the short-term trend is still weak, and the rebound strength is limited. If the 0.173-0.174 area is verified as a false breakthrough, it is very likely to usher in a new round of rapid decline.

🔍 Technical conclusion: The hourly chart is still bearish and the short-term rebound is difficult to sustain.
4. Operational suggestions: Focus on high altitude and control positions
🎯 Opening range: 0.170–0.171
🎯 First Zhiying position: 0.1675
🎯 Second place: 0.166
❗ Zhisun position: 0.174
📌 Operational logic: DOGE has fallen below the key medium- and short-term support, and the weak pattern is obvious. At present, you can lightly arrange short orders, take profit at 0.1675 and 0.166, and set the stop loss at 0.174. Once this position is broken, short-term stop loss will be exited and wait for new signals.
V. Conclusion
DOGE's current structure is fully bearish, and the three major cycles all point to an increase in downside risks. If there is no sudden good news to pull up the market, the weak structure will most likely continue in the short term. It is currently suitable to go short with the trend, try orders with a light position, and enter and exit quickly to ensure that risks are controllable.
📉 The short-term bearish trend is clear, the strategy is mainly defensive counterattack, and patiently wait for confirmation of the sell-off.

