The ETF altcoin season is coming, will XRP skyrocket? Recently, there has been a frenzy online claiming "the U.S. SEC approved the XRP spot ETF," causing the XRP price to surge by 5% temporarily, but after a slight increase, it quickly fell back as everyone realized there was a misunderstanding. What are the three new XRP ETFs? These ETFs do not buy XRP directly but bet on futures price fluctuations. ProShares is set to launch on April 30.
2x Long Futures ETF
1x Short Futures ETF
2x Short Futures ETF
XRP ETF status: The U.S. has four XRP ETFs, all futures, with no spot ETFs. On April 25, the XRP spot ETF was listed in Brazil, and on May 19, the Chicago Exchange launched XRP futures, possibly paving the way for a spot ETF. So when will the SEC approve the spot ETF? Companies like Grayscale are applying, but the SEC has not yet given any indication. Currently, the ETF altcoin season is about to arrive, with over 70 ETF applications, and everyone is betting that the new SEC chair will allow them. XRP, Sol, and LTC are the focus of the next wave, while Doge, Bonk, and PENGU are also joining in on the ETF excitement, likely leading to a pump and dump. XRP Market Cap: $134.5 billion, SOL Market Cap: $76.9 billion. If both pass ETF approval, considering market cap and ecosystem advantages, SOL may have greater potential for price increases in the future.

These altcoins applying for ETFs are about to explode with a 10x increase! 1.SOL
The total locked value (TVL) of Solana is $8.54 billion, with a 24-hour trading volume of $3.67 billion and open interest of $1.11 billion, indicating that the Solana ecosystem is thriving, with DeFi and derivatives markets continuously active. Additionally, Solana saw a massive influx of funds in April. A few days ago, over 37.4 million SOL (worth nearly $52.76 million) were transferred out of Binance, indicating significant whale activity and fund redistribution within the Solana ecosystem.
Will such a large-scale withdrawal tighten exchange liquidity and affect short-term SOL price dynamics?
The price of Solana is in a perfect cup and handle formation and has just bounced off the support level of a parallel channel. As the bears seem to have sufficient control over the token, the price is slowly moving towards the resistance level. However, the bulls maintain the upward trend, thus sustaining the bullish hope. Both DMI levels and ADX have contracted, indicating that a strong price movement is imminent according to historical chart patterns. On the other hand, the weekly MACD shows a decrease in selling pressure, and the levels are trending towards a bullish crossover. Therefore, in the coming month, the price seems poised to break through $200.
Solana's fundamentals are strong, thanks to whale participation and the rapidly growing DeFi ecosystem. After experiencing a significant recovery and DEX trading volume surpassing Ethereum, SOL continues to attract attention from traders and long-term holders. Therefore, the price of Solana (SOL) is expected to break through the resistance level of around $200 and could reach new highs close to $500.

2.XRP
Two potential reasons for the expected significant volatility in XRP price are: legal developments in the SEC lawsuit, institutional adoption, and the regulatory environment. A favorable ruling from the SEC vs. Ripple case is expected to provide clear explanations and may boost investor confidence. Meanwhile, the first XRP spot ETF approved by Franklin Templeton indicates growing interest from institutional investors. On the other hand, the Trump administration proposed including XRP in the U.S. cryptocurrency reserve, which could enhance its legitimacy and adoption.
Now that market sentiment has shifted from fear to greed, will the XRP price maintain a solid upward trend and set a new high?
The upward trend since the market opened today has helped the token break through a bearish pattern. As trader sentiment turns optimistic, significant buying pressure has surged, and the price has broken through the descending triangle resistance level. However, the Bollinger Bands are showing contraction, which not only indicates a decrease in volatility but also suggests a significant breakout is imminent. On the other hand, the MACD shows an increase in buying volume, while MACD levels are falling back into positive territory.
The current trading pattern and technical indicators suggest that the XRP price is about to experience significant volatility. If the XRP price breaks through the resistance level of $2.45 to $2.71, it could pave the way for an increase to $3 or higher. Once the XRP price stabilizes above this range, a price increase could soon set a new high.

3.ADA
According to market data analysis from Intotheblock, the correlation between Cardano and Bitcoin over the past 30 days has been 0.87 (out of a maximum of 1). As Bitcoin (BTC) attempts to break above the key resistance level of $95,000, the ADA price is expected to follow suit.
Since the U.S. President announced on Truth Social on April 9 that now is a good time to buy, Cardano's futures open interest (OI) has soared from $603 million to around $802 million at the time of writing.
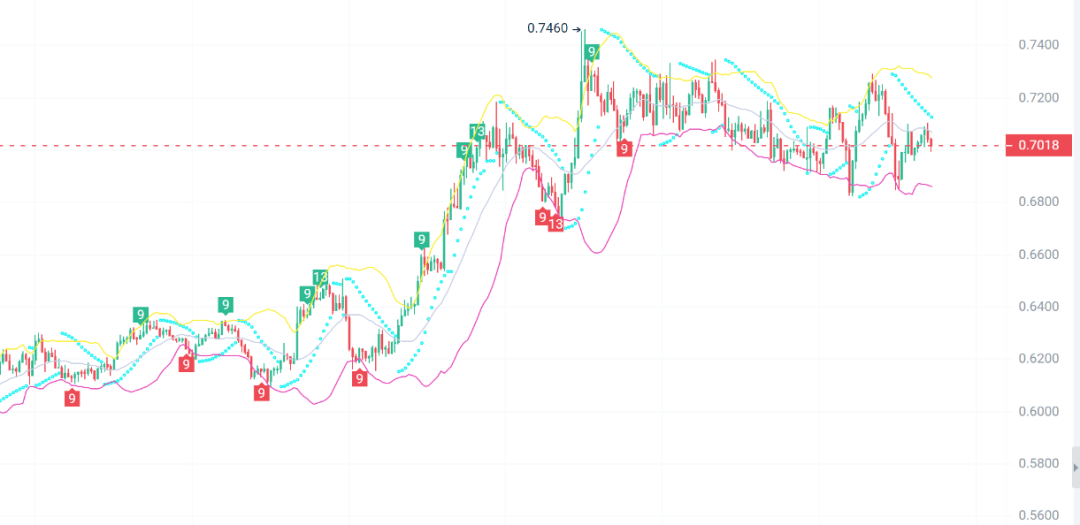
From a technical analysis perspective, Cardano's price follows a fractal pattern similar to that of Dogecoin during the 2017 cycle. Notably, the first explosive rise of altcoins in 2017 occurred in the second quarter.
In the past 3 days, the ADA price has formed a symmetrical descending channel, which may be broken in the near future. If the ADA price continues to stay above the resistance level of around 74 cents, a rebound to 88 cents is expected.