🟩Candlesticks or Japanese candles and their reversal or continuity patterns
🟥IN TRADING, THERE ARE NO ABSOLUTE TRUTHS, ALL TECHNICAL STUDIES AND ANALYSES ARE ONLY FOR ASSISTANCE. EVERYTHING WE WILL SEE IN THIS ARTICLE ARE HIGH PROBABILITY PROJECTIONS, BUT NEVER WITH 100% EFFECTIVENESS.
🟩After saying this so that no one gets confused, let's go with the article.
🟥Continuing with this new section of resources, and as a continuation of the article on harmonic patterns, we are going to publish a couple of articles that can help us determine a change of direction.
🟩The price always moves in a repetitive choreography, both within the same timeframe and in a fractal manner across different timeframes. It moves through impulses and corrections. We call them that, impulses and corrections, and not entry waves, precisely because what marks the direction of the trend are the impulses, which always have more movement than the subsequent corrections. And this choreography of a certain range impulse, and the subsequent partial correction of the previous impulse, to execute a new further impulse, is what forms the price structures.
🟥Through studies and analyses, we aim to fix the areas or targets where to project the end of these structures. However, these are just analyses, as the real market is the one that always marks the reality of the movement and its volatility, or precisely the lack of it, can cause these projections to fall short or be broader than expected. All analysis techniques agree on working and trying to determine the end targets of each structure, and the results are positive with high levels of accuracy when the analyst has sufficient knowledge and experience. What is determined are the areas with a maximum and a minimum where these movement ends should occur.
🟩However, there is another variable that is impossible to measure, volatility. We will never be able to predict the future, whether it will be today or tomorrow, or next week, that investors will enter a particular instrument. And, moreover, if they enter, with what strength and determination will they do it? since this does depend on many variables: market sentiment, news, economic events, the day of the calendar (if it is the end of the month or quarter or even the week) and many more variables. In short, the sum of all these variables determines the emotions, the emotions that all investors constantly feel. When the average of these emotions is equal for a high part of investors (never all, or the markets would disappear), then is when the price makes the moves. It is the eternal struggle between bulls and bears. Well, after this prologue to set the scene, let's get straight to the issue at hand.
🟥On one hand, we know that the price moves through certain structures of impulses and corrections. Once a structure is completed, we have a major correction, not of the last impulse, but of the entire structure, to later follow the path. For any investor or trader, being able to determine the end points of these structures is the basis for being able to operate and be profitable in the markets. And as we have seen previously, analyses only serve to determine a broad area where this can happen. If we talk about 15-minute charts, these areas can be from 20 to 40 points (which makes intraday trading so difficult), and for weekly charts, obviously, these areas can be very broad, up to hundreds of points. To have more technical elements, to determine these possible change areas more accurately, thousands of studies have been done to find elements that help validate these change and reversal zones.
🟩Candlesticks or Japanese candles🟥
🟥I am not going to go into explaining the history of Japanese candlesticks now, it is not the place, just to explain that they are hundreds of years old, and extensive studies on the patterns they draw, already proposing from their origins the reading of investors' emotions, hundreds of years before Elliot considered the study of markets based on the study of the same emotions.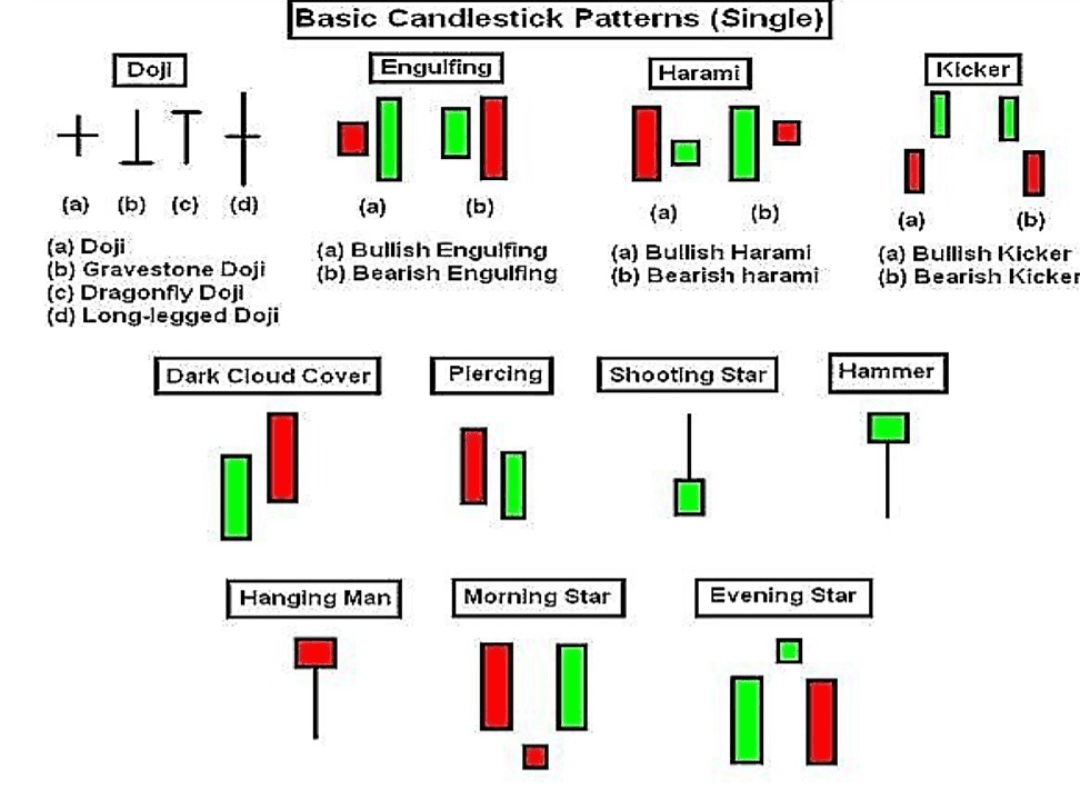
🟩With names as suggestive as doji, engulfing, harami, kicker, dark clouds, piercing, shooting star, hammer, hanging man, morning star, or evening star, and many more that we will see, there is a series of candle patterns that can help us a lot when we are in a conflict or expected change of direction zone, to find the moment to make the best possible exit from the trade. This is for those who want to trade until the end of the movement. Remember that it is always much easier, safer, and more profitable to trade only the middle part of the movement.
🟥In this last chart, we see a few more patterns, and the explanation of some of the reversal movements. I am going to post different captures with candle patterns because the goal is to know these patterns very well to be able to identify them right when they form in the markets. And later we will see some examples of their application with real charts. Also, it is difficult to find a single table with all the patterns, you will see that in the different tables some appear that do not appear in others.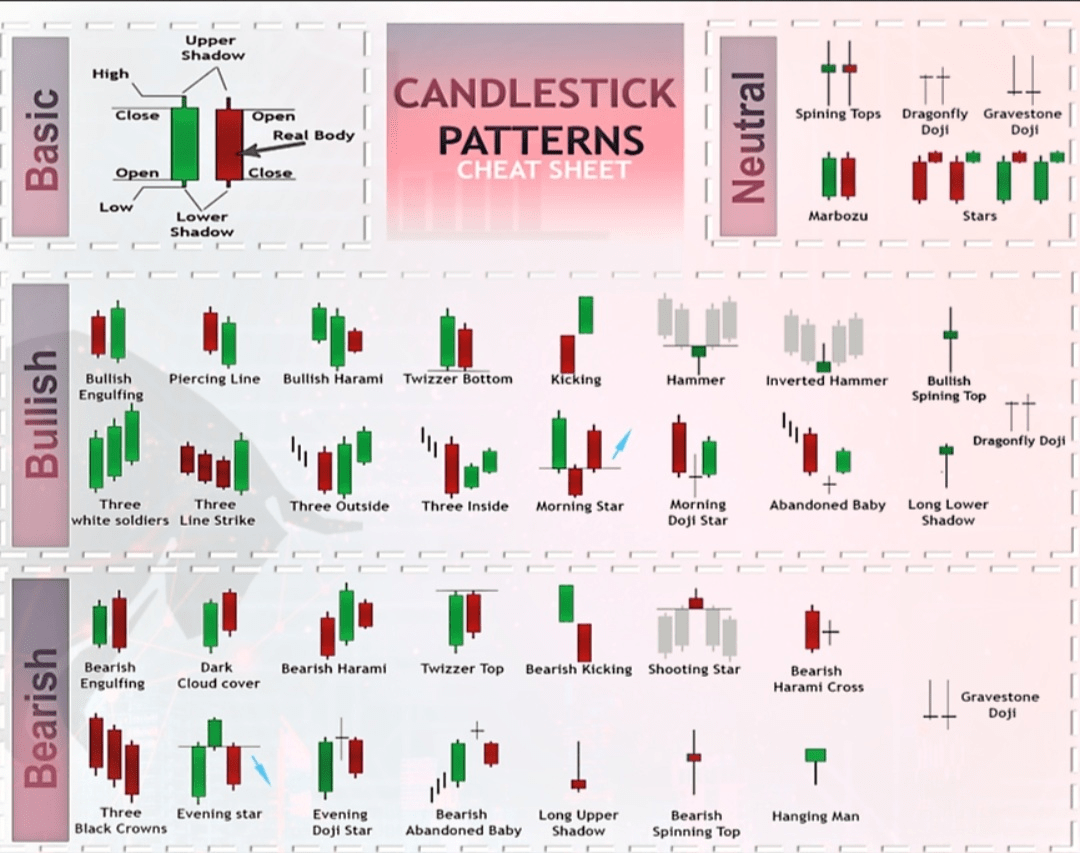
🟥And here is a table with the best-known patterns, to make it easier for you to start learning or memorizing. A good system is to print one of the tables you will find in this article and hang it right next to your workstation. This has a double function: on one hand, it continuously reminds you that you should take these patterns into account; and on the other, by searching and checking very quickly, you will learn the patterns by heart. Without further delay, let’s check in real charts how effective it is to learn this technique as support for our operations.
🟩As you can see, it’s frightening. It turns out that at every turn of the real price we have a Japanese candlestick pattern, and sometimes two or more patterns coincide. We could be posting charts and charts and all the results would be the same. However, this is an exercise that I leave for you to start practicing. Like everything related to financial markets, any study you undertake will take you a lot of time, many hours to learn, and many more hours to practice. For this reason, this business has no shortcuts; only those willing to invest thousands of hours will end up understanding the markets and trading profitably in them. Personally, I will try to separate the grain from the chaff as much as possible, so that everything published in the blog is very productive for you and you do not waste time studying things that lead nowhere.
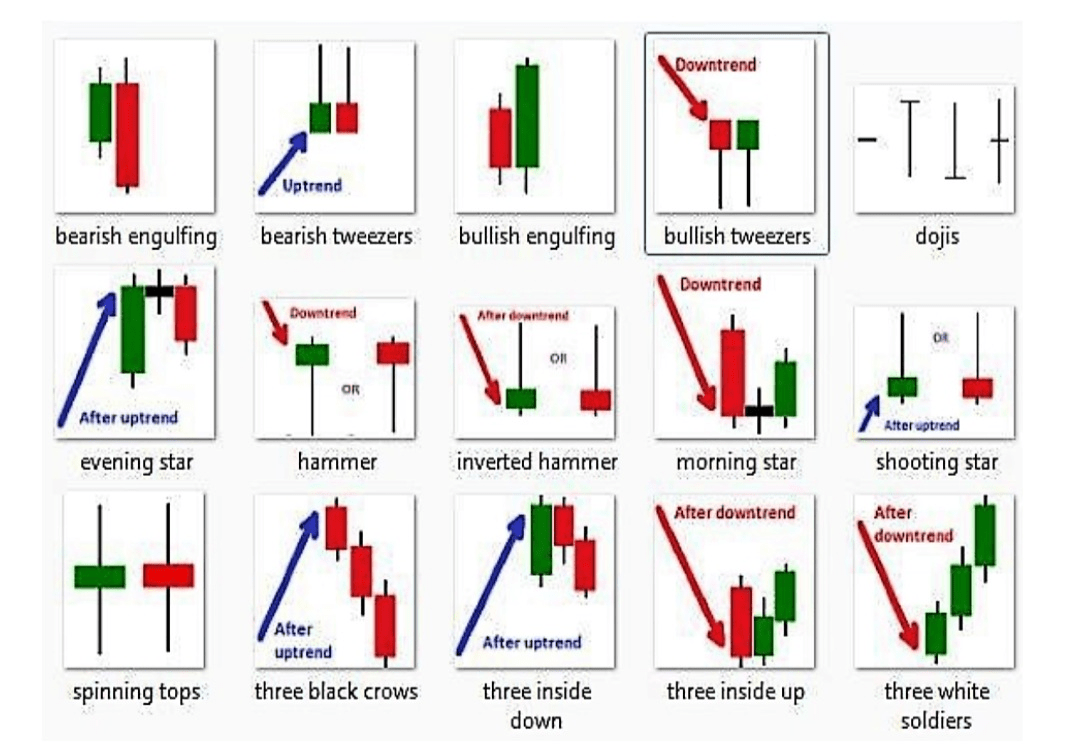
🟥Come on, a little help to understand this that seems so complicated about Japanese candlestick patterns. Pay close attention to the following table.
🟩In most change patterns, that is, for example, in a bullish trend with green candles, what marks the change pattern is a red or neutral candle when it makes a higher high after the last green candle.
🟥A neutral candle is understood as one whose body is smaller than half the total range of the candle. Thus, the following candle figures will be neutral: hammer, hanging man, shooting star, morning star, evening star, and the different types of dojis.
🟩And vice versa, exactly the same. In a clear bearish trend with red candles, a green or neutral candle appears that makes a lower low than the previous red candle.
🟥This detail that a candle of a color contrary to the trend makes a new high or a new low should be the warning sign that we may be in a trend change pattern. If the new high or new low is produced by a neutral candle, the result is the same.
🟩The other signals or patterns to consider, without the previous figures being present, are those that occur with the following most common patterns:
🟥Harami or the golden bar, where a candle is completely within the range of the previous candle. The exit of the next candle, either above or below the Harami candle, almost always gives an important movement of three candles in the direction of the break. It can also be a harami cross.
🟩Tweezer or pinch both at the top and at the bottom. When two candles of different colors equal each other both in the height of the wick and in the height of the body of the candle, and both are roughly the same size at the end.
🟥Three inside, a classic change figure, practically untradeable to enter, since you have to wait for three candles in the same path and, normally, after the third one, a correction usually comes, or even a continuation of the main trend.
🟩Kicking or follow-through kick both in trend change when it is bullish, or when it is bearish. The kicking usually creates a small gap or market jump in motion that is not usually filled in the next candles.
🟥The three stars of the south are three consecutive candles with wicks at the bottom, followed by a green candle (change pattern) or the advanced block which is the same pattern but for an upward trend with three green candles with wicks at the top followed by a red candle.
🟩In all the other cases of change or reversal patterns, most as we have discussed, the warning will be given earlier by a candle of a different color that either makes a red candle or a neutral candle after a series of green candles in a bullish trend, a red candle or neutral candle that makes a higher high and, just after, moves in the opposite direction, that is, downwards. Or just the reverse, the same sequence but with a green or neutral candle, after a bearish trend of red candles and the green or neutral candle makes a new low before moving in the opposite direction upwards. To see this with examples from the real market, we can see it in this chart.
🟥It is evident that Tweezer patterns form at supports, resistances, historical levels, and from H1 to daily, which further validates the change of path.
🟩So far we have been looking at the reversal or change of direction patterns of price movements, whether it is a turn from impulse to correction, or a turn of the end of a correction to continue with the impulse (the most sought-after situation). However, the drawing of the candles does not always go clearly and nobly when making an impulse, but sometimes due to minor corrections, the candles do not trend one after the other but make strange drawings that make us doubt. For this case, we will see a series of situations or continuation patterns of the movement, to gain more security and control in our operations.
🟥The knowledge of these patterns can help us a lot when trading, as they warn us at very early moments within the trade of unforeseen risk situations, allowing us to adjust the Stop Loss or exit directly from the trade without losses, and wait for a clearer and safer option.
🟩So that you gradually understand the language of candles, in addition to the reversal or continuity patterns, here you can see, in a real chart with a 4-hour timeframe of the German DAX30, the different structures that the price is making and what we should look for or detect to know if there is or not a possible important reversal zone that separates us from the operation of the main trend. Note that from March 25 to April 4, the clear operation is to look for corrections to enter upwards. From April 4 to the Asian session of the 8th, it was completely untradeable, neither long nor short. From the European session of the 9th, it seemed that the path was short, a movement that was invalidated by exceeding the area of 11960. More untradeable period until the Asian session of the 16th, which has validated the entry into longs following the path.
🟥To conclude the article, I am posting the previous table with more reversal patterns, as it is one of the most used and well explained, although it only includes the most common patterns.
❗❗❗REMEMBER THAT PATTERNS ARE ALWAYS USED TO EXIT THE TRADE, IF YOU HAVE NOT EXITED BEFORE REACHING A HISTORICAL LEVEL, TARGET, OR A VERY IMPORTANT TRENDLINE.❗❗❗
👉👉YOU CANNOT ENTER AGAINST THE TREND, ONLY SUPPORTED BY A CANDLE PATTERN, AS IN THE BEST CASE IT COULD ONLY BE A CORRECTION WITHOUT MOVEMENT, AND THAT WOULD ALLOW EXITING WITHOUT LOSSES.👈👈
❗❗REMEMBER ALWAYS THAT IN MARKETS THERE ARE NO ABSOLUTE TRUTHS: IT IS NOT ALWAYS THE SAME. WE ARE ALWAYS $BNB

TALKING ABOUT PROBABILITIES ❗❗$BTC

