
"Looking forward to the endless frontier technology; seeing the future, leading the new era of investment research." This report is provided by the "WTR" Research Institute:Members’ Twitter IDs: Golden Egg Diary @jindanriji; Elk Will Not Get Lost @crypto_elk_; Forex Brother; Xibei @Asterismone;
The first round of WTR on-chain data subscription (OG) is officially launched!Data provided: WTR self-developed market short-term, medium-term and long-term on-chain data, as well as some small currency data. First round pricing: 399U/year. Payment supports on-chain and off-chain transfers. Other notes: We have prepared a strategy package for OG users. The number of places in the strategy package is limited. The current strategy package is only open to the first round of OG users. Subscriptions can directly add OG user groups, please see Twitter or wx for details.

Weekly Review
This week, from April 7 to April 14, the highest price of Sugar Orange was around $86,100 and the lowest was close to $74,508, with a fluctuation range of about 15.56%.
Observing the chip distribution chart, there are a large number of chip transactions around 80,000, which will have certain support or pressure.

analyze:
60000-68000: about 1.51 million pieces;
76000-89000: about 1.72 million pieces;
90000-100000: about 1.99 million pieces;
The probability of not falling below 70,000-75,000 in the short term is 70%;
The probability that it will not rise below 85,000-90,000 in the short term is 80%.
Important news
Economic News
Goldman Sachs raised its 2025 gold price target from $3,300 per ounce to $3,700 per ounce (up 12%).
Federal Reserve Board Governor Waller believes that the high inflation caused by tariffs is temporary. In the smaller tariff scenario, rate cuts could come in the second half of the year. In the large-scale tariff scenario, if the economy slows significantly, there may be a preference for earlier and larger rate cuts.
US economic data and expectations:
The New York Fed’s one-year inflation forecast for the United States rose to 3.58% in March (higher than the expected 3.26% and the previous value of 3.13%).
The New York Fed expects the U.S. unemployment rate to rise in March to its highest level since April 2020.
Inflation CPI fell to 2.4% in March.
Tariff policy and its impact:
Last weekend, Trump’s tariff measures changed again, exempting some electronic products from “reciprocal tariffs.”
Economists believe the exemptions are due to the realization that the tariff shocks and the chain reaction they cause have hit pain points.
Analysts see the exemption as a sign of concessions by the United States, which may be under pressure from the bond market (the bond market is seen as a top priority for Trump).
Analyst James Van Straten believes that uncertainty surrounding Trump's tariffs triggered the market sell-off that began on April 3.
Fox reporter Charles Gasparino believes the market will react positively to the "Tim Apple tariff exemption" and could boost the Nasdaq.
Investors generally view the tariff plan as one of the worst policies in recent years. Trump's erratic tariff measures have shaken market confidence in U.S. policies and the economy.
U.S. Treasury Bonds:
JPMorgan Chase CEO Jamie Dimon said he is preparing for chaos in the nearly $30 trillion U.S. Treasury market and believes the Federal Reserve will only intervene when the market panics.
The U.S. Treasury market experienced a $29 trillion sell-off last Friday, marking its worst week since 2019.
Looking back to March 2020, the collapse of the U.S. Treasury market forced the Federal Reserve to conduct trillions of dollars in bond-buying intervention.
Recession concerns:
BlackRock CEO Larry Fink warned that a U.S. recession may have begun, citing economic pressures and protectionist trade policies as key drivers.
Market Focus and Outlook:
The market focus may shift from the negative impact of tariffs to expectations of interest rate cuts, which may be the beginning of a turnaround in the market.
Easing inflationary pressures could provide room for the Federal Reserve to cut interest rates and ease financial conditions at its May and June meetings.
Analysts are watching to see when the Federal Reserve will intervene in the market.
Encrypted ecological news
U.S. Senator Tim Scott expects the Cryptocurrency Market Structure Act to become law by August 2025.
The Senate Banking Committee has promoted the stablecoin regulatory bill "GENIUS Act" in March 2025, making crypto policy a priority and emphasizing innovation before regulation to maintain U.S. leadership.
SEC interim director Mark Uyeda said that it is possible to consider establishing a short-term crypto regulatory framework to allow companies to innovate, while developing permanent plans to promote blockchain innovation.
Institutional and corporate news:
The size of BlackRock's BUIDL fund reached US$2.372 billion, a single-week increase of 25.07%.
Tether CEO Paolo Ardoino said that the number of its stablecoin users increased by 13% in Q1 2025.
Metaplanet Inc., a Japanese listed company, announced that it had increased its holdings by 319 BTC.
MicroStrategy increased its holdings of BTC by $285.8 million (3,459 BTC) between April 7 and April 13.
Tether issued an additional $1 billion in stablecoins on April 12.
Market Views and Analysis:
Bo Hines, executive director of the White House Presidential Digital Asset Task Force (as reported by Cointelegraph), said that BTC needs to be hoarded as soon as possible before it becomes expensive.
Analyst James Van Straten pointed out that the BTC/VIX ratio touched the long-term trend line. Historical data shows that this often indicates the bottom of BTC price (previous effective time points: August 2024, March 2020, and August 2015). If the support is effective, BTC may have established a long-term bottom.
JPMorgan Chase CEO Jamie Dimon believes that the turmoil in the U.S. bond market and subsequent Federal Reserve intervention may prompt investors to turn to BTC as a tool to hedge against currency instability (similar to the situation in 2020).
Analysts believe that the economic slowdown may prompt the Federal Reserve to change its tightening policy, triggering new liquidity and becoming a major catalyst for crypto assets such as BTC.
Looking back to March 2020, when the Federal Reserve intervened in the bond market, the currency market also saw a significant rise.
Long-term insights: used to observe our long-term situation; bull market/bear market/structural change/neutral state
Mid-term exploration: used to analyze what stage we are currently in, how long this stage will last, and what situations we will face
Short-term observation: used to analyze short-term market conditions; the possibility of certain directions and certain events occurring under certain conditions
Long-term insights
Holder Structure and Belief HODL Waves
Structural impact of ETFs
Illiquid, long-term whales
The status of exchanges with large whales
(Figure below: Holder structure and belief HODL wave)

After experiencing multiple market cycles, the group of long-term holders (LTH) is growing, and they constitute the "ballast" of the market.
Although some old coins (such as 2y-5y) moved (profit taking) when the price peaked, the oldest part (such as >5y, purple area) appeared relatively stable and even slightly thickened in the recent consolidation.
This suggests that long-term holders with the strongest convictions have not panicked and sold due to recent volatility, and their holdings provide solid underlying support for the market.
The core long-term narrative of the HODL Wave chart is the continuous maturation of supply. Over time, new supply (warm colors) ages (turns to cool colors) and is absorbed by more committed holders.
Although the current consolidation period puts pressure on short-term holders, it also provides a time window for more bitcoins to transfer from short-term holders to medium- and long-term holders, which is conducive to healthier rises in the future.
(The following figure shows the structural impact of ETFs)

Although ETF flows have weakened recently, the current slowdown in flows can be seen as normalization after the initial frenzy and a response to current macro uncertainties.
As long as the macro environment improves or new catalysts emerge in the market, the ETF channel may become an important source of incremental funds again at any time.
Its very existence enhances Bitcoin’s maturity and long-term appeal as an asset class.
(Picture below: Illiquid long-term whales)

The Illiquidity Supply Shock Ratio (ISSR) shows clear cyclicality. Historically, sustained ISSR increases (rising orange line, positive blue area) tend to be accompanied by the accumulation phase of bull markets.
The current plateau period shows that the strong momentum for hoarding coins remains strong.
(The following figure shows the exchange status of large whales)

Divergence is increasing, not one-way selling:
Currently, net inflows and net outflows coexist, which reflects the differences and complex operations among current large players (whales) better than one-way flows.
On the one hand, some early profiteers or whales who are worried about the macro situation are taking advantage of the rebound to transfer tokens to exchanges (net inflows), exerting selling pressure.
On the other hand, there are also whales who actively withdraw coins from exchanges (net outflow) when prices fall back, which is generally regarded as long-term bullish and hoarding behavior.
This state of disagreement may continue for some time.
The clarification of the medium-term trend requires observing which force is dominant: whether continued net inflows suppress prices, or whether net outflows begin to dominate, indicating that large players have begun to accumulate on a large scale again.
Of course, even if there is a short-term sell-off, the behavior of whales to accumulate (net outflow) at key support levels or when they believe that the value is undervalued is an important prerequisite for the market to bottom out and start the next round of big gains.
Outlook:
On-chain data paints a picture of short-term volatility, mid-term key, and long-term structural bullishness:
Short-term: The market is in a digestion period, ETF momentum is weakening, and the divergence of behavior among large players has led to a seesaw between long and short positions. Prices may continue to fluctuate or face the risk of a correction. We need to pay attention to changes in the macro environment and marginal improvements in on-chain supply and demand indicators.
Medium term: Whether the market can resume its upward trend depends on:
Whether the macroeconomic environment has turned favorable (such as interest rate cuts);
Whether ETF fund flows can resume sustained net inflows;
Whether large players have shifted from divergence to net accumulation (continuous net outflows from exchanges);
Whether illiquid whales are growing again;
During the HODL wave, the supply can further mature and the pressure on short-term holders can be released.
Therefore, although there are challenges and volatility in the short term, from a medium- to long-term perspective, as long as the core on-chain structure (such as LTH holdings and supply maturity) is not destroyed and new demand drivers (which may come from macro improvements, continued adoption of ETFs, or new market narratives) emerge, the crypto market (especially Bitcoin) still has the potential to continue to grow.
Mid-term exploration
Whale comprehensive score
Short-term profit percentage compounding model
VDD
Analysis of price structure
Positive sentiment on the Internet
(The following figure shows the comprehensive score of the whale)

Whales have been participating extensively in the market recently and are currently an important holding group in the market.
(The figure below shows the short-term profit percentage compound model)

The short-term profit structure remains relatively healthy, and there is no sign of excessive profits in a stock environment (i.e. the green selling pressure zone).
Perhaps the current participants' problem lies in the overall switching between positive and negative states.
The relatively neutral, tight macroeconomic environment is also constantly pushing the choice boundaries of market participants.
(VDD in the figure below)

It is still a relatively cost-effective holding area.
The selling pressure from high-weight selling entities is still shrinking within the designated area.
It is possible that as the pricing model is gradually repaired on the market, deleveraging activities will no longer occur frequently.
This would be a relatively good holding position.
(The figure below shows the price structure analysis)

In the short term, it has gradually moved away from the oversold price (79,000), but the main problem in the market at present is not selling pressure.
Rather, it is the continued strength of purchasing power and the extent of liquidity recovery.
(Figure below: Network sentiment positivity)

Online sentiment fluctuates between positive and negative.
Perhaps in the tense gaming environment, the participants in the field are also wavering as a whole.
Perhaps from the perspective of liquidity, the direction of overall consistency has not yet emerged.
Short-term observation
Derivatives Risk Factor
Option intention transaction ratio
Derivatives Trading Volume
Option Implied Volatility
Profit and loss transfer
New addresses and active addresses
Net Position of Bingtang Orange Exchange
Net position of the Auntie Exchange
High-weight selling pressure
Global purchasing power status
Stablecoin exchange net positions
Off-chain exchange data
Derivatives rating: The risk factor is in the red zone, and the risk of derivatives is increasing.
(The figure below shows the risk factor of derivatives)

After a rapid decline last week, the market rebounded again and the risk factor has returned to the red zone. As market sentiment has not yet fully recovered, it is expected that there will be a high probability of a "double explosion" in derivatives this week.
(The figure below shows the option intention transaction ratio)

Both the put option ratio and trading volume have declined, and the current put option ratio is still high.
(Figure below shows derivatives trading volume)

Derivatives trading volume fell back to a relatively low level, but the derivatives market is destined not to be calm this week.
(The figure below shows the implied volatility of options)
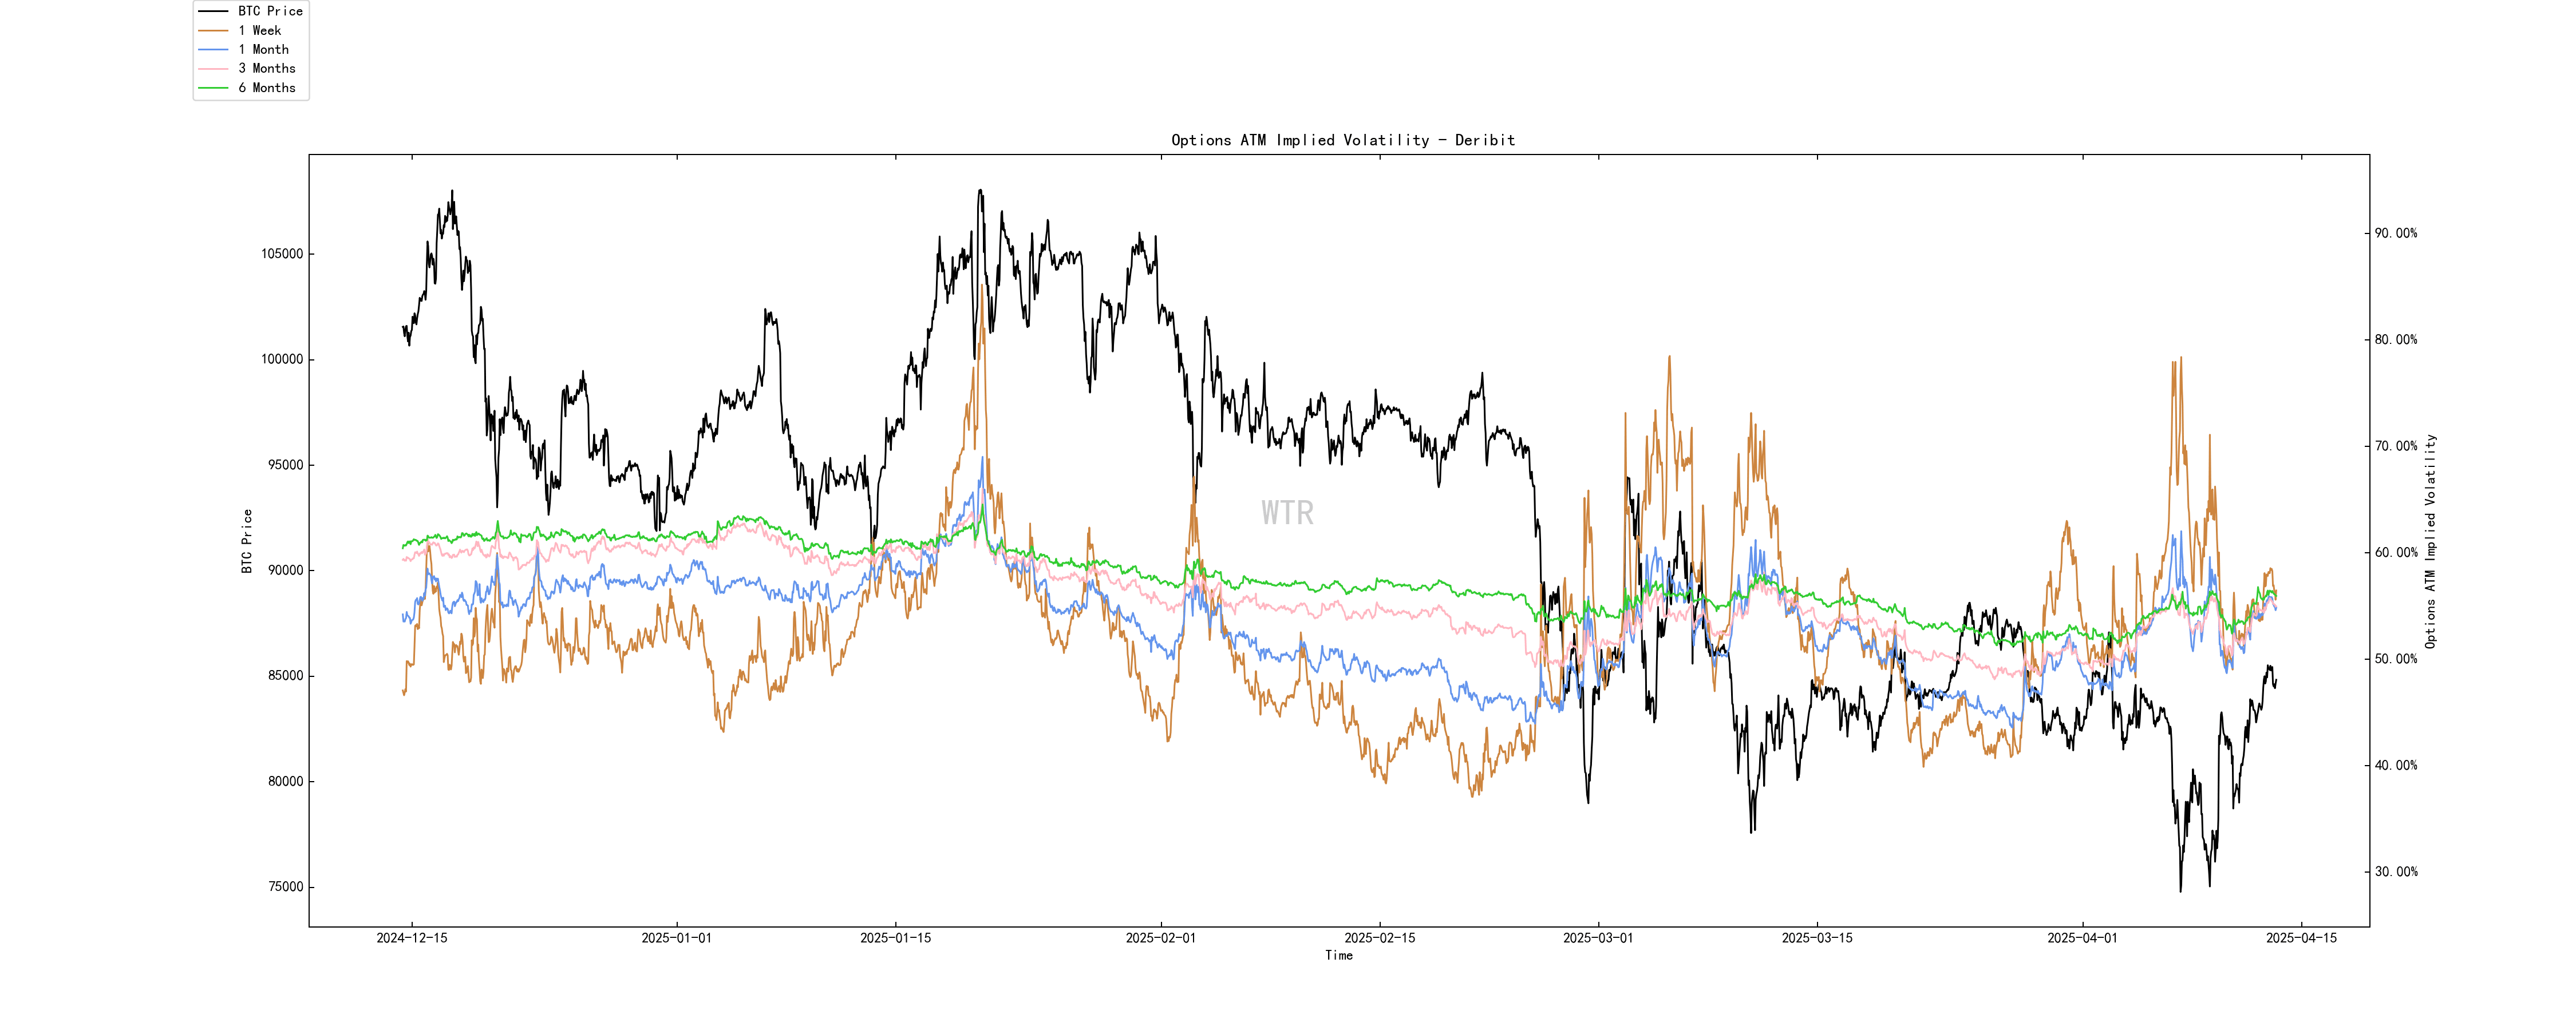
Option implied volatility fluctuates rapidly in the short term.
Emotional state rating: Neutral
(The following figure shows the amount of profit and loss transfer)

Last week we mentioned that if the orange line (panic selling) touches the peak of the stage again, it would be a relatively good bottom-picking trading range.
This week, both market panic and positive sentiment fell again. It is expected that even if there is a rebound in the future, the short-term space will be limited.
(Figure below shows newly added addresses and active addresses)

The number of newly added active addresses is at a medium-low level.
Spot and selling pressure structure rating: Both BTC and ETH have large outflows.
(Figure below: Net position of Bingtang Orange Exchange)

There is currently a large outflow of BTC.
(The following figure shows the net position of E-Tai Exchange)

There is currently a large outflow of ETH.
(Figure below shows high-weight selling pressure)

High-weight selling pressure has eased.
Purchasing power rating: Global purchasing power is recovering slightly, and the purchasing power of stablecoins has recovered slightly.
(Figure below shows the global purchasing power status)

Global purchasing power has now ended its downward trend and is showing a very slight recovery.
(The following figure shows the net position of USDT exchanges)

The purchasing power of stablecoins has recovered slightly.
Off-chain transaction data rating: There is a willingness to buy at 75,000; there is a willingness to sell at 90,000.
(The following figure shows Coinbase off-chain data)

There is willingness to buy at a price around 70,000~75,000;
There is a willingness to sell at prices around 90,000.
(Binance off-chain data in the figure below)

There is willingness to buy at a price around 70,000~75,000;
There is a willingness to sell at prices around 90,000.
(Bitfinex off-chain data in the figure below)

There is a willingness to buy at a price around 76,000;
This week’s summary:

Summary of news:
The current market landscape is a mix of severe macroeconomic uncertainty and structural developments within crypto assets.
The U.S. economy is facing a tug-of-war between recession concerns (Fink's warning, rising unemployment expectations) and potential inflationary pressures (tariff impacts, previous inflation data), resulting in high uncertainty in the Federal Reserve's interest rate policy path, which has become the core focus of the market.
Significant volatility in the U.S. Treasury market (Dimon warning, recent sell-off) and erratic tariff policy have further exacerbated market confidence in the economy and policies, pushing up safe-haven assets (gold to a record) and suppressing risk appetite.
In this context, the crypto asset market, although under pressure at the same time, has shown internal resilience:
The US regulatory environment is becoming clearer (Structural Bill and Stablecoin Bill are being promoted), institutions continue to enter the market (BlackRock Fund Growth, MicroStrategy and others increase holdings), simple indicators (on-chain data) suggest a potential bottom, and the stablecoin ecosystem remains active.
Looking ahead, the direction of crypto assets will be highly dependent on the evolution of the macro environment:
If the economic slowdown prompts the Federal Reserve to cut interest rates and release liquidity, and regulation continues to advance, the crypto market is expected to benefit from the recovery of risk appetite and the potential "digital gold" narrative;
Conversely, if stubborn inflation or a severe recession leads to continued deflation or extreme risk aversion, the crypto market faces significant downside risk.
Therefore, although the fundamentals of the crypto industry itself are improving, its performance in the short term will still be closely linked to macroeconomic trends and Federal Reserve policies, and high market volatility is expected to continue.
On-chain long-term insights:
The growth rate of illiquid supply has slowed down significantly recently, indicating that the marginal accumulation momentum of long-term whales has weakened at high levels;
Although the long-term holder base is stable, the supply aging rate has slowed down and the proportion of short-term holders is high, and the market has entered a period of structural adjustment;
The large amount of capital flows on the exchange showed a significant two-way tug-of-war, reflecting that large holders have obvious differences and games at the current price;
The selling pressure driven by outflows from the U.S. Bitcoin spot ETF has weakened, and has even turned into an unstable coexistence of inflows and outflows recently, indicating that selling and demand coexist.
Market setting:
Selling pressure exists alongside buying demand.
The current market is in a critical stage of consolidation at high levels, with bulls and bears competing fiercely around key prices.
Therefore, in the short term, the market may continue to fluctuate and adjust, and the future direction is highly dependent on the clarification of macroeconomic signals and the emergence of new demand catalysts.
On-chain mid-term exploration:
Whales have become an important market holding group.
Short-term profits are healthy and sentiment is shifting.
The current price is cost-effective to hold and the selling pressure is shrinking.
It is currently out of the oversold price (79,000) and the purchasing power needs to be improved.
Market sentiment is wavering and the direction of liquidity is unclear.
Market setting:
Wandering
The market has large group support, but it is still hesitating as a whole, and the mood is wavering. The judgment that it may be relatively volatile is in line with the current tone.
On-chain short-term observations:
The risk factor is in the red zone and the risk of derivatives increases.
The number of newly added active addresses is at a relatively low level.
Market sentiment status rating: Neutral.
The overall net position of the exchange shows that both BTC and ETH have large outflows.
Global purchasing power is recovering slightly, and the purchasing power of stablecoins is also recovering slightly.
Off-chain transaction data shows that there is a willingness to buy at 75,000 and a willingness to sell at 90,000.
The probability that it will not fall below 70,000-75,000 in the short term is 70%; the probability that it will not rise below 85,000-90,000 in the short term is 80%.
Market setting:
For BTC, the short-term market is quite "calm". Even in the face of large fluctuations, there is no real panic selling. In the short term, it is expected that the derivatives market may experience large fluctuations this week, and even if the price rebounds, it will be suppressed by the short-term holders' cost line (92k).
Risk Warning:
The above are all market discussions and explorations and do not provide any directional opinions on investment; please be cautious about and prevent market black swan risks.
This report is provided by the "WTR" Research Institute.
Welcome to follow us!

