
"Gazing at endless frontier technology; insights into the future, leading a new era of investment research." This report is provided by the 'WTR' research institute:Member Twitter IDs: Golden Egg Diary @jindanriji; Elk @crypto_elk_; Forex Brother; Xibei @Asterismone;
WTR's on-chain data subscription for the first round (OG) is officially launched!Data provided: WTR self-developed short-term, mid-term, and long-term on-chain data, as well as some small coin data. First round pricing: 399U/year. Payment supports both on-chain and off-chain transfers. Other notes: We have prepared a strategy package for OG users, with limited slots, and the current strategy package is only open to the first round of OG users. Subscriptions can directly add OG user groups, for details see X.

Weekly review
From March 17 to March 24 this week, the highest for Ice Sugar Orange was nearly $88765, the lowest close to $81134, with a fluctuation range of about 9.41%.
Observing the chip distribution chart, there are a large number of chips traded around approximately 78557, which will provide certain support or pressure.

Analysis:
60000-68000 approximately 1.59 million pieces;
90000-100000 approximately 2.12 million pieces;
In the short term, there is a 60% probability that it will not break below 75000~79000;
There is a 60% probability that it will not break above 92000~87000 in the short term.
Important news aspect
Economic news aspect
The Federal Reserve announced a slowdown in quantitative tightening (QT) in April, interpreted as a signal of indirect easing, and Powell's dovish remarks alleviated market tension.
The probability that the Federal Reserve will maintain interest rates unchanged until June is only 18.1%, while the cumulative probability of a rate cut of 25-50 basis points is 81.9%.
The Federal Reserve's operating loss for the entire year of 2024 reached $77.6 billion, marking a huge loss for the second consecutive year, primarily due to aggressive rate hikes from 2022 to 2023; when it can return to profitability depends on its subsequent rate cut path.
Williams stated that there are no signs indicating that inflation expectations are losing stability, and that the recent rise in inflation will dissipate.
Goolsbee indicated that an economic slowdown will be the reason for rate cuts, but if inflation exceeds tariff levels or expectations, the Federal Reserve will have to adjust its outlook.
This Friday, the PCE price index will be announced, with the previous value at 2.5% and the expected value at 2.5%; the core PCE price index's previous value was 2.6% and the expected value is 2.7%.
On Monday, US stock index opened, with Nasdaq rising 2% during the session, S&P 500 rising 1.4%, and Dow Jones rising 1%.
Trump's statement on tariff flexibility boosted market confidence while indicating a more targeted approach to tariffs.
The tariff escalation effective April 2 may put pressure on risk assets again.
News in the crypto ecosystem
Last week, the net inflow of digital asset investment products was $644 million, ending five consecutive weeks of net outflows, with BTC leading the recovery and attracting $724 million in inflows, while ETH saw an outflow of $86 million.
Last Saturday, the ETH network only destroyed 53.07 ETH in a single day, setting a historical low, indicating a significant decrease in demand for ETH block space.
On March 24, the cryptocurrency fear and greed index was at 45 (the previous day was 30), indicating a significant alleviation of market fear.
Arthur Hayes, co-founder of BitMEX, stated that BTC will first break through $110,000 before retesting $76,500.
ARK Invest founder Cathie Wood is optimistic about cryptocurrencies and has recently been buying the dip on Tesla, Coinbase, and Robinhood, which are related to cryptocurrencies.
Last week, among the top 70 companies holding BTC, 5 companies increased their holdings by 7349 BTC, with Strategy increasing by 6911 BTC.
IntoTheBlock reported that BTC price is rebounding, but short-term holders have not yet returned, with the current number of short-term holders at only 2.53 million, down from 3.06 million in January.
Matrixport analysis states that BTC is attempting to break through the downward trend.
QCP stated that US stock indices are leading a moderate recovery in the cryptocurrency market.
The International Monetary Fund (IMF) released the seventh edition of the Balance of Payments Manual (BPM7) on March 20, incorporating cryptocurrencies and other digital assets into the framework of global economic reports for the first time.
The IMF classifies cryptocurrencies: BTC and other unbacked assets are classified as non-productive non-financial assets; stablecoins supported by liabilities are viewed as financial instruments; platform tokens like ETH and SOL may be classified as quasi-equity instruments.
Fidelity is launching a tokenized fund to invest in US Treasury bonds, competing with BlackRock's BUIDL.
Long-term insights: used to observe our long-term situation; bull market/bear market/structural changes/neutral state
Mid-term exploration: used to analyze what stage we are currently in, how long this stage will last, and what situations we will face.
Short-term observation: used to analyze short-term market conditions; as well as the possibility of certain events occurring under certain premises and directions.
Long-term insights
Large fund flows to exchanges
ETF fund flow status
Short-term holder status
Long-term holder status
Market chip distribution structure
(Below is the flow of large funds to exchanges)

There is a continuous net outflow trend, with large funds (>10 million USD) significantly transferring from exchanges to cold wallets.
Recently, the single-day net outflow volume reached a slightly larger scale, exceeding the normal fluctuation range.
This may indicate that the frequency of large holder or institutional activities has increased, showing counter-trend accumulation behavior during corrections.
Large holders are slowly absorbing chips from the circulating market, viewing the downturn as a strategic buying opportunity.
(Below is the ETF fund flow status)

The overall trend shows a 'stabilizing amid fluctuations', with the speed of cumulative net inflow significantly slowing compared to the beginning of the year, but still maintaining a positive direction.
Institutional funds show a clear 'timing' characteristic, increasing allocation efforts after price adjustments.
Institutional investors may have differing views on the range, but no systemic selling has occurred.
This divergent liquidity pattern usually occurs during major cycle shifts, indicating that the market is transitioning from the 'chasing new highs' phase to the 'value assessment' phase.
Total holdings of ETFs are still increasing, providing long-term support for prices.
(Below is the short-term holder status)

The short-term average cost is at a historical high, approximately $93,490, above the current market price.
The speed of new short-term speculators entering the market has significantly slowed.
Short-term speculators may be experiencing a 'trapped-stop loss' cycle, with insufficient buying momentum in the short term.
High-cost chips trapped create psychological pressure.
It appears that speculative funds are exiting the market, transitioning from fragility to health.
(Below is the long-term holder status)

The average cost of long-term investors is steadily increasing, with total holdings starting to slightly increase during the pullback, showing typical counter-cyclical accumulation characteristics.
The diamond hand index (proportion of holding for more than one year) is still relatively high.
Long-term investors remain confident in the current fundamentals, believing that the current price level is relatively healthy.
This strong 'holding' behavior provides structural support for the market, reducing the likelihood of sharp declines.
The status of long-term holders remains stable, with no systemic selling pressure.
(Below is the market chip distribution structure)

Currently forming three distinct dense chip areas:
65,000 USD area (historical accumulation zone);
80,000 USD area (current support zone);
90-100,000 USD area (new high-density chip zone).
The Unspent Profit and Loss Ratio (NUPL) is in a healthy range.
A new consensus price range is forming between buyers and sellers.
The market has formed a clear support and resistance structure, with $80,000 serving as a psychological barrier with dual significance.
The chip structure shows that there are no excessively concentrated trapped chips in a single price range, reducing the risk of a sell-off.
The newly formed 90-100,000 USD chip dense zone will become a key resistance level for future breakthroughs and needs to be closely monitored.
Mid-term exploration
Long-term and short-term participants hold supply volume
Comprehensive score of USDC purchasing power
Comprehensive score of whales
Net positions of ETH exchanges trends
Net positions of BTC exchanges trends
(Below is the supply volume held by long-term and short-term participants)

The overall market style has switched.
There has been a certain amount of withdrawal of liquidity from short-term participants, currently reverting to the accumulation phase of long-term participants.
As the market slowly walks, it may be accompanied by continuous adjustments and declines.
Currently, during the stage of withdrawal of new liquidity from the market, in the game of existing structure, the market may be anchored within a designated range, and when sentiment is pressed to a certain extent, it will test the support of key positions.
(Below is the comprehensive score of USDC purchasing power)

The rating of USDC has recovered to a very high level.
Usually represents that the internal funds within the market have relatively strong buying intentions.
(Below is the comprehensive score of whales)

The purchasing power of whales has somewhat recovered, indicating that this bottom area still holds high appeal for whales.
(Below is the trend of ETH exchange net positions)

ETH has resumed its accumulation rhythm, and compared to the previous structurally selling phase, the current selling force is gradually weakening.
(Below is the net position trend of BTC exchanges)

The accumulation of BTC is also progressing slowly, possibly easing the potential pressure in the market.
Short-term observation
Derivatives risk coefficient
Options intention transaction ratio
Derivatives trading volume
Implied volatility of options
Profit and loss transfer volume
New addresses and active addresses
Net position of Ice Sugar Orange exchange
Net position of Auntie exchange
High-weight selling pressure
Global purchasing power status
Stablecoin exchange net position
Off-chain exchange data
Derivatives rating: Risk coefficient is in the red zone, indicating increased derivative risk.
(Below is the derivatives risk coefficient)

BTC price has seen a slight rebound, but the risk coefficient has reached the red zone, and the potential for sustained rebounds may not be great, while derivative risks continue to increase.
(Below is the options intention transaction ratio)
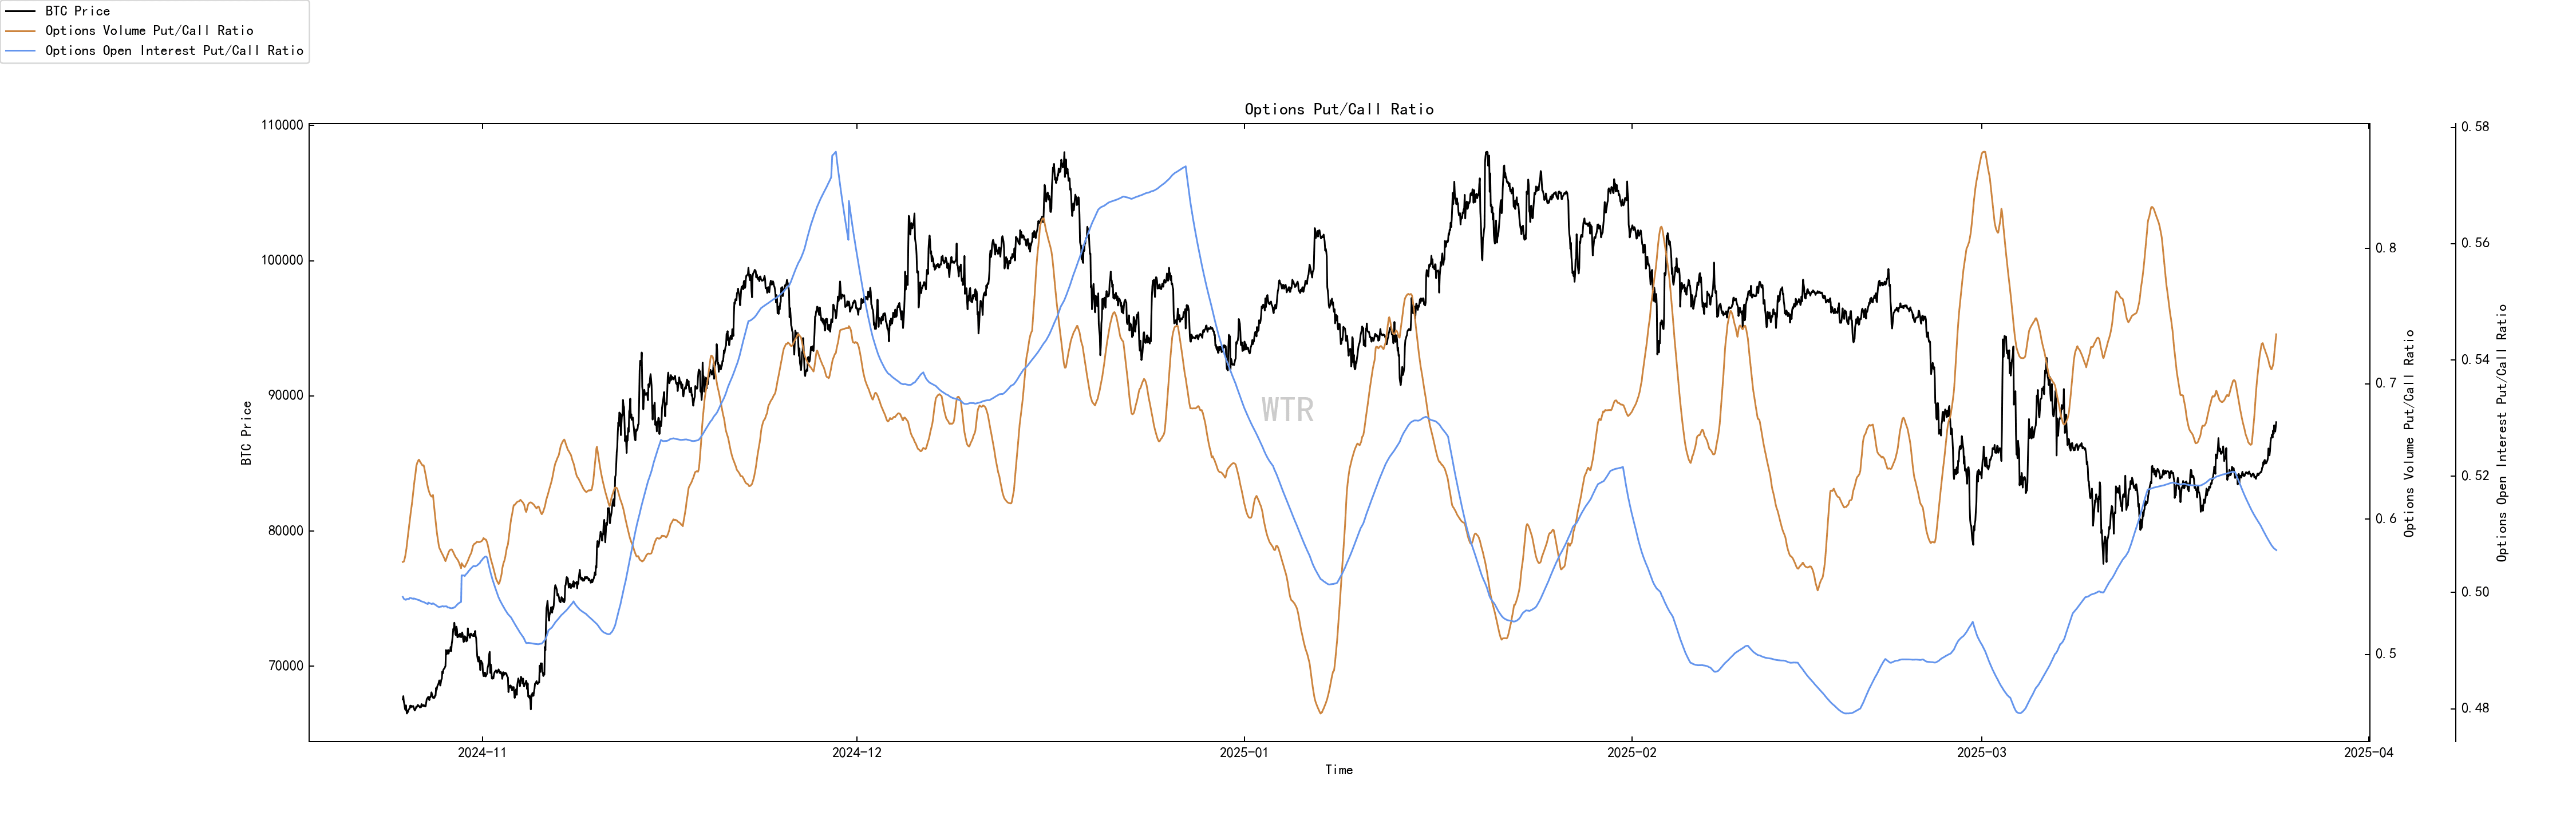
The ratio and volume of put options are both at the median.
(Below is the derivatives trading volume)

Derivatives trading volume is at a low level.
(Below is the implied volatility of options)

Implied volatility of options has rapid fluctuations in the short term.
Emotional state rating: Neutral
(Below is the profit and loss transfer volume)
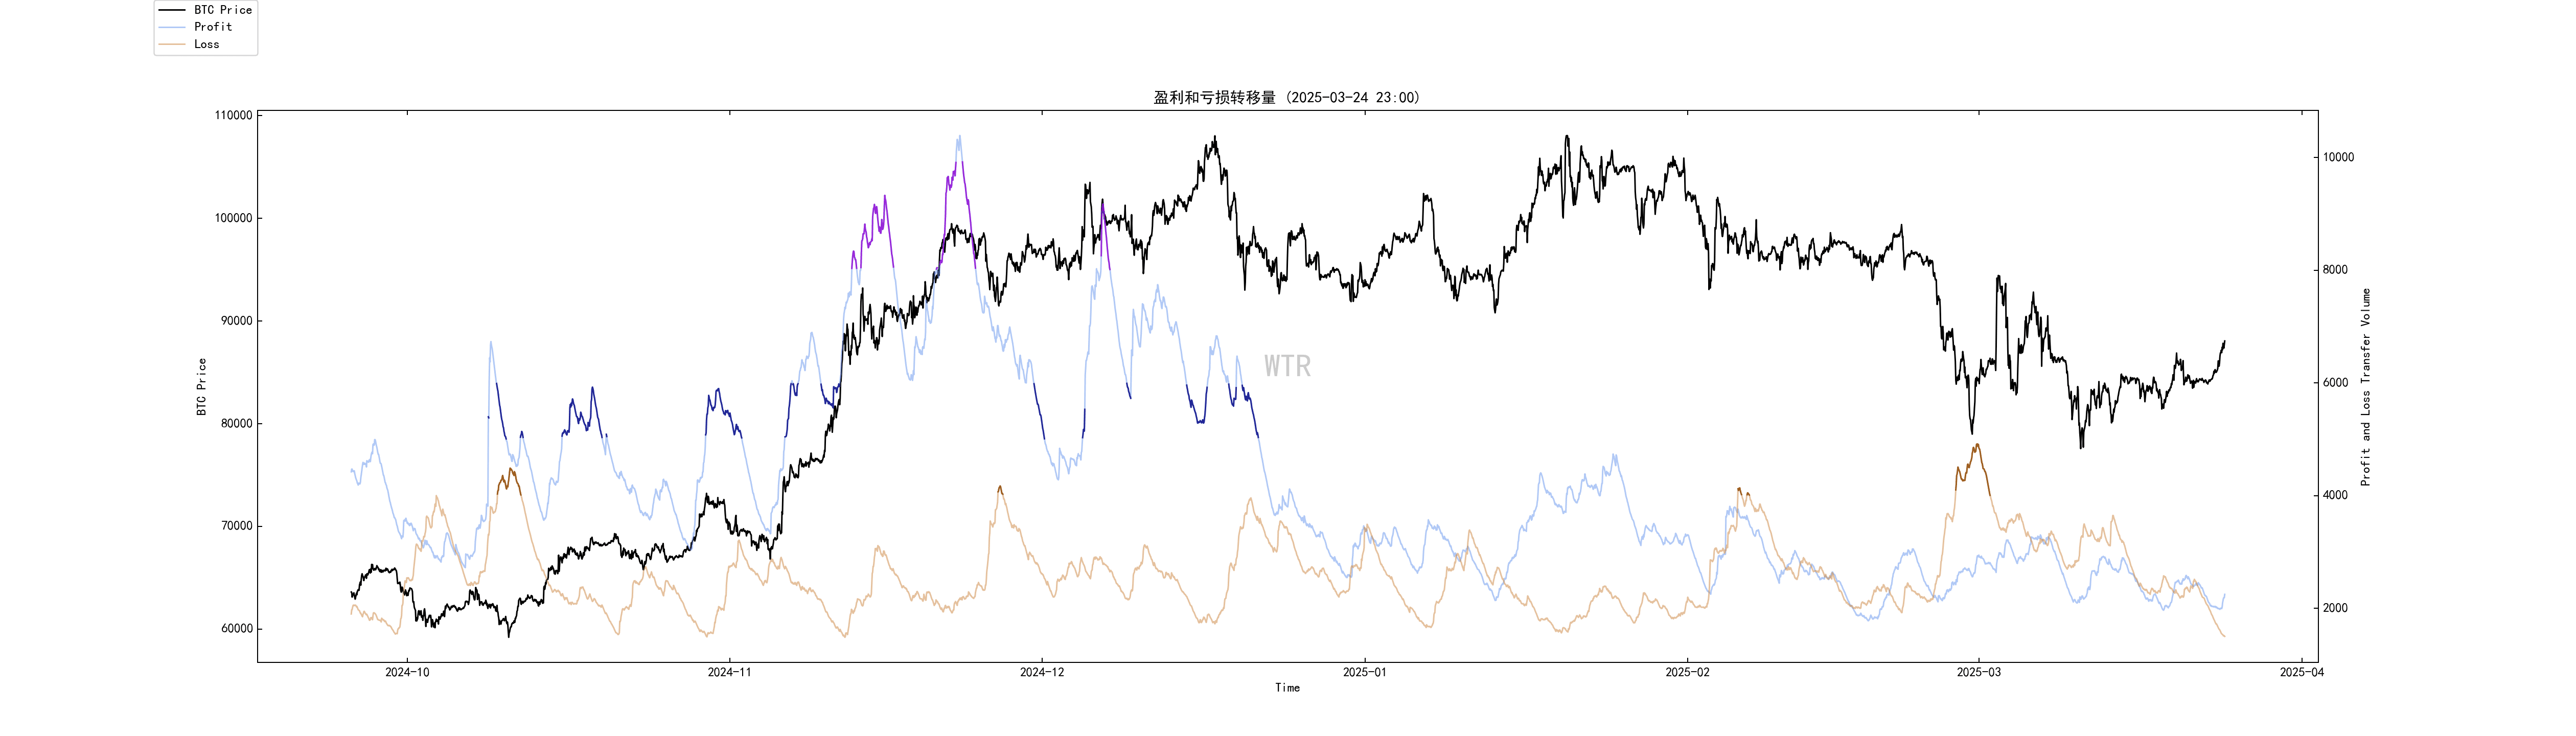
The following is only for BTC. Both the market's positive and panic sentiments are at low levels, and in the absence of purchasing power, expectations lean towards fluctuations.
(Below is the number of new addresses and active addresses)

The number of new active addresses is at a low to medium level.
Spot and selling pressure structure rating: BTC is in a state of large outflow accumulation, while ETH has a significant outflow.
(Below is the net position of Ice Sugar Orange exchange)

BTC is in a state of large outflow accumulation.
(Below is the net position of E-tai exchange)

There is a significant outflow of ETH.
(Below is the high-weight selling pressure)

Currently, there is no high-weight selling pressure participating.
Purchasing power rating: Global purchasing power is in a state of loss, with stablecoin purchasing power slightly decreasing.
(Below is the global purchasing power status)

Current purchasing power is in a state of loss.
(Below is the net position of USDT exchanges)

Stablecoin purchasing power slightly decreases.
Off-chain trading data rating: willingness to buy at 80000; willingness to sell at 90000.
(Below is the off-chain data of Coinbase)

There is a willingness to buy around the price range of 70000~80000;
There is a willingness to sell around the price range of 90000,95000.
(Below is the off-chain data of Binance)

There is a willingness to buy around the price range of 70000~80000;
There is a willingness to sell around the price range of 90000,95000.
(Below is the off-chain data of Bitfinex)

There is a willingness to buy around the price range of 75000;
There is a willingness to sell around the price range of 90000,95000.
Weekly summary:

Summary of the news:
Overall, the Federal Reserve's slowdown in quantitative tightening and Powell's dovish remarks convey easing signals, improving sentiment in the cryptocurrency market, specifically reflected in the rise of the fear index, BTC price rising to $88,000, and digital asset products turning from consecutive net outflows to net inflows of $644 million.
At the same time, BTC and ETH show a phenomenon of capital differentiation: BTC absorbs a large amount of inflows, while ETH sees net outflows and a decline in network activity, although price performance remains relatively strong; this divergence in fundamentals and price performance for ETH is worth noting.
Institutional funds have significantly entered (e.g., net purchases of BTC ETF, large corporate increases), shifting the overall market from retail-dominated to institution-dominated, but the decrease in the number of short-term holders may limit the potential for an accelerated upward momentum.
In terms of regulation, the IMF has classified crypto assets, categorizing BTC as a non-productive non-financial asset, while ETH and other platform coins may be classified as quasi-equity instruments, and stablecoins are viewed as financial instruments, providing new opportunities for establishing regulatory frameworks and integrating traditional finance with the crypto market.
In the short term, PCE price data and tariff escalations are key risks, but if the Federal Reserve cuts rates in June, BTC is expected to operate along the anticipated path;
In the long term, the crypto market will further integrate into the traditional financial system, and how the extent of rate cuts is realized and the clarity of future regulations will determine the upward space for risk assets.
On-chain long-term insights:
Large funds continue to flow from exchanges to cold wallets, demonstrating strategic accumulation behavior, viewing the current pullback as a buying opportunity.
Institutional fund inflows show some fluctuations but overall maintain a positive direction, exhibiting mature 'timing' characteristics, as the market transitions from 'chasing highs' to 'value assessment' phase.
Short-term speculators have an average cost higher than the current price, indicating a state of being trapped, and speculative funds are exiting the market, laying the foundation for a healthier structure.
Long-term investors exhibit accumulation characteristics, maintaining confidence in the market and providing strong structural support.
The on-chain chip distribution has formed three clear dense chip areas (65,000, 80,000, and 90-100,000), creating multiple support structures, with little risk of a cascading sell-off triggered by a downward breach.
Market positioning:
The market is currently in a high-level consolidation phase rather than a systemic decline, with large holders and institutions accumulating during the pullback, while short-term speculators exit without triggering panic.
The market is transitioning from 'euphoria' to 'reassessing rationally', with the $80,000 area becoming a key support, and the chip structure showing multi-layered support, gradually shifting towards health.
On-chain mid-term exploration:
Long-term participants are resuming accumulation, while short-term participants are reducing liquidity;
The purchasing power ratings of USDC and whales have recovered, possibly attracting key existing large groups at the current price;
ETH has resumed accumulation, with structural selling pressure decreasing;
BTC is still slowly accumulating.
Market positioning:
Stock, accumulation
New supply in the market decreases, but the existing stock remains in accumulation.
On-chain short-term observation:
The risk coefficient is in the red zone, indicating increased derivative risk.
The number of new active addresses is at a low to medium level.
Market emotional state rating: Neutral.
The net position of exchanges overall shows that BTC is in a state of large outflow accumulation, while ETH has a significant outflow.
Global purchasing power is in a state of loss, with stablecoin purchasing power slightly decreasing.
Off-chain trading data shows a willingness to buy at 80000; a willingness to sell at 90000.
In the short term, there is a 60% probability that it will not break below 75000~79000; among which, there is a 60% probability that it will not break above 92000~87000.
Market positioning:
The short-term market is neutral, trapped in a boring low turnover stage. Consistent with last week, both profit and loss chips choose to hold at the current price level, while some purchasing power chooses to accumulate chips at the current price, achieving a short-term balance point. Short-term expectations remain primarily focused on range fluctuations.
Risk warning:
The above are market discussions and explorations, and do not constitute directional opinions on investment; please be cautious and prevent market black swan risks.
This report is provided by the 'WTR' research institute.
Welcome to follow us!
