
"Overlook endless frontier technology; gain insights into the future, leading a new era of investment research." This report is provided by the 'WTR' research institute:Member Twitter IDs: Golden Egg Diary @jindanriji; Moose won't get lost @crypto_elk_; Forex Brother; Xibei @Asterismone;
WTR on-chain data subscription round one (OG) is officially open!Data provided: WTR's self-developed market short-term, mid-term, and long-term on-chain data, as well as data for some altcoins. First-round pricing: 399U/year. Payment supports on-chain and off-chain transfers. Other notes: We have prepared a strategy package for OG users; the package has limited spots and is currently only open to the first round of OG users. Subscriptions can directly add OG user group; details can be found on Twitter.

Weekly review
From March 10 to March 17 this week, ice sugar orange reached a maximum of $85,309 and a minimum close to $77,459, with a fluctuation range of about 11.36%.
Observing the chip distribution chart, a large volume of transactions occurs around 78,557, which will provide certain support or pressure.

Analysis:
60,000-68,000 approximately 1.63 million coins;
90,000-100,000 approximately 2.18 million coins;
The probability of not breaking below $75,000-$79,000 in the short term is 60%;
Among them, the probability of not breaking above $92,000-$87,000 in the short term is 60%.
In terms of important news
In terms of economic news
This week is a super week for central banks, as the Federal Reserve/Japan/UK/Switzerland/Sweden and other central banks successively announce interest rate decisions.
The Federal Reserve, Bank of Japan, and Bank of England are highly likely to maintain unchanged interest rates.
US retail sales in February rose 0.2%, below the expected 0.6%.
March NY Fed manufacturing index -20, far below the expected -0.75.
US consumer confidence fell to its lowest point in two and a half years in March.
Economists estimate the risk of a recession in the US at 25%, double the normal level.
The US dollar circulation has reached $21.6 trillion, close to the historical high level in April 2022.
US M2 money supply grew 3.9% year-on-year in January, the fastest growth in 30 months.
Capital markets:
The Nasdaq and S&P 500 indices have declined for four consecutive weeks.
The market expects the Federal Reserve to adopt a dovish stance.
UBS raises gold target to $3,200.
In terms of cryptocurrency ecosystem news
On March 17, the cryptocurrency fear and greed index was 32, maintaining a 'fear' state, with an average of 20 last week (extreme fear).
In the past week, BTC whale groups have accumulated over 60,000 BTC.
Net outflows from US spot BTC and ETH ETFs last week were $829.9 million and $189.9 million, respectively.
Important events:
FalconX completes the first large transaction of Solana futures at CME, paving the way for a potential spot ETF.
Circle's Solana chain stablecoin minting volume reached approximately $10 billion in 2025.
The total market value of stablecoins has increased by 0.91% over the past week, reaching $229.334 billion.
Analysts' views:
Analyst Timothy Peterson predicts BTC is likely to challenge $126,000 before June 1.
10x Research believes BTC may replay the 2024 trend, entering a long period of consolidation after hitting new highs.
Bitfinex analysts point out that $72,000 to $73,000 is a key support range for BTC.
Analysts generally believe that BTC's bull market cycle has not yet ended.
The governor of the Bank of France warns that Trump's embrace of cryptocurrencies could trigger another financial crisis.
The Bank of Korea has clearly stated that it has never considered including BTC in its foreign exchange reserves, maintaining a negative stance.
Long-term insights: Used to observe our long-term situation; Bull market/Bear market/Structural changes/Neutral state
Mid-term exploration: Used to analyze what stage we are currently in, how long this stage will last, and what situations we may face.
Short-term observation: Used to analyze short-term market conditions and the possibility of certain events occurring under specific premises.
Long-term insights
On-chain chip distribution
High-weight selling pressure and supply from short-term holders
Cryptocurrency ETF fund flow
Inactive whale groups
(Below chart shows on-chain chip distribution)

The largest chip concentration band is formed in the $80,000-$100,000 range, constituting the current main support level;
Additionally, early chips are concentrated in the $30,000-$60,000 range, representing long-term holders.
The current price has pulled back to the main chip concentration area, indicating that the market is testing support strength;
If the $80,000 support holds, it may complete a new round of buying accumulation and form a basis for an upward move;
(Below chart shows high-weight selling pressure and supply from short-term holders)

Supply from short-term holders (orange area) significantly increased at the beginning of 2025, followed by a slight decline.
High-weight remains at relatively low levels, with no significant selling pressure.
(Below chart shows cryptocurrency ETF fund flows)

In March 2025, there were multiple large-scale net outflows (red bars significantly downward) affecting the price's continued decline.
Recently, the total holdings of ETFs (yellow line) have shown a clear turning point, shifting from decline to a slight increase, indicating that external funds are tentatively buying.
ETF funds are flowing out on a large scale into initial buying, indicating that institutional investors are gradually shifting from profit-taking or risk aversion to initial tentative buying.
Some long-term holders (high-weight investors) are overall stable, with no signs of panic selling.
After the increase in supply from short-term holders, there is a retreat, indicating that retail investors who bought at high levels have partially liquidated during the pullback.
The current price range (around $80,000) corresponds to the average cost area for many retail investors, forming a new psychological support level.
(Below chart shows inactive whale groups)

From this chart, it can be seen that whale behavior remains strong: the activity of large holding addresses has decreased (F1 indicator has risen), indicating that whales are accumulating rather than selling.
The current price pullback is due to short-term speculators realizing profits, not due to whale selling; the underlying holding structure remains robust.
The current phase is different from the top in 2021; the current pattern resembles an accumulation phase. Once short-term selling pressure eases, prices are expected to recover upwards supported by strong supply and demand fundamentals.
In a period of adjustment where institutional profit-taking and retail panic emotions intertwine, but no systemic risk has yet formed.
Currently, the market is in a transition phase from optimism to caution, without reaching the extremely pessimistic range, which is usually characteristic of adjustments rather than trend reversals.
The market seems to be tentatively buying, seemingly searching for a relatively reasonable point to cautiously test.
Mid-term exploration
Liquidity supply volume
Price structure analysis model at various levels
BTC exchange trend net positions
Total stablecoin supply
Net positions of BTC ETF fund inflows and outflows
Overall on-chain chip distribution structure
(Below chart shows liquidity supply volume)
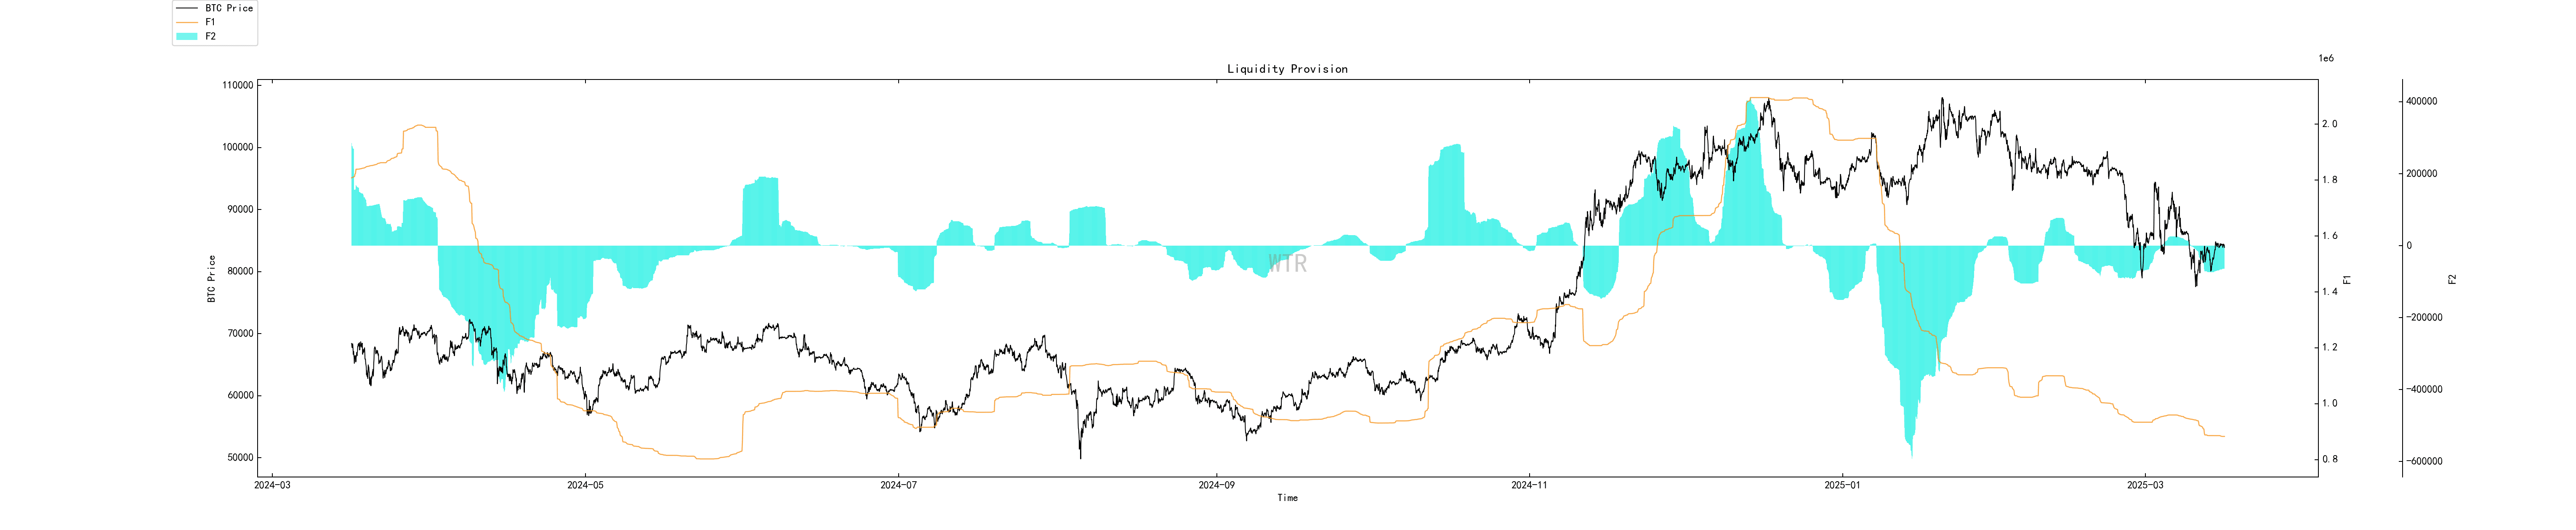
Overall changes in liquidity supply are not significant, with signs of reduced outflow currently.
It may require more time for the market to repair and adjust.
(Below chart shows various price structure analysis models)

BTC is still hovering around the market lower limit of approximately $79,000, with support still present in the market.
This price level can be listed as a key support level; if signs of deep deterioration in the market emerge, defending this price level may become a focal point.
(Below chart shows trend net positions on BTC exchanges)

BTC shows traces of large-scale outflows recently, with significant demand at the critical low level of $79,000.
It is possible that some large funds may purchase cost-effective chips at this price level.
(Below chart shows total stablecoin supply)

The growth rate of stablecoin supply shows slight signs of recovery, possibly indicating a restoration of buying power in the market.
(Below chart shows net positions of BTC ETF fund inflows and outflows)

This data tracks the inflow and outflow of funds in the BTC port, currently showing a gradual reduction in the frequency and magnitude of outflows, with signs of dynamic convergence.
(Below chart shows the overall on-chain chip distribution structure)

Holders around the previous BTC movement at approximately $82,800 show significant accumulation signs.
Additionally, a new chip support band is forming between the price levels of $78,500 and $82,000.
The market may have reached a new bottom consensus, but whether it can hold or emerge from this bottom area requires further judgment based on market liquidity.
Short-term observation
Derivatives risk coefficient
Options intent trading ratio
Derivatives trading volume
Options implied volatility
Profit and loss transfer volume
New addresses and active addresses
Ice sugar orange exchange net position
Auntie exchange net position
High-weight selling pressure
Global purchasing power status
Stablecoin exchange net positions
Off-chain exchange data
Derivatives rating: Risk coefficient in the red zone, increasing derivatives risk.
(Below chart shows derivatives risk coefficient)

Last week, prices reached a short-term bottom, while the risk coefficient also touched green. The current price has seen a slight rebound, but the derivatives coefficient has returned to red. This week, it is expected that prices will continue to fluctuate in a range for derivatives liquidation.
(Below chart shows options intent trading ratio)

The proportion of put options has slightly increased, remains at the median, with trading volume at the median.
(Below chart shows derivatives trading volume)

Derivatives trading volume is at a low level.
(Below chart shows options implied volatility)

Options implied volatility has rapid fluctuations in the short term.
Sentiment state rating: Neutral
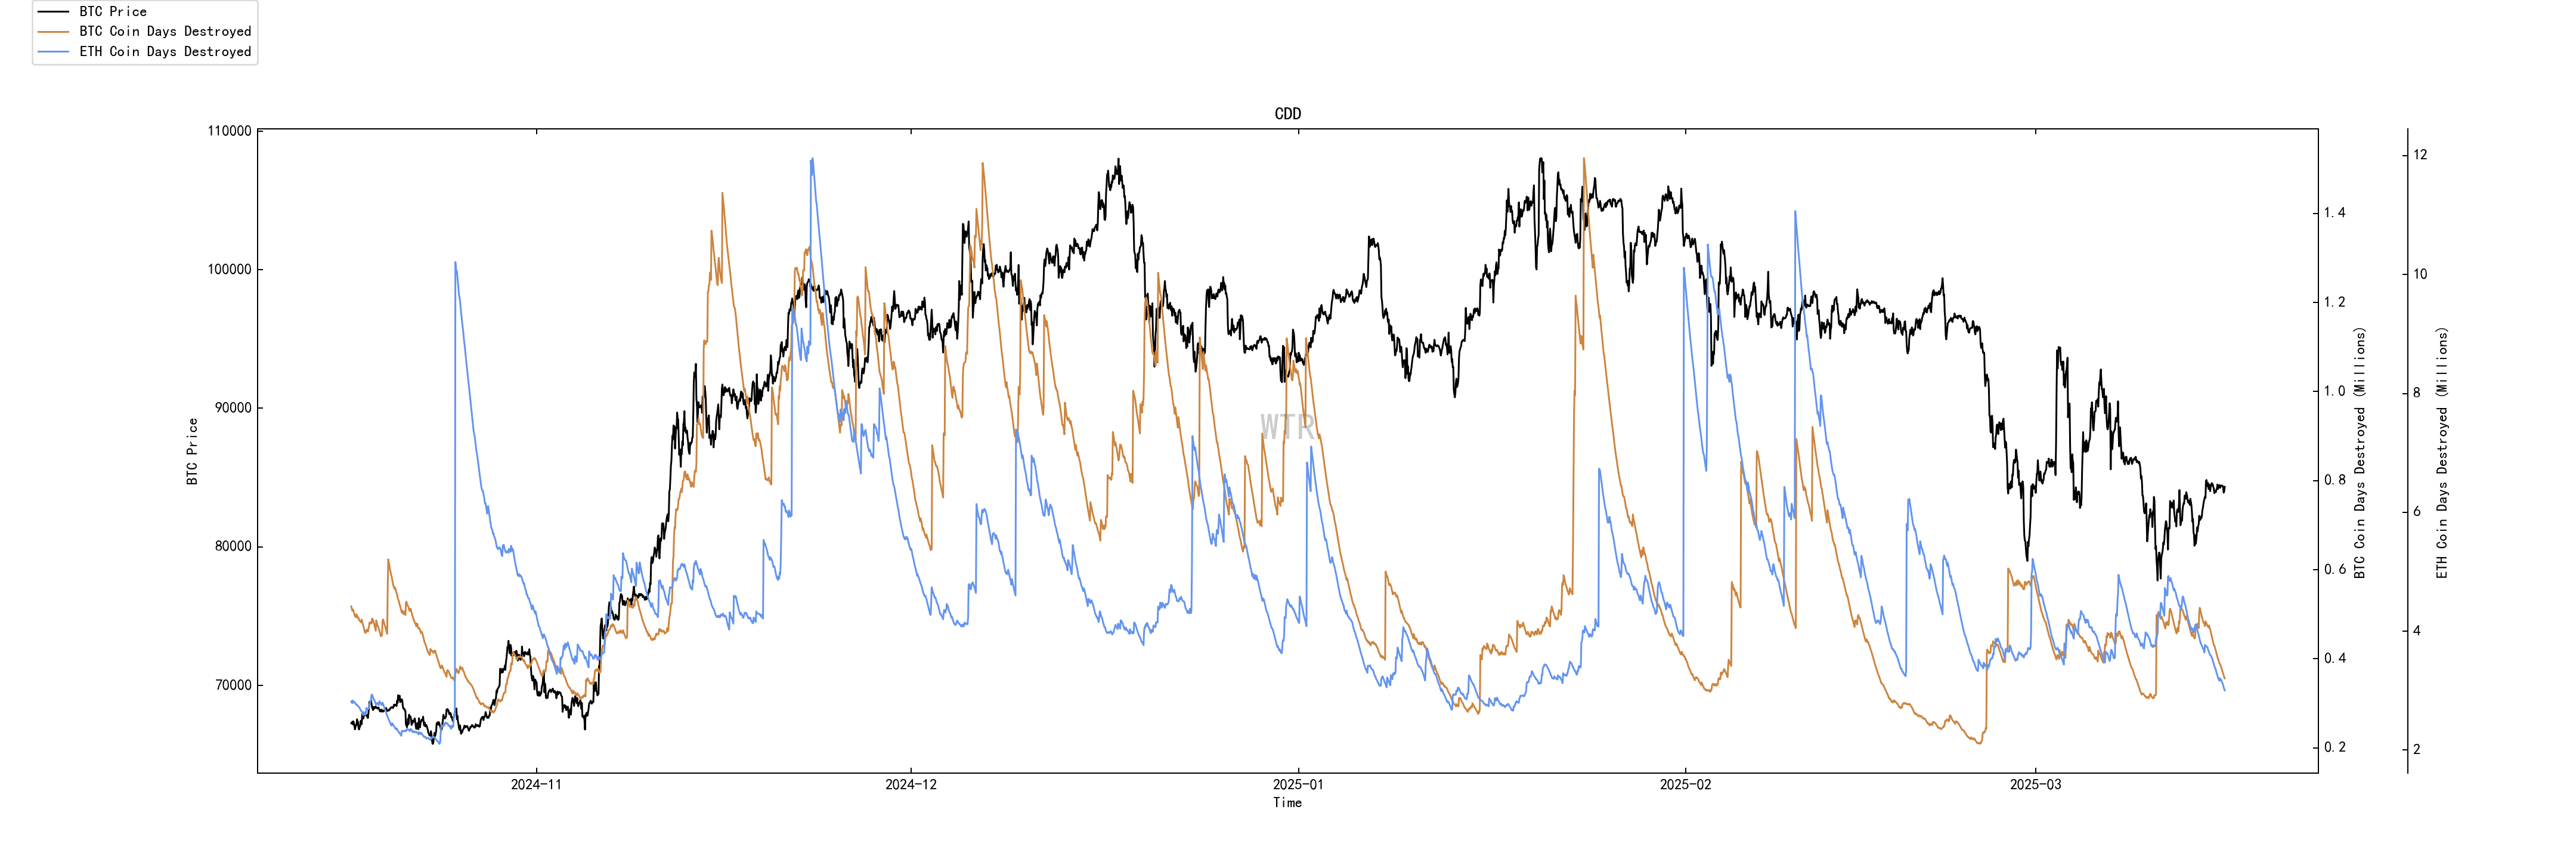
(Below chart shows profit and loss transfer volume)

The following only pertains to BTC. The market's optimism and panic emotions are both at low levels, and lower prices have not yet resulted in substantial panic selling in the market. With the continued lack of purchasing power, expectations lean more towards fluctuations.
(Below chart shows new addresses and active addresses)
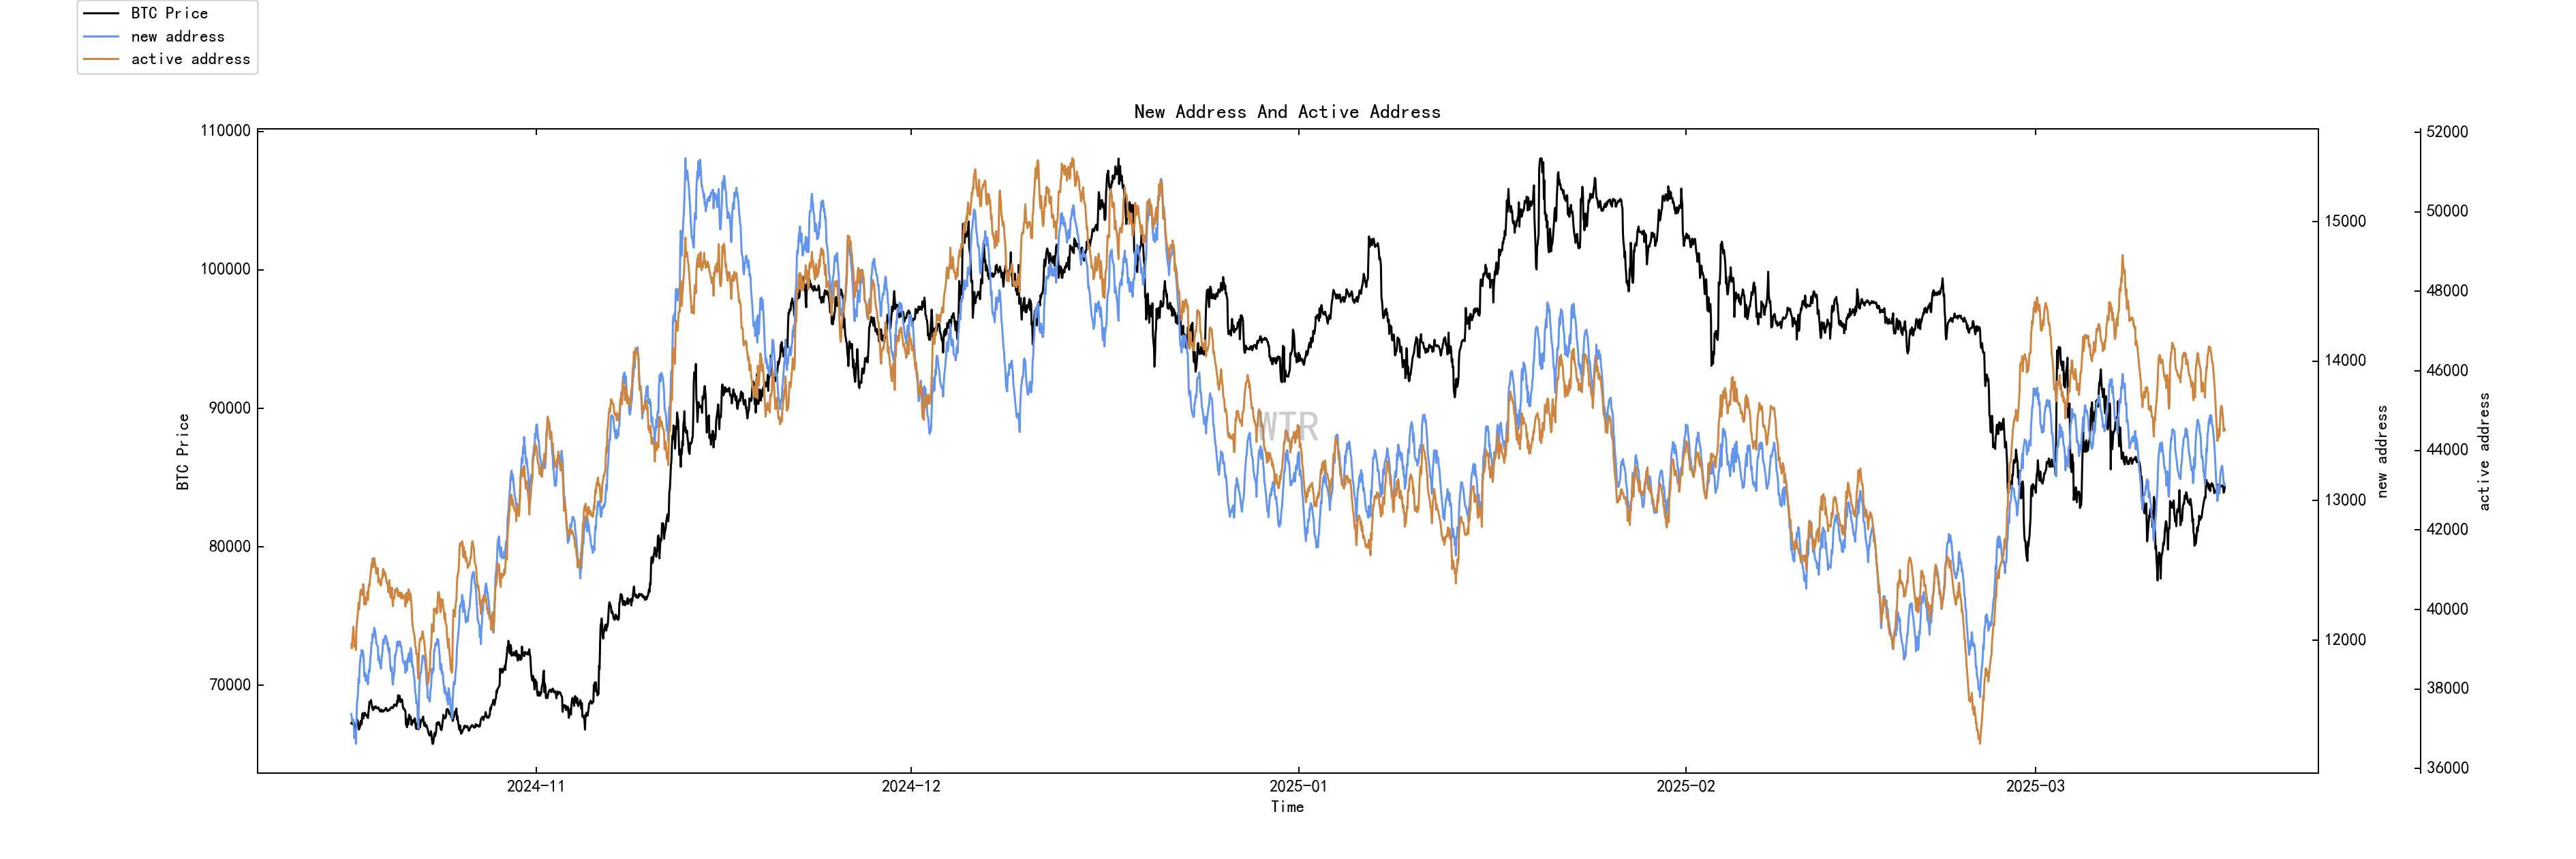
New active addresses are at the median.
Spot and selling pressure structural rating: BTC is in a state of significant outflow accumulation, while ETH has a slight outflow.
(Below chart shows net positions on ice sugar orange exchanges)

BTC is in a state of significant outflow accumulation.
(Below chart shows net positions on the E-Tai exchange)

ETH has a slight outflow.
(Below chart shows high-weight selling pressure)
Currently, there is no high-weight selling pressure participation.
Purchasing power rating: Global purchasing power is in a state of loss, with a slight loss in stablecoin purchasing power.
(Below chart shows global purchasing power status)

Current purchasing power is in a state of loss.
(Below chart shows net positions on USDT exchanges)

Stablecoin purchasing power has seen a slight loss.
Off-chain trading data rating: There is a willingness to buy at $75,000; there is a willingness to sell at $86,000.
(Below chart shows off-chain data from Coinbase)

There is a willingness to buy around the $70,000-$75,000 price level;
There is a willingness to sell around the $90,000 price level.
(Below chart shows off-chain data from Binance)

There is a willingness to buy around the $70,000-$75,000 price level;
There is a willingness to sell around the $86,000-$90,000 price level.
(Below chart shows off-chain data from Bitfinex)

There is a willingness to buy around the $70,000-$75,000 price level;
There is a willingness to sell around the $86,000 price level.
Weekly summary:

Summary of news:
The circulation of US dollars has reached $21.6 trillion (close to historical highs), and M2 has grown 3.9% year-on-year (the fastest in 30 months), both proving that market liquidity is indeed very abundant, even slightly excessive.
This means it contradicts the market's current explanation of liquidity scarcity.
So why is the capital market still performing poorly?
Possible core reasons include:
Economic fundamentals are weak: manufacturing index -20, declining consumer confidence, recession risk at 25%.
Risk appetite is declining: funds are shifting to safe-haven assets like gold (which has reached $3,000).
The above reasons have led to a significant amount of liquidity that is not evenly distributed but concentrated in one asset.
Currently, the market is waiting for policy signals from central banks such as the Federal Reserve, with liquidity effects showing a lag; it is expected that after policies are clarified, funds will be reallocated in a specific order (safe-haven assets → stock market → high-risk assets).
The market bets that the Federal Reserve will stop tapering in May and cut rates in June.
Polymarket has already placed bets that QT will end, and the probability has risen to a very high level.
Recently, various inflation indicators in the US, including CPI and PPI, have fallen below expectations, and the US economy and employment are weak, leading to a return of rate cut expectations.
Under this broader context, the medium to long-term overall macro fundamentals remain positive.
Short-term focus:
The Federal Reserve will announce the interest rate dot plot on Thursday at 2:00 AM, focusing on members' tendencies towards rate cuts.
On-chain long-term insights:
The current range (around $80,000) corresponds to the average cost area for many retail investors, forming a new psychological support level;
Some long-term holders or whales (high-weight investors) are overall stable, with no signs of panic selling;
ETFs are transitioning from large-scale outflows to initial buying, indicating that institutions may be slowly shifting from risk aversion to initial tentative buying;
Inactive whales remain strong and are continuously increasing their holdings.
Market positioning:
The market is in a transition phase from optimism to caution, without reaching an extremely pessimistic range, which is usually characteristic of adjustments rather than trend reversals, and institutions are gradually tentatively buying.
On-chain mid-term exploration:
The situation of weakened liquidity has slightly improved;
BTC is currently hovering around the lower limit of approximately $79,000;
There are signs of significant BTC outflows from exchanges recently;
The growth rate of stablecoin supply shows slight signs of recovery;
The outflow magnitude of BTC ETF funds has decreased;
A new demand support band is forming at $78,500-$82,000.
Market positioning:
Currently, a new demand support band is forming between $78,500 and $82,000, but whether it can emerge from or hold the bottom area needs to consider the extent of liquidity recovery.
On-chain short-term observation:
The risk coefficient is in the red zone, and derivatives risk is increasing.
New active addresses are relatively in line with market activity.
Market sentiment state rating: Neutral.
Overall, net positions on exchanges show that BTC is in a state of significant outflow accumulation, while ETH has a slight outflow.
Global purchasing power is in a state of loss, with a slight loss in stablecoin purchasing power.
Off-chain trading data shows a willingness to buy at $75,000; there is a willingness to sell at $86,000.
The probability of not breaking below $75,000-$79,000 in the short term is 60%; among them, the probability of not breaking above $92,000-$87,000 in the short term is 60%.
Market positioning:
Short-term market sentiment is returning to neutral, with both optimism and panic emotions at low levels. Analysis of the data reveals that both profit and loss positions choose to hold at the current price level, while some buying power opts to accumulate at this price, achieving a short-term balance point.
However, the current market lacks substantial buying power and narratives, with short-term expectations primarily focused on range-bound fluctuations.
Risk warning:
All of the above are market discussions and explorations and do not provide directional opinions on investments; please approach with caution and guard against market black swan risks.
This report is provided by the 'WTR' research institute.
Welcome to follow us


