
"Looking forward to the endless frontier technology; seeing the future, leading the new era of investment research." This report is provided by the "WTR" Research Institute:Members’ Twitter IDs: Golden Egg Diary @jindanriji; Elk Will Not Get Lost @crypto_elk_; Forex Brother; Xibei @Asterismone;
The first round of WTR on-chain data subscription (OG) is officially launched!Data provided: WTR self-developed market short-term, medium-term and long-term on-chain data, as well as some small currency data. First round pricing: 399U/year. Payment supports on-chain and off-chain transfers. Other notes: We have prepared a strategy package for OG users. The number of places in the strategy package is limited. The current strategy package is only open to the first round of OG users. Subscriptions can directly add OG user groups, please see X for details.

Weekly Review
This week, from February 24 to March 3, the highest price of Sugar Orange was around $96,500 and the lowest was close to $78,258, with a fluctuation range of about 18.9%.
Observing the chip distribution chart, there are a large number of chip transactions around 90,000, which will have certain support or pressure.

analyze:
60000-68000: about 1.52 million pieces;
90000-100000: about 2.69 million pieces;
The probability of not falling below 79,000-83,000 in the short term is 60%;
The probability that it will not rise below 92,000-96,000 in the short term is 60%.
Important news
Economic News
Weak US economic data
Consumer spending has plummeted and consumer confidence is low.
Jobless claims rose sharply and housing data was bleak.
The Atlanta Fed predicts that the US GDP will shrink by -2.8% in the first quarter of 2025 (previously expected to be -1.5%).
US Treasury yields fall
The 10-year U.S. Treasury yield fell to nearly 4.2% from nearly 4.8%.
The two-year Treasury yield fell below 4% during the session for the first time in four months.
Expectations of a Fed rate cut increase
Markets are betting the Federal Reserve will cut interest rates several times this year to counter the economic slowdown.
The probability of a 25 basis point rate cut in June has risen to around 80%, and the market has begun to price in the possibility of a total of three rate cuts this year.
Capital Market Performance
The Nasdaq fell sharply during the session, driving the crypto market down.
Encrypted ecological news
Trump's comments on cryptocurrency reserves
On March 2, Trump issued a statement saying that he would establish a U.S. cryptocurrency reserve, mentioning that cryptocurrencies including XRP, SOL, ADA, BTC and ETH would become the core of the reserve, and expressed his desire to ensure that the United States becomes the "cryptocurrency capital of the world."
Trump will host the first cryptocurrency summit at the White House on March 7.
Market reaction
BTC rose by more than $10,000, from a low of $78,000 to $95,000, up more than 21% and about 15% from its high of $109,000. Other currencies followed suit.
Expert and key opinion
Chris Burniske, partner at Placeholder VC: This is a "typical Trump negotiation strategy" that requires convincing Congress.
Julien Bittel, head of research at Global Macro Investor: The macro environment may have an impact on BTC, but market panic will not last long.
David Sacks, director of AI and cryptocurrency at the White House: Trump is fulfilling his promise to make the United States the "cryptocurrency capital of the world."
Strategist Eliézer Ndinga: Creating a strategic reserve would likely require congressional approval.
Musk warns: MEME is a game of fools and musical chairs, don’t invest your savings.
Regulatory and legislative developments
Two BTC reserve bills in Arizona, USA, passed the Senate and were sent to the House of Representatives for consideration.
U.S. Senator Cynthia Lummis said: Before we see the federal strategic reserve, we may see state-level strategic reserve BTC first.
Organization News
BlackRock added the BTC ETF IBIT to its investment model for the first time.
State Street predicts that demand for cryptocurrency ETFs will surge and will surpass precious metals ETFs to become the third largest asset class.
CME Group will launch Solana (SOL) futures and mini SOL futures on March 17.
Long-term insights: used to observe our long-term situation; bull market/bear market/structural change/neutral state
Mid-term exploration: used to analyze what stage we are currently in, how long this stage will last, and what situations we will face
Short-term observation: used to analyze short-term market conditions; the possibility of certain directions and certain events occurring under certain conditions
Long-term insights
Short-term holder cost line
Time distribution structure of each participant holder
ETF fund flows
On-chain spot selling pressure indicator
High-weight selling pressure
(The figure below shows the short-term holder cost line)

This is a key signal of a turning point in market sentiment - investors who recently entered the market are starting to lose money.
When the price falls below the short-term cost line, the market enters a typical emotional transition period, short-term investors face stop-loss pressure, and emotions turn from excitement to fear. This shows that market sentiment is still not optimistic in the short and medium term.
(The following figure shows the time distribution structure of each participant holder)

This reflects a phenomenon in the late stage of a bull market - value investors gradually shift to a short-term trading mentality or sell.
When the market reaches the critical point of sentiment mutation, the holding time structure begins to reorganize, indicating that the cognition of long-term investors has changed: participants are no longer simply focused on value, but on the short-term behavioral expectations of other participants.
(The following figure shows the flow of ETF funds)

There has been a massive net outflow of ETFs recently: ETF selling → market decline → panic spreads → more selling.
Combined with the fact that the market has fallen below the short-term cost line, this capital outflow is no longer a simple profit-taking, but may become an overall reconstruction of market beliefs, temporarily forming a reinforcing cycle, and this sentiment may need to reach a turning point for repair.
(The following figure shows the on-chain spot selling pressure indicator)
The market is moving away from fragmented networks to centralized networks focusing on the same signal.
When the price falls below the short-term cost line, the changes in the selling pressure indicator are more directional - participants' decisions are no longer based on multiple information, but focus on the dimension of "whether others will sell", which amplifies the market reaction.
(Figure below shows high-weight selling pressure)

There is high-weight selling pressure, and not many chips have moved recently. They are still at a low level. Although the short-term speculator cost line has been broken, market beliefs have not yet truly diverged into a double peak - the polarization between optimism and pessimism has intensified, and the number of middle-of-the-roaders has decreased.
Long-term holders starting to move their holdings is a precursor to a restructuring of market sentiment.
However, there is no sign of this happening yet, and the market has not yet reached its most dangerous and sluggish point. At least there has been no real tilt in the long term and among some high-powered participants.
The crypto market has now entered a period of accelerated sentiment.
The price falling below the short-term holders’ cost line is a key turning point, which means that the market has turned from general optimism to local panic. The outflow of ETFs resonates with the movement of short-term speculators’ chips, accelerating the transmission of emotions.
But this panic has not really expanded, that is, there has been no substantial change in long-term participants.
Key observation point: If it can stabilize in the current area, it means that the market has sufficient resilience to absorb short-term selling pressure.
The core of market game seems to have shifted from "chasing the rise" to "whether to escape the top". Investors' decision-making should pay more attention to changes in network structure rather than simple price fluctuations.
This situation has not yet expanded to long-term players.
Mid-term exploration
USDC Exchange Net Position
Cost structure analysis model
Liquidity Supply
Supply of key stablecoins
VDD
(The following figure shows the net position of USDC exchanges)

The balance of USDC has changed significantly recently, rising and then falling rapidly.
In the case of insufficient sustainability of purchasing power in the US market, a stable and continuous supply of purchasing power may not have been formed at present.
(The figure below shows the cost structure analysis model)

The current market inventory upper limit price is around 103,000, and the market lower limit is around 78,900. It is possible that in the medium term, if the inventory remains unchanged, it will fluctuate in the range of 78,900-103,000.
(Figure below shows liquidity supply)

There are signs of a small recovery in liquidity supply, and there may be slight signs of liquidity recovery in the market at present.
Considering that the short-term trend of liquidity loss usually occurs within 2-3 days, the current phenomenon may remain to be seen.
(Stablecoin supply in the figure below)

The total amount of stablecoins has accumulated to a high level. As the cumulative trend slows down, the market may return to a relatively neutral state in the medium to long term.
(VDD in the figure below)

Currently, the macro selling pressure in the market is gradually decreasing, even though the market is at a higher level.
When selling pressure has not formed an obvious trend, the key factor of on-site pricing may have a lot to do with liquidity.
Short-term observation
Derivatives Risk Factor
Option intention transaction ratio
Derivatives Trading Volume
Option Implied Volatility
Profit and loss transfer
New addresses and active addresses
Net Position of Bingtang Orange Exchange
Net position of the Auntie Exchange
High-weight selling pressure
Global purchasing power status
Stablecoin exchange net positions
Off-chain exchange data
Derivatives rating: The risk factor is in the neutral area and the derivatives risk is moderate.
(The figure below shows the risk factor of derivatives)

Even after the risk factor reached green last week, the market quickly plunged downward to liquidate long positions. The current risk factor has reached the neutral zone, and there is no special expectation for derivatives this week.
(The figure below shows the option intention transaction ratio)
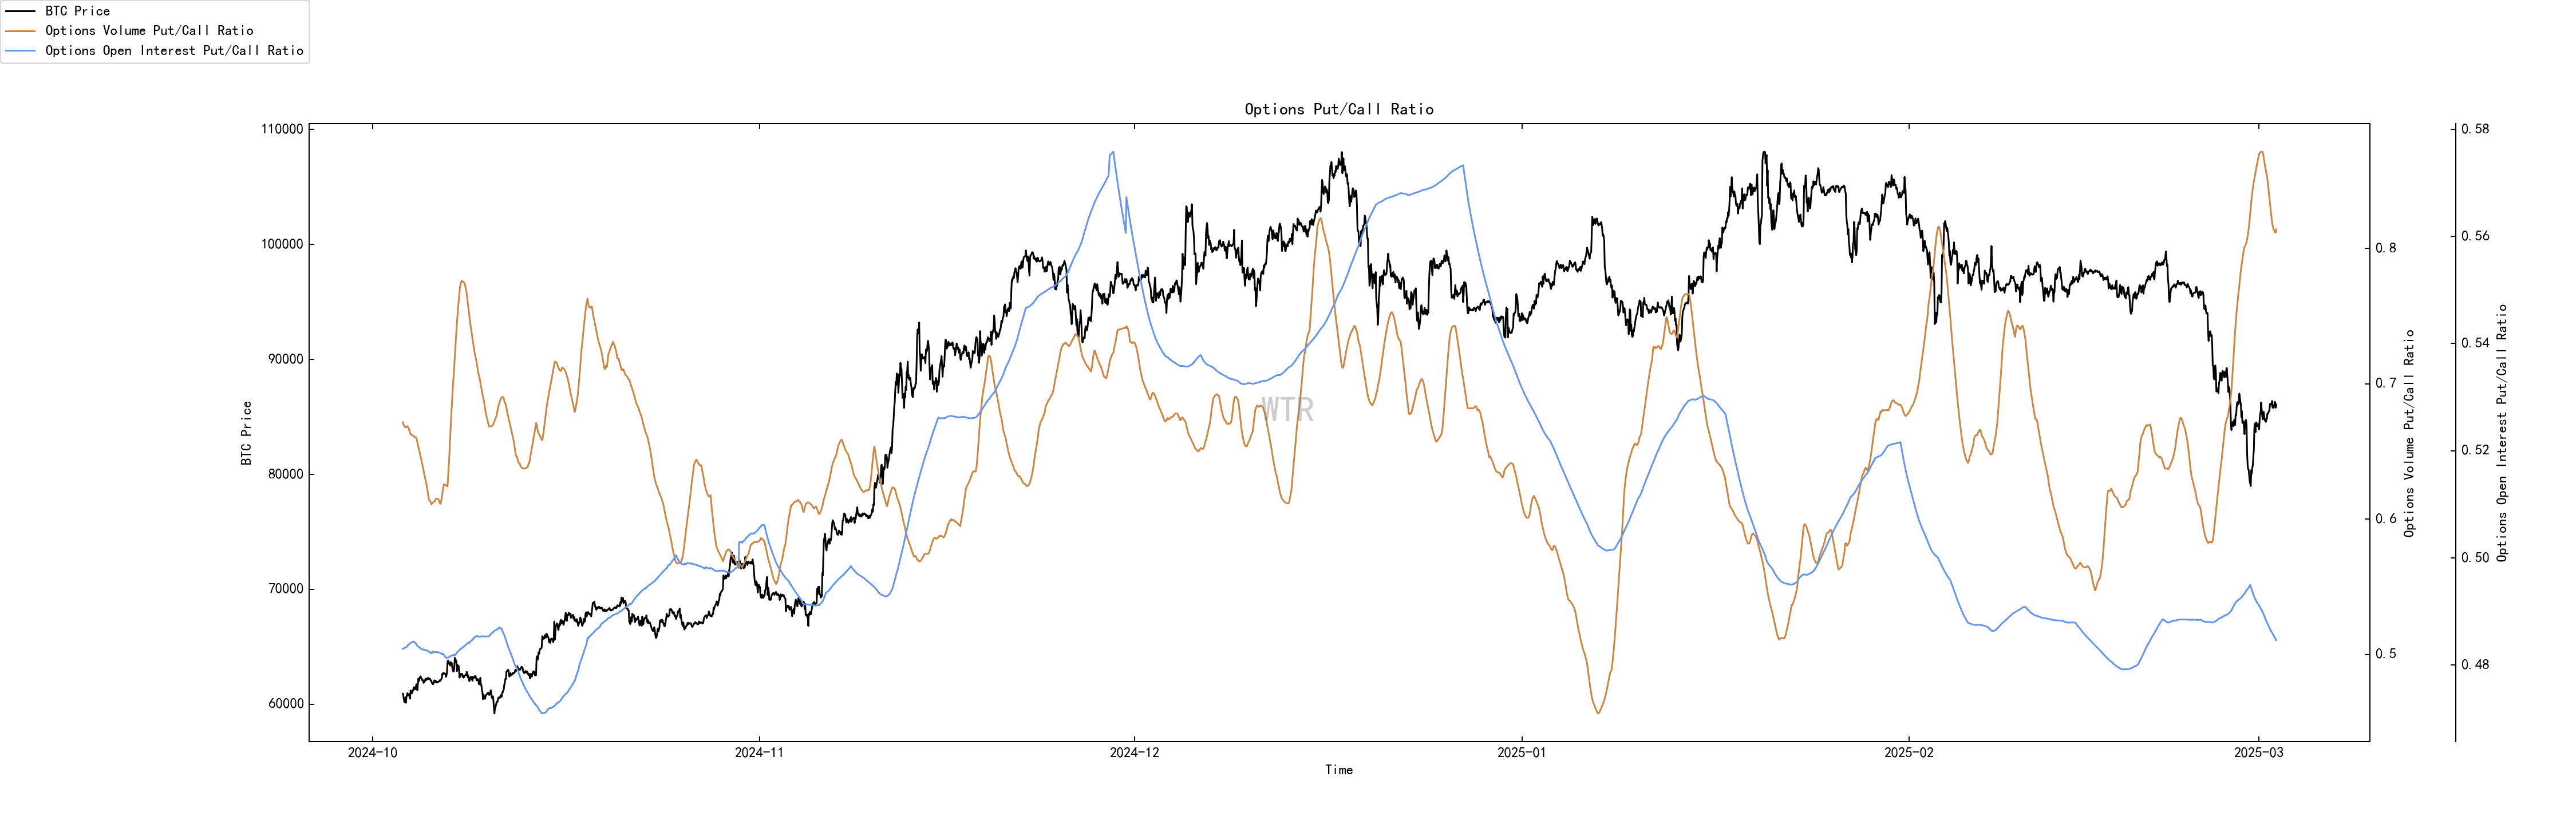
The put option ratio is low and the trading volume is high.
(Figure below shows derivatives trading volume)
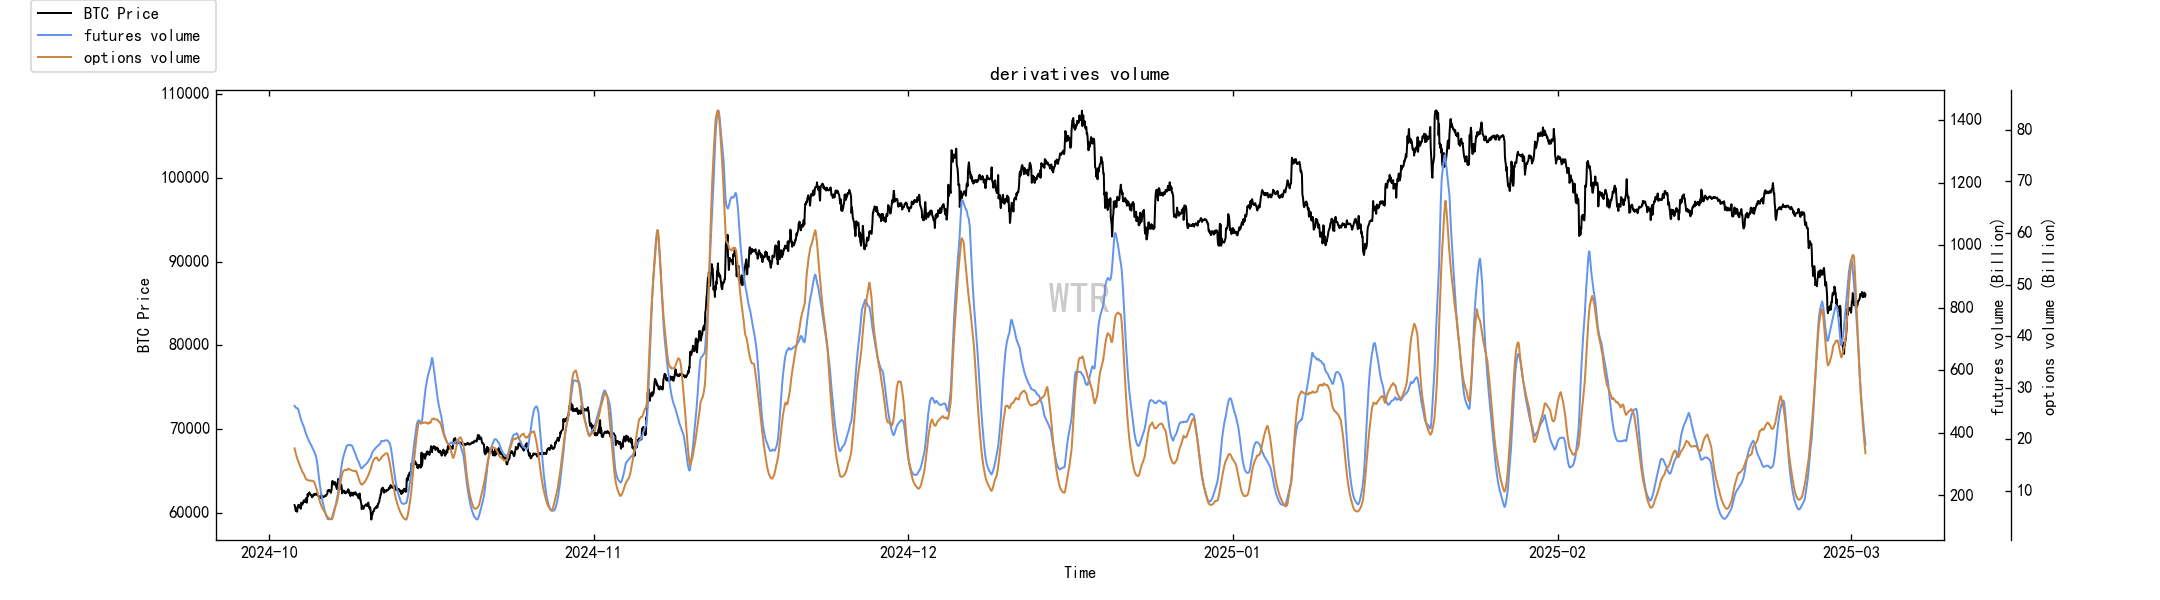
After the market's rapid decline, the current derivatives trading volume has quickly fallen to a low level again.
(The figure below shows the implied volatility of options)

Option implied volatility fluctuates rapidly in the short term.
Emotional state rating: Panic has eased
(The following figure shows the amount of profit and loss transfer)

For BTC, there is panic in the market (orange line) during this decline. Although it has reached the extreme value of short-term sentiment, it is not much. In the short term, when the comprehensive purchasing power of the market has not returned, it is still more inclined to fluctuate.
(Figure below shows newly added addresses and active addresses)

The number of newly added and active addresses increased rapidly during the decline, which may be caused by the consolidation of positions rather than an increase in real market activity.
Spot and selling pressure structure rating: BTC is in a state of accumulated outflow, while ETH has a large amount of accumulated inflow.
(The following figure shows the net position of Bingtang Orange Exchange)

BTC is in a state of outflow accumulation.
(The following figure shows the net position of E-Tai Exchange)

A large inflow of ETH is accumulating.
(Figure below shows high-weight selling pressure)

There is not much high-weight selling pressure involved in the current decline.
Purchasing power rating: Global purchasing power is in a state of loss, and stablecoin purchasing power is losing a small amount.
(Figure below shows the global purchasing power status)

The current purchasing power is in a state of loss.
(The following figure shows the net position of USDT exchanges)

The purchasing power of stablecoins has been lost slightly.
Off-chain transaction data rating: There is a willingness to buy at 78,000; there is a willingness to sell at 90,000.
(The following figure shows Coinbase off-chain data)

There is willingness to buy at a price around 75,000~80,000;
There is a willingness to sell at prices around 90,000.
(Binance off-chain data in the figure below)

There is willingness to buy at a price around 75,000~80,000;
There is a willingness to sell at prices around 100,000.
(Bitfinex off-chain data in the figure below)

There is willingness to buy at prices around 75,000 and 78,000;
There is a willingness to sell at prices around 90,000.
This week’s summary:

Summary of news:
Cryptocurrency strategic reserve plans and interest rate cuts may overlap relatively;
The interest rate cut and the cessation of balance sheet reduction will increase liquidity, which is beneficial to risks, assets and crypto assets;
The market is in a state of economic uncertainty in the short term, and participants are actively looking for alternative assets;
Institutional participation is rapidly driving the maturity of the crypto market, and the future scenario will be more complex.
If we look at the historical cycle, the market has now pulled back by more than 20%, approaching the low point of some historical bull markets. If the macro premise remains unchanged, this is a relatively attractive price.
On-chain long-term insights:
The short-term cost line shows that the short- to medium-term sentiment is not optimistic;
Long-term participants seem to no longer focus on value at the moment, and short-term behavior becomes more common;
The break of ETF and short-term cost line has created negative reinforcement sentiment, which needs to be eased;
Changes in the selling pressure indicator show that in the short term, participants' decisions are more focused on the dimension of "whether others will sell", which amplifies the market reaction.
The panic has not really spread to long-term players and high-weight players.
Market setting:
If it can stabilize in the current range, it will indicate that the market is resilient enough to absorb short-term selling pressure.
On-chain mid-term exploration:
USDC has an incremental balance, but is currently unstable;
In the medium term, the price fluctuation range may be around 78,000-103,000;
Liquidity supply is slowly recovering;
The growth rate of stablecoins has declined;
The current macro-structural selling pressure is not large.
Market setting:
Shock, Repair
From the current perspective, pricing in the medium term may depend on liquidity, and the current structural selling pressure is not large.
On-chain short-term observations:
The risk factor is in the neutral area and the risk of derivatives is moderate.
The number of newly added active addresses is at a medium level, and the market activity is relatively low.
Market sentiment rating: Panic has eased
The overall net position of the exchange shows that BTC is in a state of accumulating outflows, while ETH is accumulating inflows.
Global purchasing power is in a state of loss, and the purchasing power of stablecoins is losing a small amount.
Off-chain transaction data shows that there is a willingness to buy at 78,000 and a willingness to sell at 90,000.
Market setting:
The current market panic has eased, but overall the market's positive sentiment is still low. Because the news this week has a greater impact, it is expected that there will be a higher probability of derivatives short squeeze liquidation.
Risk Warning:
The above are all market discussions and explorations and do not provide any directional opinions on investment; please be cautious about and prevent market black swan risks.
This report is provided by the "WTR" Research Institute.
Welcome to follow us!


