These indicators predict market shifts with 99% accuracy.
Most charge $10,000+ for this knowledge—but I’m giving it away for FREE.
Here’s my ULTIMATE guide to reading charts like a pro 👇🧵
2/ Everything You Need is in the Chart
✅ Memecoin trends, reversals, and golden opportunities—it’s all mapped out
✅ Master reading charts, and wealth is yours for the taking
✅ Here’s what you must understand 👇
3/ Momentum Shifts
✅ Higher highs & higher lows confirm a recovery
✅ I focus on overlooked projects with rising volume & holder growth
✅ Best entries: 0.786 Fibonacci retracement or well-defined higher lows

4/ Accumulation Zones
Smart money loads up before breakouts
🔹 How to Spot Them:
✅ Price moves sideways after a big drop
✅ Volume remains steady or increases
✅ RSI stays neutral (no extreme overbought/oversold signals)
✅ Whale wallets accumulate without major price moves
🔹 How to Trade Them:
✅ Buy near support of the accumulation range
✅ Watch for volume spikes as confirmation
✅ Enter on a breakout above resistance with strong volume
⚠️ Warning: Not every accumulation leads to a pump—fakeouts happen. If support keeps breaking, the range is shifting lower. Track whale wallets & market makers for better insights.

5/ ATH Breakouts
✅ ATH (All-Time High) breakouts signal uncharted price discovery where momentum is king
✅ Price consolidates near ATH, forming higher lows → bullish pressure builds
✅ Volume surges on the breakout → confirms real demand
✅ Low sell walls on order books → minimal resistance ahead
✅ Funding rates stay neutral → no excessive leverage trapping
🔹 How to Trade Them:
✅ Enter on a retest of the previous ATH (if it flips to support)
✅ Ride the trend using Fibonacci extensions (1.618, 2.618, etc.)
✅ Use trailing stops to secure profits while letting the rally run
⚠️ Common Mistakes: Buying too late into an overextended breakout, ignoring volume confirmations, and not securing profits.

6/ Fibonacci Retracement
✅ Fibonacci retracement levels help identify potential support zones during pullbacks
✅ Key Levels:
0.236 - Shallow retrace, strong trend continuation
0.382 - First solid dip buy zone
0.5 - Psychological level, not a true Fibonacci ratio
0.618 - The “Golden Zone,” strongest reversal area
0.786 - Deep retrace, often final shakeout before a move up
🔹 How to Use It:
✅ Draw from swing low to swing high (uptrend) or swing high to swing low (downtrend)
✅ Look for confluence with support zones, moving averages, or high-volume areas
✅ Buy at key retracement levels & set stop-loss below the next one

7/ Support & Resistance
✅ Support = A price level where demand absorbs selling pressure
✅ Resistance = A price level where selling pressure overcomes demand
🔹 How to Trade Them:
✅ Buy support → If price holds with volume confirmation
✅ Sell resistance → If price struggles & rejection wicks appear
✅ Break & Retest → Once resistance flips into support, it’s a bullish confirmation
⚠️ Mistakes to Avoid: Trading support/resistance blindly without confirmation, ignoring the trend context, and chasing breakouts without a retest.

8/ EMA/SMA
✅ SMA (Simple Moving Average) → Averages price over a set period, giving equal weight to all values
✅ EMA (Exponential Moving Average) → Puts more weight on recent prices, reacting faster to trends
🔹 Key Moving Averages to Watch:
SMA 50 & SMA 200 → Used for long-term trend analysis (Golden Cross/Death Cross signals)
EMA 21 & EMA 50 → Best for short-term trend tracking & momentum plays
EMA 100 & EMA 200 → Act as strong dynamic support & resistance
🔹 How to Trade with Moving Averages:
✅ Trend Confirmation → Price above EMA/SMA = bullish, below = bearish
✅ Support & Resistance → Moving averages often act as bounce/rejection zones
✅ Crossovers for Entries/Exits:
Golden Cross (SMA 50 crosses above SMA 200) = Bullish signal
Death Cross (SMA 50 crosses below SMA 200) = Bearish signal

9/ RSI
✅ RSI (Relative Strength Index) measures momentum & identifies potential reversals
✅ How RSI Works:
Above 70 → Overbought (potential sell signal)
Below 30 → Oversold (potential buy signal)
50 Level → Midpoint, confirms trend strength
🔹 How to Trade with RSI:
✅ Buy when RSI is oversold (<30) & price hits key support
✅ Sell when RSI is overbought (>70) & price reaches resistance
✅ Divergences = Powerful Reversal Signals:
Bullish Divergence → Price makes lower lows, RSI makes higher lows → Trend reversal up
Bearish Divergence → Price makes higher highs, RSI makes lower highs → Trend reversal down

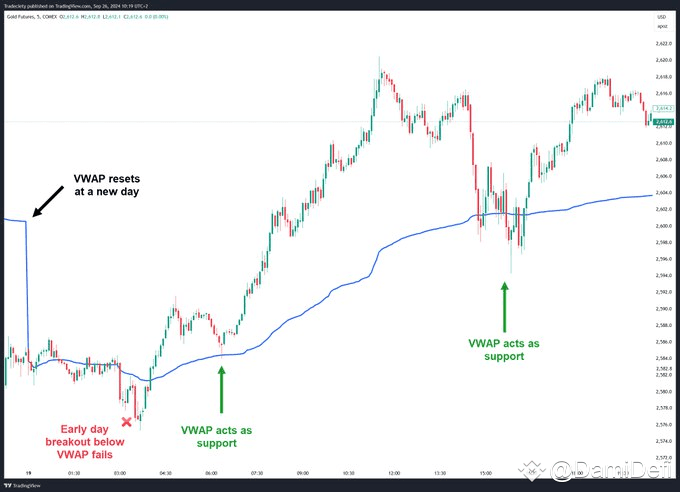
10/ VWAP
✅ VWAP (Volume Weighted Average Price) shows the average price weighted by volume, used by institutions to gauge fair value
✅ How VWAP Works:
Above VWAP → Bullish bias (buyers in control)
Below VWAP → Bearish bias (sellers in control)
VWAP as Dynamic Support/Resistance → Price often reacts at VWAP intraday
🔹 How to Trade with VWAP:
✅ Buy when price bounces off VWAP in an uptrend → Confirmation of strength
✅ Sell when price rejects VWAP in a downtrend → Confirmation of weakness
✅ Break & Retest Strategy → If price breaks VWAP & holds above, trend shift bullish (vice versa for bearish)
#USCryptoReserve #MarketRebound #CZ'sTokenModelIdea #CMEsolanaFutures #BTCRebundsBack