Greetings after a long break. We've entered a week of sharp sells following the month's close. While BTC didn't pull back significantly, we witnessed drops of up to 30% in ETH and altcoins. I had previously shared charts on Twitter indicating these potential sells. February holds significant developments and events that will shape crypto's future. Let's examine what lies ahead. The inflation data coming on February 12th is crucial as it will determine future interest rate cuts and monetary policies. Additionally, FTX repayments will begin at the end of February, which are highly price-impactful news.

Bitcoin
January's volatility remained below expectations at 21.7%, showing mostly range-bound movement. Towards month-end, it pulled the market down with declines. BTC, which fell 10% from its monthly opening, currently trades 3% above it. The reaction has been quite strong, with the daily candle collecting all the decline and turning upward. Today's and tomorrow's daily closes will be significant.

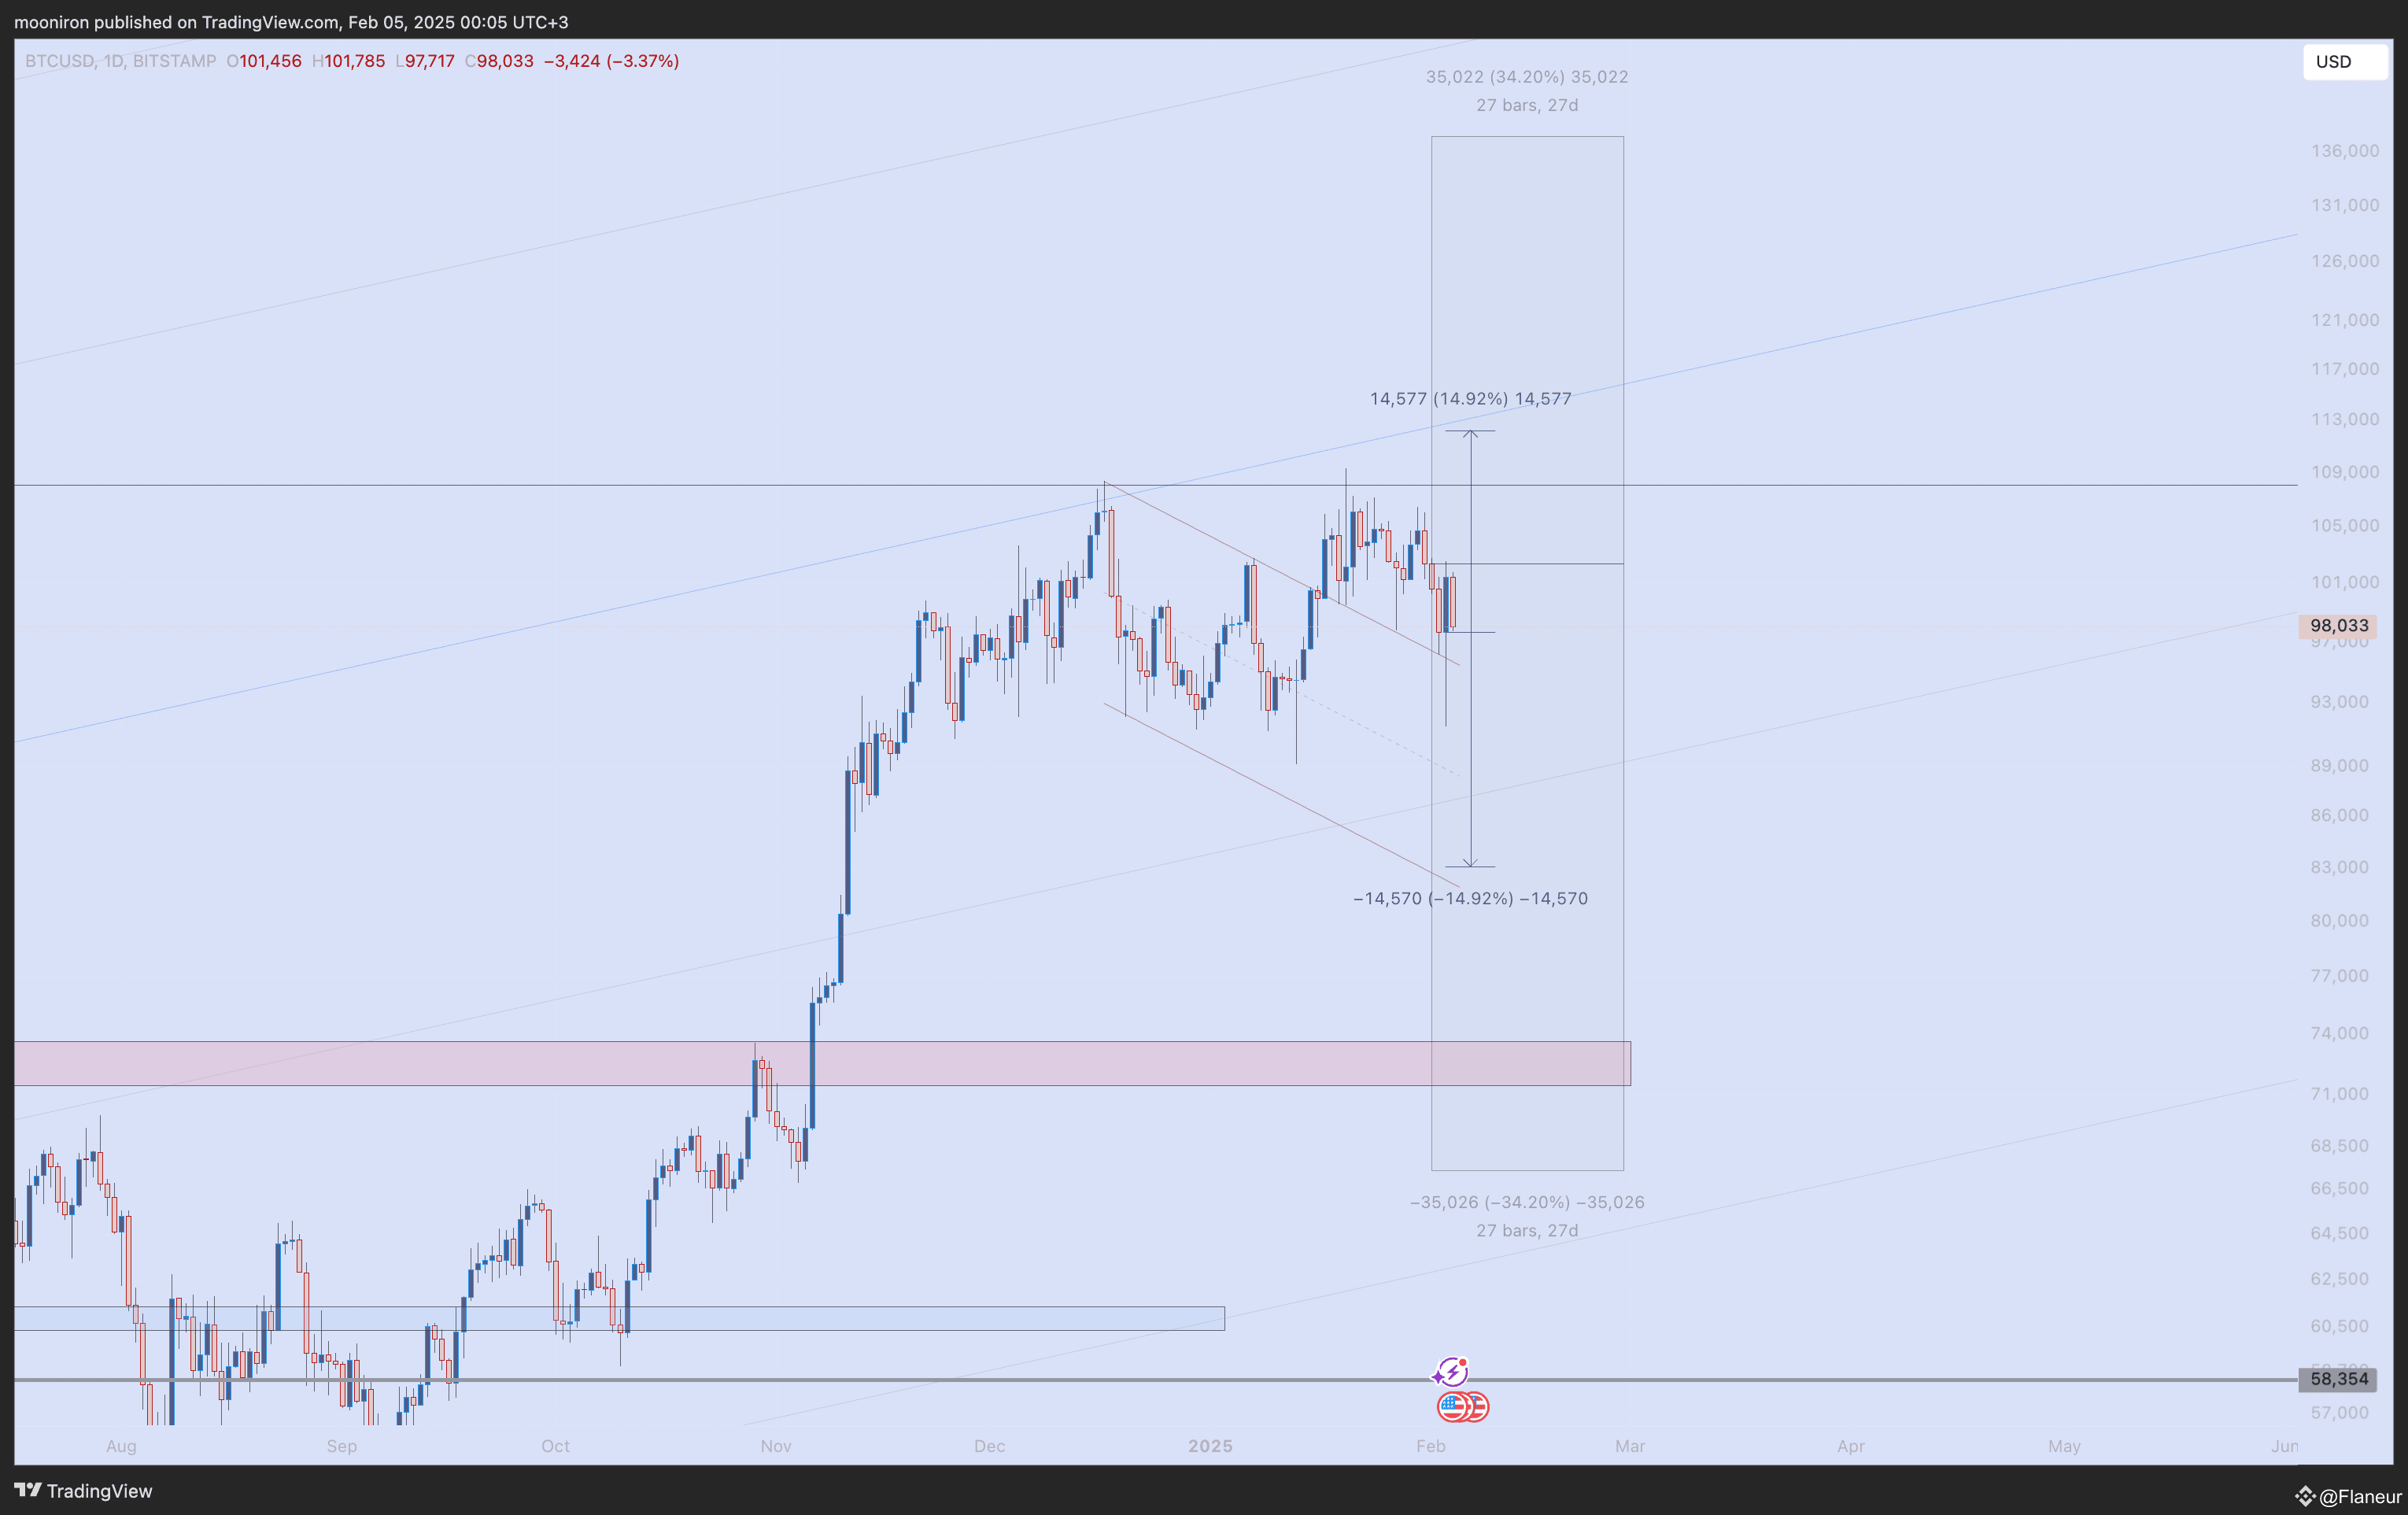
For February, monthly implied volatility is 34.2%, while weekly is 14.92%. This range appears to be between 67k and 137k. We've observed decreased volatility in BTC over recent months. Weekly implied volatility of 14.92% suggests a price range of 83k-112k.


The price moved 6.3% down from the monthly opening, then 5% up from the weekly opening, resulting in 11.3% volatility. We can expect to spend this week within this price range. However, I believe price will move upward during pullbacks. I'm expecting an increase up to at least 113-118k region. Not this week certainly, but I anticipate such movement within this month
Ethereum
ETH closed January with 24.7% volatility, showing high 21% volatility in the final week. Price movement has been quite heavy and significantly underperforming against Bitcoin. During the recent decline, they experienced 15-30% drops along with other altcoins. Currently trading 17% below monthly opening and 4.5% below weekly opening.

February's monthly implied volatility average is 48.5%, corresponding to the 1700-4900 range. Weekly implied volatility average is 19.1%, matching the 2300-3400 range. Indeed, with a 35.8% drop from monthly opening and 26.2% from weekly opening, most of these volatilities have been consumed. In fact, more than January's total volatility.

Despite the sharp decline, ETH appears to have recovered quickly to a certain extent, saving the candle structure from a bearish appearance. I favor being a buyer on pullbacks below 2600. Especially the 2300-2500 region is quite good for positioning. Since I didn't expect such rapid recovery, I was waiting for purchases. I'll wait for purchases during pullbacks to this region.

ETHBTC
With the sharp decline, we also saw drops in the ETHBTC chart. It had been showing price movements around 0.03 for a long time, signaling potential decline with lower peaks. With staying below 0.03, it sharply dropped to 0.023 region and showed quick recovery again. While another movement toward those regions wouldn't be surprising, I don't expect new lows and think we should look for bottom structure now. After staying above 0.033, I expect sharp rises to begin toward and above the 0.04 region.

Bitcoin has only closed red twice in February, in 2014 and 2020. ETH has only closed red in 2018. What are your thoughts on how this month will progress?

