In recent days, $BTC has been experiencing significant fluctuations, with the price rising and falling in a movement that reflects market indecision. This volatility can be explained by technical factors and investor behavior.
On the daily Dominance chart of$BTC (BTC.D), we see a drop. This movement is positive for altcoins, which are demonstrating greater performance compared to Bitcoin. This situation could mark the beginning of Altseason, when altcoins tend to outperform BTC in gains.

On the weekly chart, $BTC is holding at the Fibonacci level (0.23), an important support. However, declining volume suggests weakness, and the price may seek a new base at the (0.38) level ($85,000), consolidating as a more solid support.

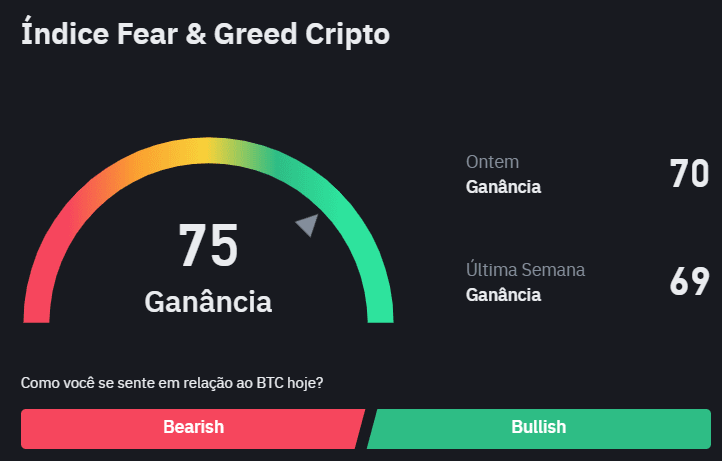
The market sentiment indicator points to greed levels, warning of an unfavorable time for new entries. Greedy markets generally precede corrections, while panicked moments offer better buying opportunities. This behavior may indicate an imminent flush, a sharp drop to liquidate leveraged positions.
On the daily chart, we have very clear support and resistance levels. Currently, the resistance is at $102,380.20, while the closest support is $91,249.16. A breakout of one of these levels, accompanied by significant volume, could signal the market's next steps.

BTC, currently trading at $100,121, could experience a new flush, liquidating positions before a more significant movement. These fluctuations are normal and help the market to consolidate more stable price bases.
Remember: this is a technical analysis and does not constitute investment advice.

