
#btc70k
btc70k
31.3M views
26,734 Discussing
Bitcoin hitting the exciting $70k mark, let's dive into discussions, share insights, and celebrate this crypto high together. Come on in, let's talk Bitcoin!
Hot
Latest


·
--
Bitcoin (BTC) Surpasses 70,000 USDT with 0.09% Increase in 24 HoursOn Jun 04, 2024, 14:18 PM (UTC). According to Binance Market Data, Bitcoin (BTC) has crossed the 70,000 USDT benchmark and is now trading at 70,025.851563 USDT, with 0.09% increase in 24 hours.
Bitcoin (BTC) Surpasses 70,000 USDT with 0.09% Increase in 24 Hours
On Jun 04, 2024, 14:18 PM (UTC). According to Binance Market Data, Bitcoin (BTC) has crossed the 70,000 USDT benchmark and is now trading at 70,025.851563 USDT, with 0.09% increase in 24 hours.
3
10
11.8k

·
--
Article
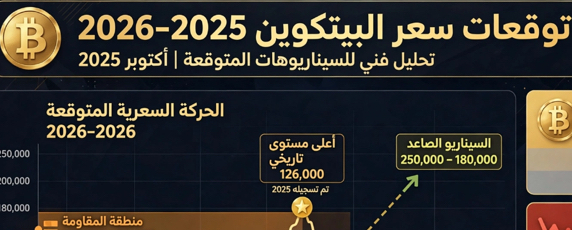
Bitcoin during the yearBitcoin during the year—from peak to test, and what awaits us in 2027?
1. 2025 summary: a year that broke every rule
All of us were waiting for a post-halving breakthrough, but 2025 defied historical expectations.
Bitcoin reached a new high at $126,000 in October, but heavy selling by whales and early investors in the last quarter eroded the gains, and the year ended down 6% at $88,000
Bitcoin during the year
Bitcoin during the year—from peak to test, and what awaits us in 2027?
1. 2025 summary: a year that broke every rule
All of us were waiting for a post-halving breakthrough, but 2025 defied historical expectations.
Bitcoin reached a new high at $126,000 in October, but heavy selling by whales and early investors in the last quarter eroded the gains, and the year ended down 6% at $88,000
1. 2025 summary: a year that broke every rule
All of us were waiting for a post-halving breakthrough, but 2025 defied historical expectations.
Bitcoin reached a new high at $126,000 in October, but heavy selling by whales and early investors in the last quarter eroded the gains, and the year ended down 6% at $88,000
1
839

#btc70k
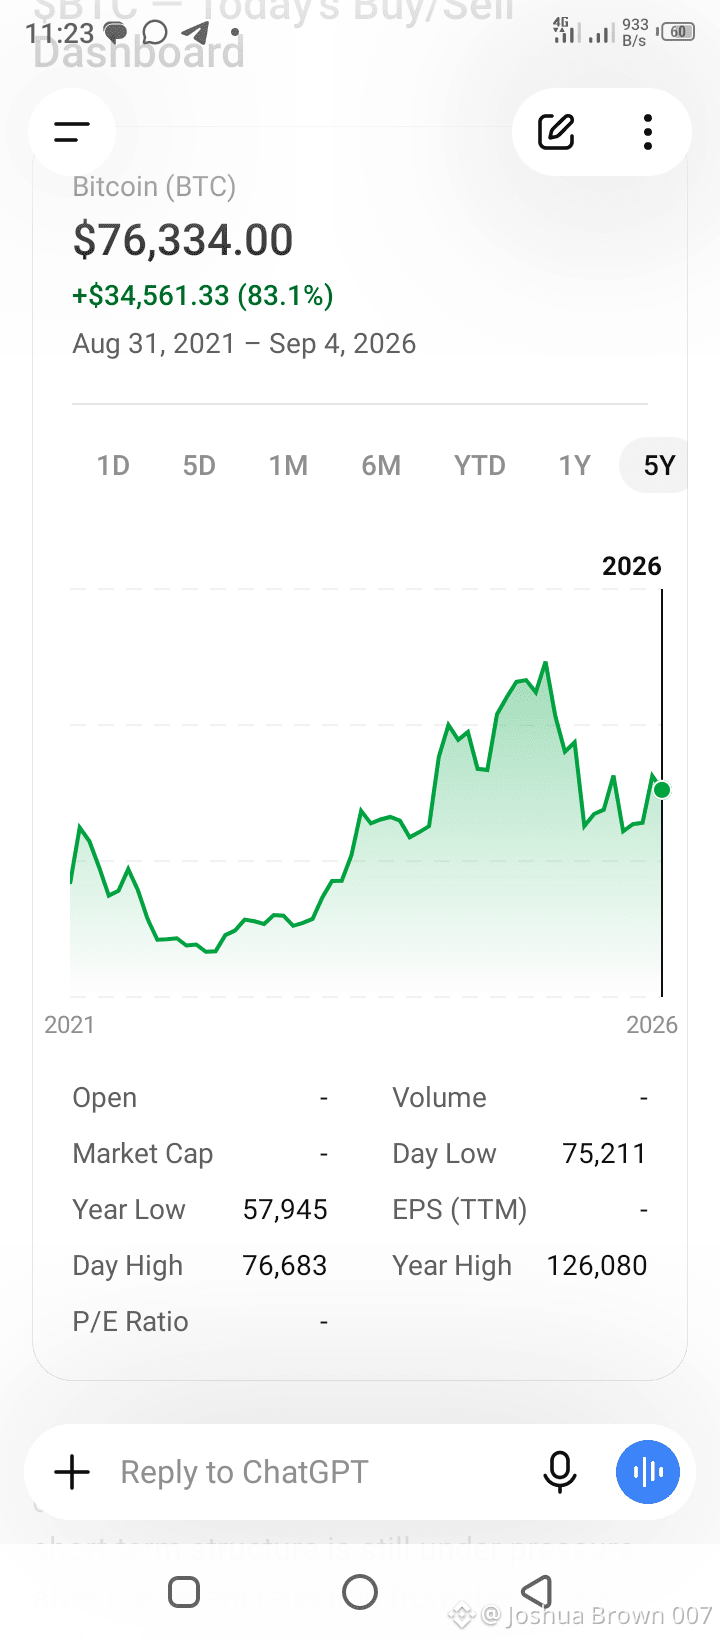
Most traders are ignoring Bitcoin's yearly cycle, even though the yearly cycle is highly supportive and helpful for your long term trade.
When you take trades in the short term on a smaller time frame, it only gives you a little profit. In contrast, when you take trades on a large time frame, that trade runs for a long time with less margin, resulting in a lot more profit.
I have created a setup based on this. Please look at that setup and let me know in the comments if you agree with my setup.
Swing Long Entry$73,000 – $75,000
SL $68,000
Take Profit 1 $85,000
Take Profit 2 $100,000
Confirmation Trigger monthly close above $78,000.
Short
Entry: If the price breaks below $70,000 with high volume.
Stop-Loss: $75,000.
Take Profit: $60,000, $57,945 (Year Low).
Invalidation Conditions
If the price breaks below $57,945 (Year Low), the macro bullish thesis is invalidated, and the market enters a deep bear phase.
If the price reclaims $100,000, the macro bearish thesis is invalidated, and a new bull market is confirmed.
$BTC
{spot}(BTCUSDT)
#btc70k
Most traders are ignoring Bitcoin's yearly cycle, even though the yearly cycle is highly supportive and helpful for your long term trade.
When you take trades in the short term on a smaller time frame, it only gives you a little profit. In contrast, when you take trades on a large time frame, that trade runs for a long time with less margin, resulting in a lot more profit.
I have created a setup based on this. Please look at that setup and let me know in the comments if you agree with my setup.
Swing Long Entry$73,000 – $75,000
SL $68,000
Take Profit 1 $85,000
Take Profit 2 $100,000
Confirmation Trigger monthly close above $78,000.
Short
Entry: If the price breaks below $70,000 with high volume.
Stop-Loss: $75,000.
Take Profit: $60,000, $57,945 (Year Low).
Invalidation Conditions
If the price breaks below $57,945 (Year Low), the macro bullish thesis is invalidated, and the market enters a deep bear phase.
If the price reclaims $100,000, the macro bearish thesis is invalidated, and a new bull market is confirmed.
$BTC
Most traders are ignoring Bitcoin's yearly cycle, even though the yearly cycle is highly supportive and helpful for your long term trade.
When you take trades in the short term on a smaller time frame, it only gives you a little profit. In contrast, when you take trades on a large time frame, that trade runs for a long time with less margin, resulting in a lot more profit.
I have created a setup based on this. Please look at that setup and let me know in the comments if you agree with my setup.
Swing Long Entry$73,000 – $75,000
SL $68,000
Take Profit 1 $85,000
Take Profit 2 $100,000
Confirmation Trigger monthly close above $78,000.
Short
Entry: If the price breaks below $70,000 with high volume.
Stop-Loss: $75,000.
Take Profit: $60,000, $57,945 (Year Low).
Invalidation Conditions
If the price breaks below $57,945 (Year Low), the macro bullish thesis is invalidated, and the market enters a deep bear phase.
If the price reclaims $100,000, the macro bearish thesis is invalidated, and a new bull market is confirmed.
$BTC
61
·
--
Story in brief- 2009 - Satoshi Nakamoto releases the Genesis Block (the first block)
- 2010 - Pizza Day: 10,000 bitcoins = two pizzas; the most expensive pizza today is worth $880 million!
- 2012 - First halving; the reward drops from 50 to 25 bitcoins
- 2017 - First time it reached 20 thousand
- 2021 - Old all-time high: 69 thousand
- 2024 - Approval of ETF funds in the US + the fourth halving
Story in brief
- 2009 - Satoshi Nakamoto releases the Genesis Block (the first block)
- 2010 - Pizza Day: 10,000 bitcoins = two pizzas; the most expensive pizza today is worth $880 million!
- 2012 - First halving; the reward drops from 50 to 25 bitcoins
- 2017 - First time it reached 20 thousand
- 2021 - Old all-time high: 69 thousand
- 2024 - Approval of ETF funds in the US + the fourth halving
- 2010 - Pizza Day: 10,000 bitcoins = two pizzas; the most expensive pizza today is worth $880 million!
- 2012 - First halving; the reward drops from 50 to 25 bitcoins
- 2017 - First time it reached 20 thousand
- 2021 - Old all-time high: 69 thousand
- 2024 - Approval of ETF funds in the US + the fourth halving
85
#BTC☀️
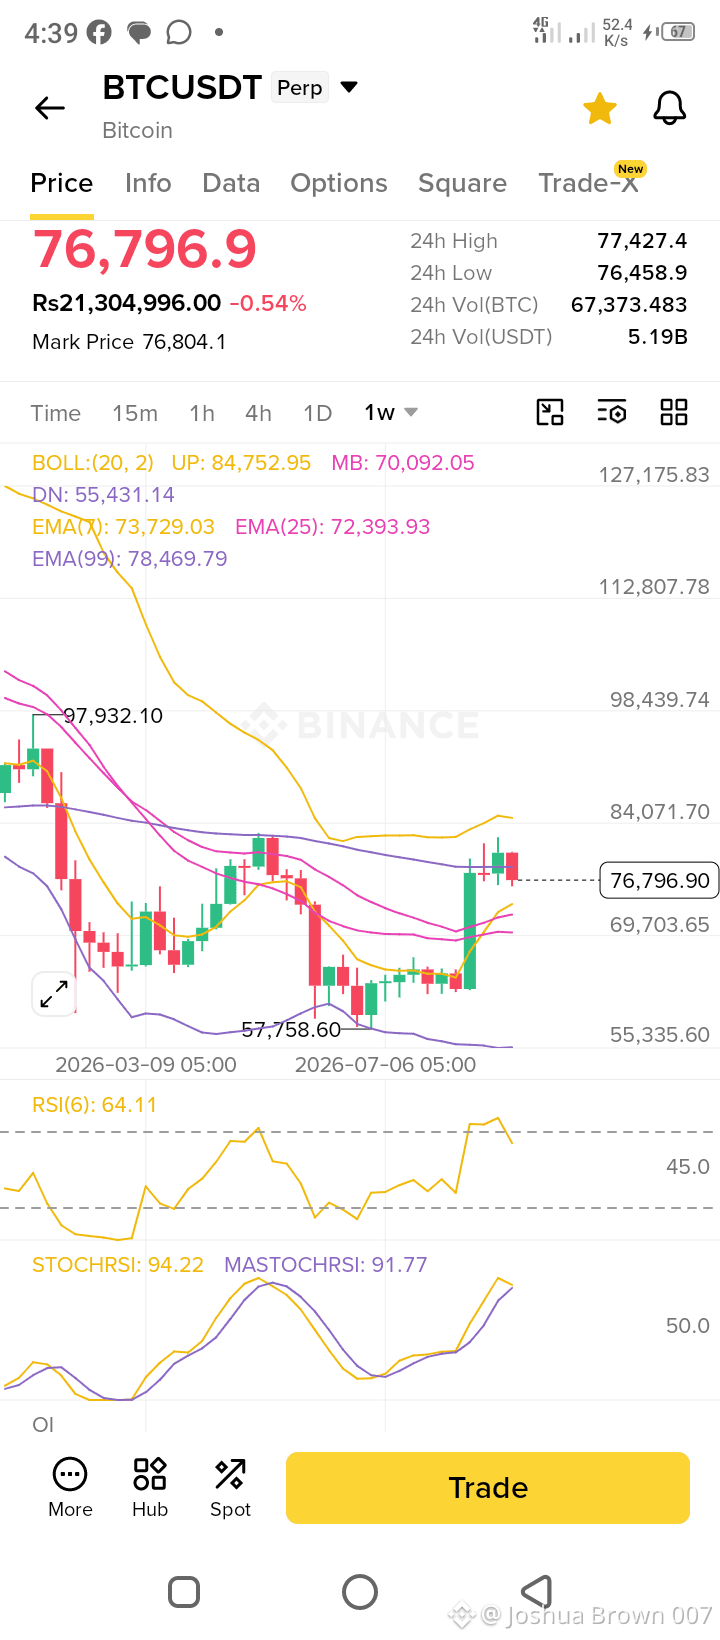
BTCUSDT has established a strong medium term bullish reversal, reclaiming key weekly EMAs. However, overbought oscillators on the weekly timeframe signal an imminent short term pullback or consolidation. The highest probability play is to wait for a retracement to the EMA7 (73,700–74,500) to enter long, targeting the EMA99 at 78,469 and the Bollinger Upper Band at 84,752. Risk is elevated due to overbought conditions, so strict stop loss management is essential.
The weekly StochRSI is at 94, which historically precedes a multi week consolidation or pullback in 70,000–72,400 is a strong weekly demand zone (Order Block) where institutional buying likely occurred during the reversal.BTC. Do not chase the top.
The weekly candle close is critical. A close above 76,000 confirms bullish continuation.
Trade Plane:
Entry swing long 73,700–74,500
SL 71,800
TP 78,400 and 84,000
70,000–72,400 is a strong weekly demand zone (Order Block) where institutional buying likely occurred during the reversal.
$BTC
{future}(BTCUSDT)
$DOGE
{future}(DOGEUSDT)
$XRP
{future}(XRPUSDT)
#AnthropicCEOCallsForAISlowdown #AnthropicChoosesNasdaqForPotentialIPO #btc70k
#BTC☀️
BTCUSDT has established a strong medium term bullish reversal, reclaiming key weekly EMAs. However, overbought oscillators on the weekly timeframe signal an imminent short term pullback or consolidation. The highest probability play is to wait for a retracement to the EMA7 (73,700–74,500) to enter long, targeting the EMA99 at 78,469 and the Bollinger Upper Band at 84,752. Risk is elevated due to overbought conditions, so strict stop loss management is essential.
The weekly StochRSI is at 94, which historically precedes a multi week consolidation or pullback in 70,000–72,400 is a strong weekly demand zone (Order Block) where institutional buying likely occurred during the reversal.BTC. Do not chase the top.
The weekly candle close is critical. A close above 76,000 confirms bullish continuation.
Trade Plane:
Entry swing long 73,700–74,500
SL 71,800
TP 78,400 and 84,000
70,000–72,400 is a strong weekly demand zone (Order Block) where institutional buying likely occurred during the reversal.
$BTC
$DOGE
$XRP
#AnthropicCEOCallsForAISlowdown #AnthropicChoosesNasdaqForPotentialIPO #btc70k
BTCUSDT has established a strong medium term bullish reversal, reclaiming key weekly EMAs. However, overbought oscillators on the weekly timeframe signal an imminent short term pullback or consolidation. The highest probability play is to wait for a retracement to the EMA7 (73,700–74,500) to enter long, targeting the EMA99 at 78,469 and the Bollinger Upper Band at 84,752. Risk is elevated due to overbought conditions, so strict stop loss management is essential.
The weekly StochRSI is at 94, which historically precedes a multi week consolidation or pullback in 70,000–72,400 is a strong weekly demand zone (Order Block) where institutional buying likely occurred during the reversal.BTC. Do not chase the top.
The weekly candle close is critical. A close above 76,000 confirms bullish continuation.
Trade Plane:
Entry swing long 73,700–74,500
SL 71,800
TP 78,400 and 84,000
70,000–72,400 is a strong weekly demand zone (Order Block) where institutional buying likely occurred during the reversal.
$BTC
$DOGE
$XRP
#AnthropicCEOCallsForAISlowdown #AnthropicChoosesNasdaqForPotentialIPO #btc70k
101

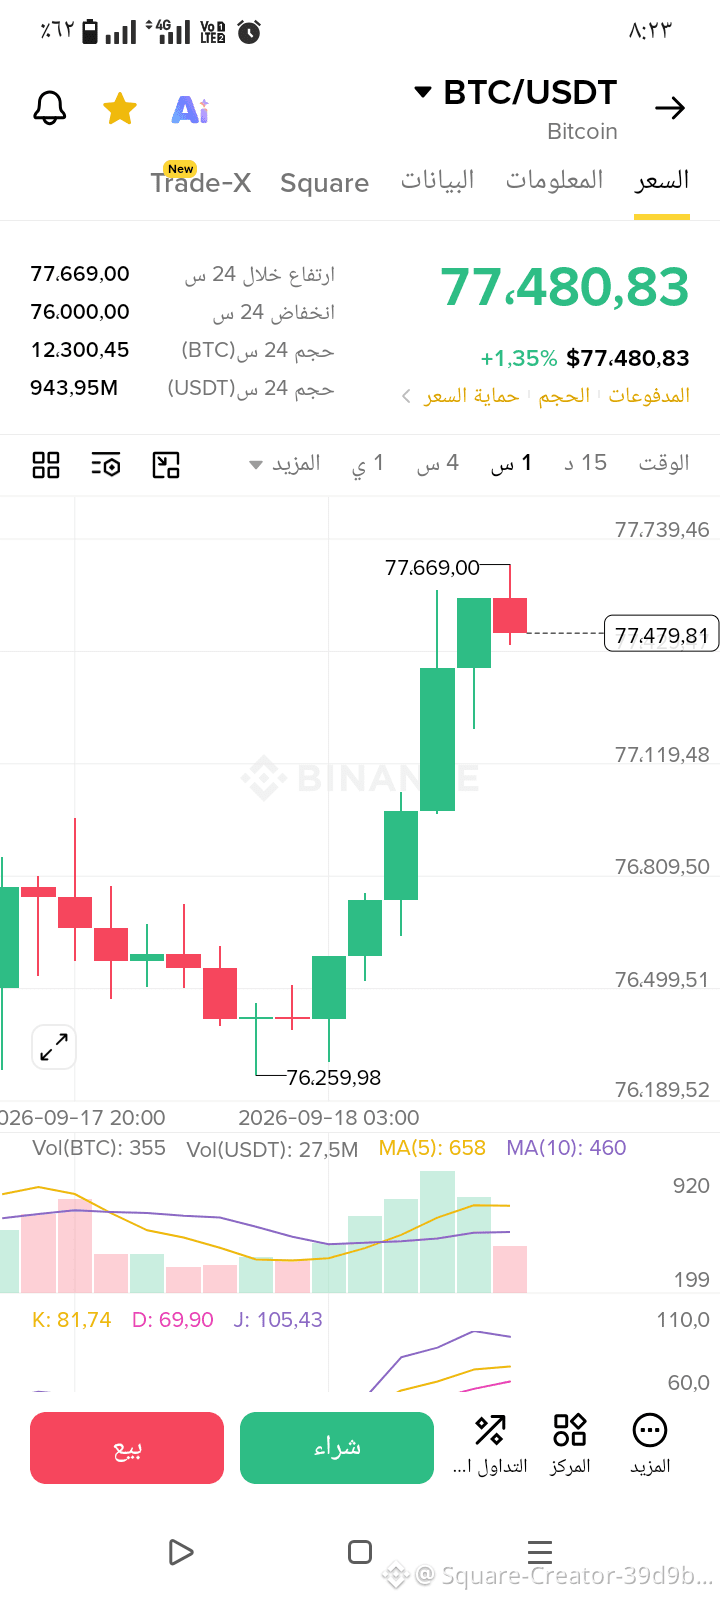
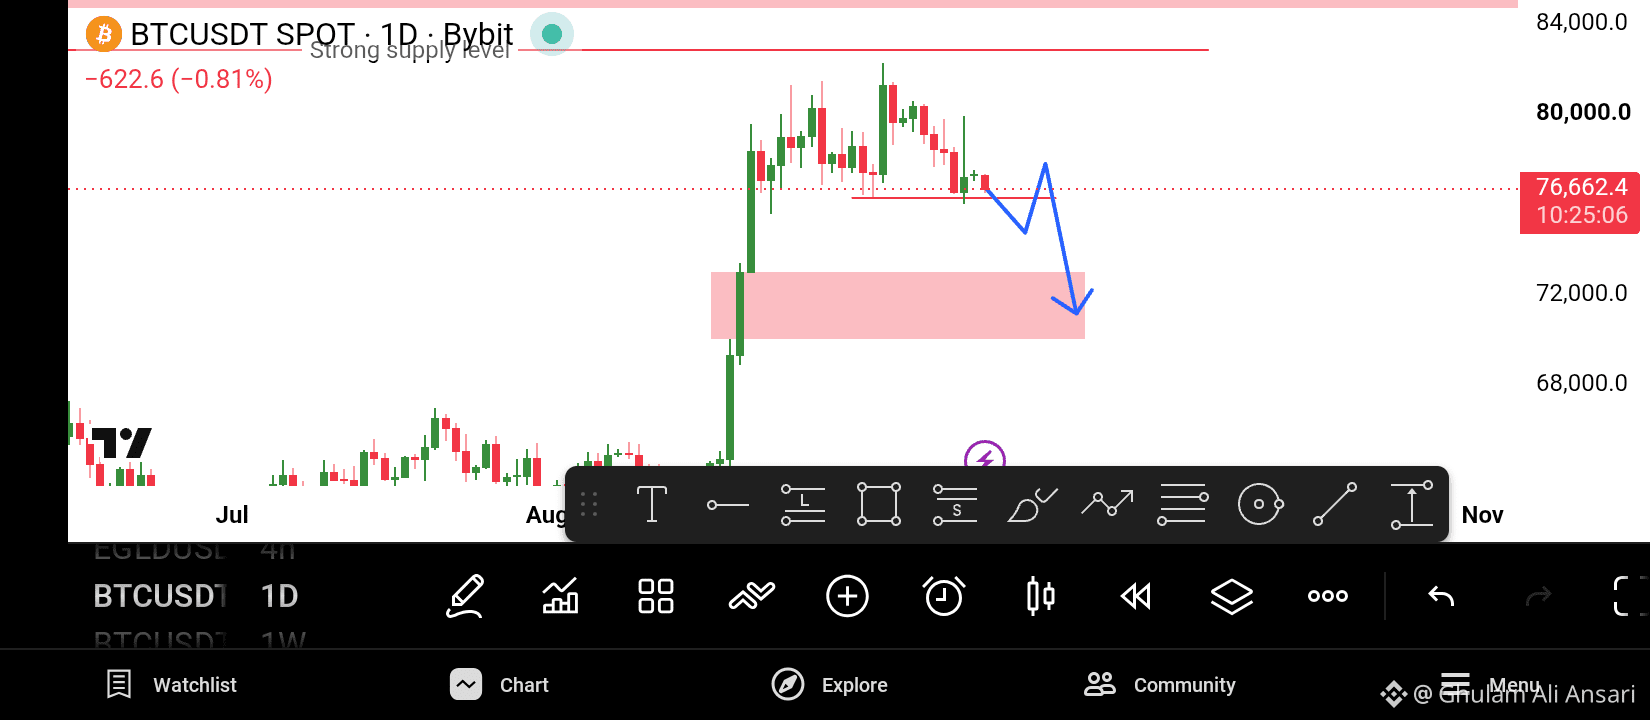
$BTC trade around $76700.if $BTC close weekly candle below 76270$ then we see btc going to 70000$ level. let's see what reaction btc show on 76270$ level.
{spot}(BTCUSDT)
{spot}(LSKUSDT)
#btc70k #Write2Earn!
$BTC trade around $76700.if $BTC close weekly candle below 76270$ then we see btc going to 70000$ level. let's see what reaction btc show on 76270$ level.
#btc70k #Write2Earn!
#btc70k #Write2Earn!
1
184

·
--
Bullish
Updated after today's drop below $77k - next week bias shifted more bearish.
*Right now:*
- $BTC $76,535 - $76,783 today, down 2.23% 24h after hot US producer inflation + Fed hike fears. High $78,530 to low $76,450 today.
*Bearish case for next week (60% prob right now):*
- Fed CPI today + decision Sep 15-16, market pricing 57% chance hike - higher rates = risk-off for BTC
- Lost 50-week SMA $80,382 that was support. Next supports: 200-day EMA $72,541, 50-day $71,135, then $70k psychological, then $66,500 / $62,300
- Polymarket: >$80k only 5.5% chance, >$76k 81% - traders betting low
- RSI easing from 72 overbought to 62, MACD turning negative = momentum fading
*Bullish case (40% prob):*
- If $BTC can reclaim $77,265 and close above $80,382 again, then targets $85k resistance, then $87,599 and $89,175
- Weekly RSI still above 50 at 59, bullish crossover from July still intact
- Golden cross near - 50-day near $72k, if holds it can bounce
*What to watch next week:*
- *Resistance:* $77,287 (6h high) → $78,530 (today's high) → $80,382 → $85k
- *Support:* $76,450 (today's low) → $72,500 cluster → $70k
Most likely: *choppy/bearish consolidation $70k-$78k* until Fed decision. Break below $75,674 risks deeper flush to $71k. Break above $80,382 flips bullish to $85k.
#BTC #BTC走势分析 #btc70k
{future}(BTCUSDT)
Updated after today's drop below $77k - next week bias shifted more bearish.
*Right now:*
- $BTC $76,535 - $76,783 today, down 2.23% 24h after hot US producer inflation + Fed hike fears. High $78,530 to low $76,450 today.
*Bearish case for next week (60% prob right now):*
- Fed CPI today + decision Sep 15-16, market pricing 57% chance hike - higher rates = risk-off for BTC
- Lost 50-week SMA $80,382 that was support. Next supports: 200-day EMA $72,541, 50-day $71,135, then $70k psychological, then $66,500 / $62,300
- Polymarket: >$80k only 5.5% chance, >$76k 81% - traders betting low
- RSI easing from 72 overbought to 62, MACD turning negative = momentum fading
*Bullish case (40% prob):*
- If $BTC can reclaim $77,265 and close above $80,382 again, then targets $85k resistance, then $87,599 and $89,175
- Weekly RSI still above 50 at 59, bullish crossover from July still intact
- Golden cross near - 50-day near $72k, if holds it can bounce
*What to watch next week:*
- *Resistance:* $77,287 (6h high) → $78,530 (today's high) → $80,382 → $85k
- *Support:* $76,450 (today's low) → $72,500 cluster → $70k
Most likely: *choppy/bearish consolidation $70k-$78k* until Fed decision. Break below $75,674 risks deeper flush to $71k. Break above $80,382 flips bullish to $85k.
#BTC #BTC走势分析 #btc70k
*Right now:*
- $BTC $76,535 - $76,783 today, down 2.23% 24h after hot US producer inflation + Fed hike fears. High $78,530 to low $76,450 today.
*Bearish case for next week (60% prob right now):*
- Fed CPI today + decision Sep 15-16, market pricing 57% chance hike - higher rates = risk-off for BTC
- Lost 50-week SMA $80,382 that was support. Next supports: 200-day EMA $72,541, 50-day $71,135, then $70k psychological, then $66,500 / $62,300
- Polymarket: >$80k only 5.5% chance, >$76k 81% - traders betting low
- RSI easing from 72 overbought to 62, MACD turning negative = momentum fading
*Bullish case (40% prob):*
- If $BTC can reclaim $77,265 and close above $80,382 again, then targets $85k resistance, then $87,599 and $89,175
- Weekly RSI still above 50 at 59, bullish crossover from July still intact
- Golden cross near - 50-day near $72k, if holds it can bounce
*What to watch next week:*
- *Resistance:* $77,287 (6h high) → $78,530 (today's high) → $80,382 → $85k
- *Support:* $76,450 (today's low) → $72,500 cluster → $70k
Most likely: *choppy/bearish consolidation $70k-$78k* until Fed decision. Break below $75,674 risks deeper flush to $71k. Break above $80,382 flips bullish to $85k.
#BTC #BTC走势分析 #btc70k
1
71

$BTC
Without lying, Bitcoin will no longer go down and it will go to the moon up to +100,000$ by the end of the year.
$BTC
{future}(BTCUSDT)
#btc70k $BTC
$BTC
Without lying, Bitcoin will no longer go down and it will go to the moon up to +100,000$ by the end of the year.
$BTC
#btc70k $BTC
Without lying, Bitcoin will no longer go down and it will go to the moon up to +100,000$ by the end of the year.
$BTC
#btc70k $BTC
496

·
--
Bearish
#ShareYourThoughtOnBTC BEARISH? 📉
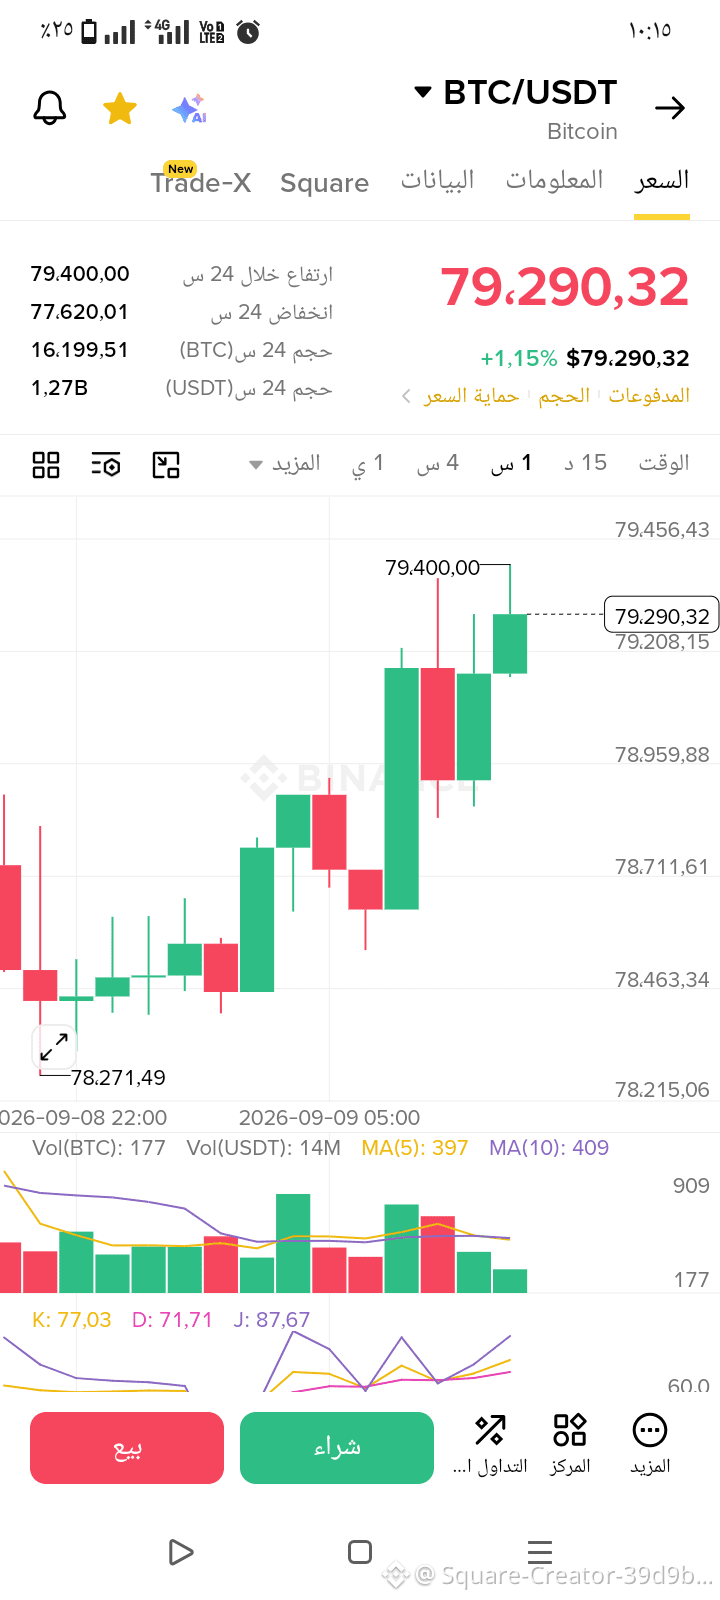
BTC is near $78K.
🔴 Below $77K → downside possible
🎯 $76K → $73K → $70K
🐻 Bearish until BTC reclaims resistance.
What’s your call? 👇
🔴 Bearish or 🟢 Bullish?
⚠️ NFA. Manage your risk.
$BTC #btc70k #BTC
{spot}(BTCUSDT)
#ShareYourThoughtOnBTC BEARISH? 📉
BTC is near $78K.
🔴 Below $77K → downside possible
🎯 $76K → $73K → $70K
🐻 Bearish until BTC reclaims resistance.
What’s your call? 👇
🔴 Bearish or 🟢 Bullish?
⚠️ NFA. Manage your risk.
$BTC #btc70k #BTC
BTC is near $78K.
🔴 Below $77K → downside possible
🎯 $76K → $73K → $70K
🐻 Bearish until BTC reclaims resistance.
What’s your call? 👇
🔴 Bearish or 🟢 Bullish?
⚠️ NFA. Manage your risk.
$BTC #btc70k #BTC
57

I expected the rebound to fade around $85K–$90K.
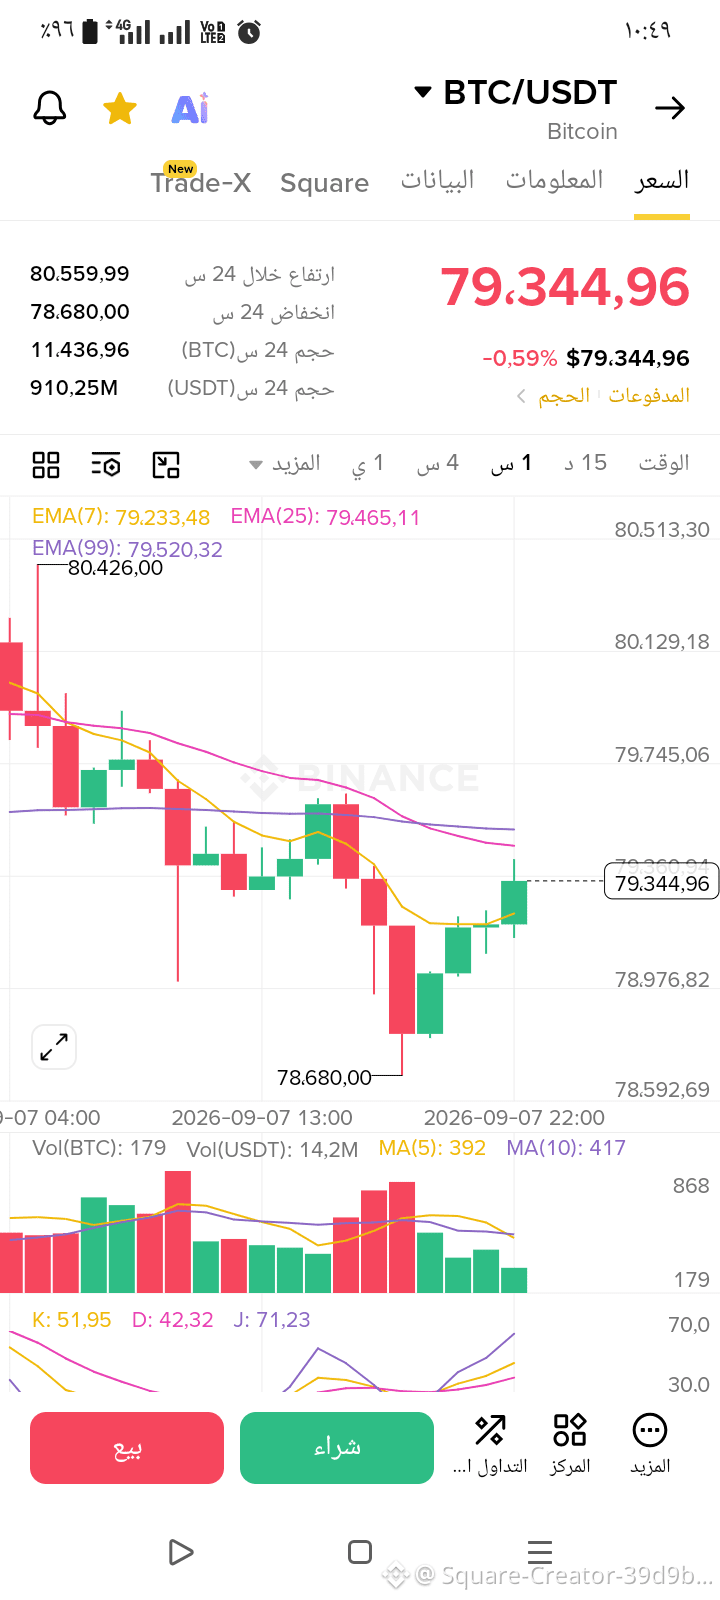
But $BTC Bitcoin has now spent nearly a week consolidating instead of breaking down.
That changes the picture. 👀
When price refuses to fall after a strong move, it can mean sellers are losing control and buyers are quietly absorbing the pressure.
The next breakout could decide the direction.
#BTC #btc70k #BTC突破7万大关 #BTC☀️
I expected the rebound to fade around $85K–$90K.
But $BTC Bitcoin has now spent nearly a week consolidating instead of breaking down.
That changes the picture. 👀
When price refuses to fall after a strong move, it can mean sellers are losing control and buyers are quietly absorbing the pressure.
The next breakout could decide the direction.
#BTC #btc70k #BTC突破7万大关 #BTC☀️
But $BTC Bitcoin has now spent nearly a week consolidating instead of breaking down.
That changes the picture. 👀
When price refuses to fall after a strong move, it can mean sellers are losing control and buyers are quietly absorbing the pressure.
The next breakout could decide the direction.
#BTC #btc70k #BTC突破7万大关 #BTC☀️
114

·
--
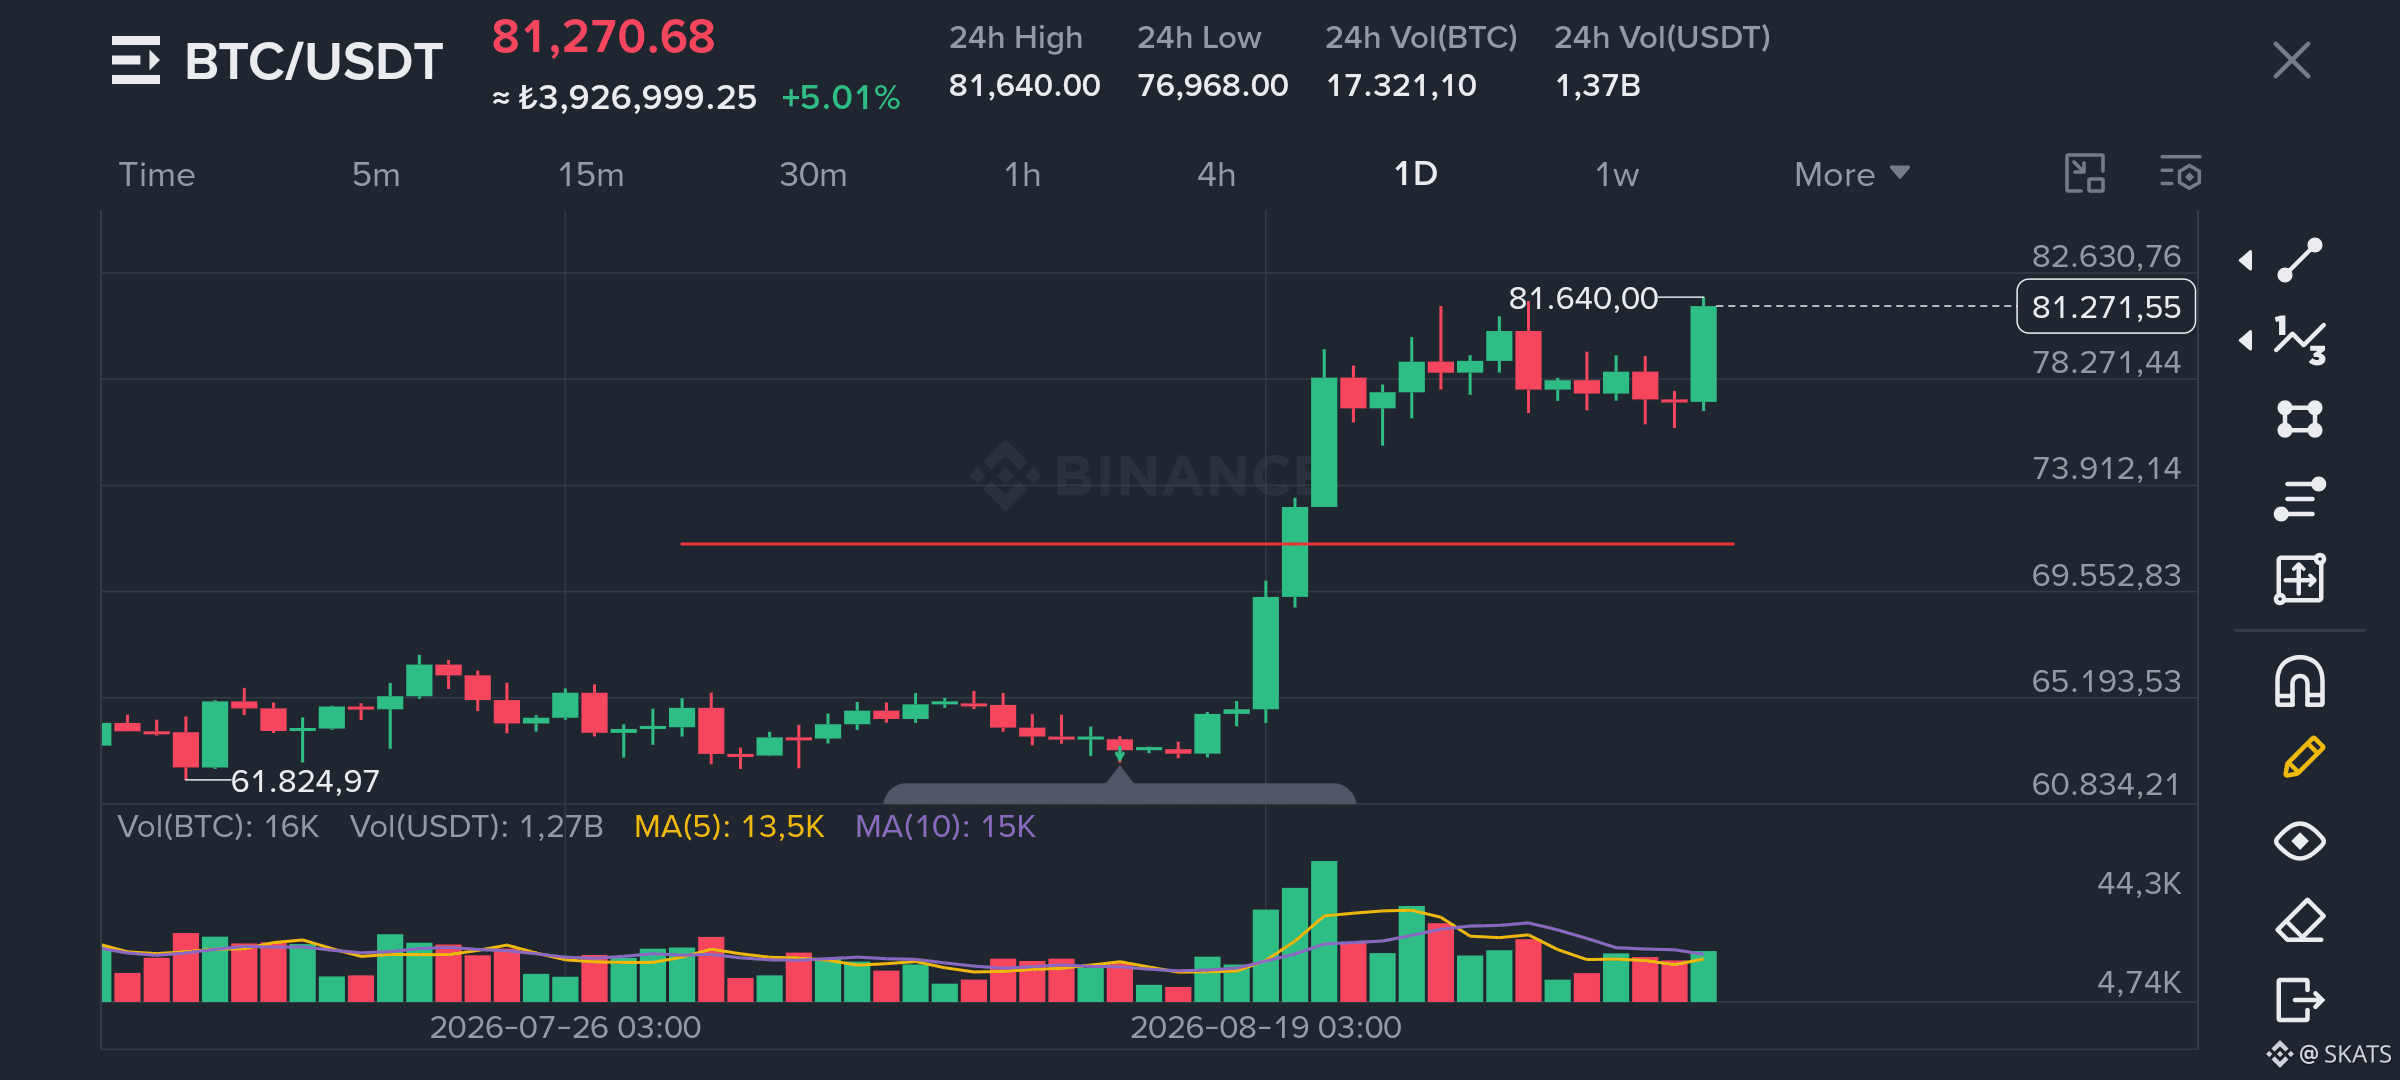
BTC is back around $81K.
And honestly, even though the chart looks like it’s telling us something strong, I’m still looking somewhere else.
Because sometimes price goes up while the market itself doesn’t get stronger.
Sometimes expectations simply move faster than reality.
The price we’re seeing today doesn’t tell me that the world has actually become more comfortable.
If anything, there are still too many unresolved things around us. That’s why I still think BTC finding a stronger base somewhere around $65K–$70K would make more sense to me.
I could be wrong.
But for me, the real question isn’t whether $81K can be reached.
It’s how much real strength is behind that price.
Bitcoin moving higher is the easy part.
The harder part is building a lasting story above those levels while the rest of the world still looks this fragile.
I’m not against the move higher.
I just don’t believe yet that the story told by the price and the story told by the world are the same.
And sometimes the most dangerous thing isn’t a wrong price.
It’s a price that looks right enough to make us feel confident at the wrong time $BTC
#BTC65K #BTC70K #TufanSalur
{spot}(BTCUSDT)
BTC is back around $81K.
And honestly, even though the chart looks like it’s telling us something strong, I’m still looking somewhere else.
Because sometimes price goes up while the market itself doesn’t get stronger.
Sometimes expectations simply move faster than reality.
The price we’re seeing today doesn’t tell me that the world has actually become more comfortable.
If anything, there are still too many unresolved things around us. That’s why I still think BTC finding a stronger base somewhere around $65K–$70K would make more sense to me.
I could be wrong.
But for me, the real question isn’t whether $81K can be reached.
It’s how much real strength is behind that price.
Bitcoin moving higher is the easy part.
The harder part is building a lasting story above those levels while the rest of the world still looks this fragile.
I’m not against the move higher.
I just don’t believe yet that the story told by the price and the story told by the world are the same.
And sometimes the most dangerous thing isn’t a wrong price.
It’s a price that looks right enough to make us feel confident at the wrong time $BTC
#BTC65K #BTC70K #TufanSalur
And honestly, even though the chart looks like it’s telling us something strong, I’m still looking somewhere else.
Because sometimes price goes up while the market itself doesn’t get stronger.
Sometimes expectations simply move faster than reality.
The price we’re seeing today doesn’t tell me that the world has actually become more comfortable.
If anything, there are still too many unresolved things around us. That’s why I still think BTC finding a stronger base somewhere around $65K–$70K would make more sense to me.
I could be wrong.
But for me, the real question isn’t whether $81K can be reached.
It’s how much real strength is behind that price.
Bitcoin moving higher is the easy part.
The harder part is building a lasting story above those levels while the rest of the world still looks this fragile.
I’m not against the move higher.
I just don’t believe yet that the story told by the price and the story told by the world are the same.
And sometimes the most dangerous thing isn’t a wrong price.
It’s a price that looks right enough to make us feel confident at the wrong time $BTC
#BTC65K #BTC70K #TufanSalur
1
2
837

·
--
Haha, $BTC and $ETH short positions are ready to be unwound
BTC has been holding from 63,500 until now, with two additional positions added in between. Since shorts were dared at the low levels, what reason is there not to continue shorting at the high levels?
Sometimes focusing on just one direction is easier to win. Bitcoin and Ethereum have been oscillating at high levels recently. If you close shorts to go long, you might get trapped on both ends, which can more easily affect your mindset.
Unless there is a major reversal and Bitcoin and Ethereum spiral upwards, breaking through $100,000 directly, unwinding the 70,000 short positions is just a matter of time.
Besides, if it really dares to rise, I still have pending orders above to continue adding positions, and I have no plans to cancel them for now.
#BTC走势分析 #btc70k
Haha, $BTC and $ETH short positions are ready to be unwound
BTC has been holding from 63,500 until now, with two additional positions added in between. Since shorts were dared at the low levels, what reason is there not to continue shorting at the high levels?
Sometimes focusing on just one direction is easier to win. Bitcoin and Ethereum have been oscillating at high levels recently. If you close shorts to go long, you might get trapped on both ends, which can more easily affect your mindset.
Unless there is a major reversal and Bitcoin and Ethereum spiral upwards, breaking through $100,000 directly, unwinding the 70,000 short positions is just a matter of time.
Besides, if it really dares to rise, I still have pending orders above to continue adding positions, and I have no plans to cancel them for now.
#BTC走势分析 #btc70k
BTC has been holding from 63,500 until now, with two additional positions added in between. Since shorts were dared at the low levels, what reason is there not to continue shorting at the high levels?
Sometimes focusing on just one direction is easier to win. Bitcoin and Ethereum have been oscillating at high levels recently. If you close shorts to go long, you might get trapped on both ends, which can more easily affect your mindset.
Unless there is a major reversal and Bitcoin and Ethereum spiral upwards, breaking through $100,000 directly, unwinding the 70,000 short positions is just a matter of time.
Besides, if it really dares to rise, I still have pending orders above to continue adding positions, and I have no plans to cancel them for now.
#BTC走势分析 #btc70k
109

·
--
$BITCOIN
{alpha}(10x72e4f9f808c49a2a61de9c5896298920dc4eeea9)
coin is trading around the $78K–$79K area as September begins, with the market showing mixed sentiment rather than a clear one-way trend.
Key BTC headlines
Bitcoin ETF flows turned negative: U.S. spot Bitcoin ETFs recorded about $201.9M in net outflows on August 28, ending a nine-day inflow streak. This is important because ETF flows are closely watched as a measure of institutional demand.
Corporate BTC activity remains active: moved 1,600 BTC to newly created wallets. No official reason was disclosed, so this should be treated as an on-chain activity update rather than a confirmed buy or sell signal.
Macro uncertainty is influencing crypto: Expectations around interest rates, inflation, bond yields, and geopolitical risk are keeping investors cautious. Bitcoin often reacts to these conditions because they affect appetite for higher-risk assets.
Market remains resilient after August strength: BTC had rallied strongly in August and is now consolidating below recent highs. A consolidation phase can mean buyers and sellers are reassessing the next major catalyst; it does not confirm the next direction by itself.
What this means for the market
The positive side is that institutional interest and corporate Bitcoin activity are still visible. The risk side is that ETF outflows and tighter macro expectations can reduce short-term demand. BTC’s next move may depend heavily on whether ETF flows stabilize, broader financial markets remain calm, and liquidity returns to crypto.
In short: Bitcoin is still one of the strongest assets in crypto by institutional attention, but short-term conditions are mixed and volatility can remain high.
#BTC #btc70k #BTC☀ #BTC70K✈️
$BITCOIN
coin is trading around the $78K–$79K area as September begins, with the market showing mixed sentiment rather than a clear one-way trend.
Key BTC headlines
Bitcoin ETF flows turned negative: U.S. spot Bitcoin ETFs recorded about $201.9M in net outflows on August 28, ending a nine-day inflow streak. This is important because ETF flows are closely watched as a measure of institutional demand.
Corporate BTC activity remains active: moved 1,600 BTC to newly created wallets. No official reason was disclosed, so this should be treated as an on-chain activity update rather than a confirmed buy or sell signal.
Macro uncertainty is influencing crypto: Expectations around interest rates, inflation, bond yields, and geopolitical risk are keeping investors cautious. Bitcoin often reacts to these conditions because they affect appetite for higher-risk assets.
Market remains resilient after August strength: BTC had rallied strongly in August and is now consolidating below recent highs. A consolidation phase can mean buyers and sellers are reassessing the next major catalyst; it does not confirm the next direction by itself.
What this means for the market
The positive side is that institutional interest and corporate Bitcoin activity are still visible. The risk side is that ETF outflows and tighter macro expectations can reduce short-term demand. BTC’s next move may depend heavily on whether ETF flows stabilize, broader financial markets remain calm, and liquidity returns to crypto.
In short: Bitcoin is still one of the strongest assets in crypto by institutional attention, but short-term conditions are mixed and volatility can remain high.
#BTC #btc70k #BTC☀ #BTC70K✈️
coin is trading around the $78K–$79K area as September begins, with the market showing mixed sentiment rather than a clear one-way trend.
Key BTC headlines
Bitcoin ETF flows turned negative: U.S. spot Bitcoin ETFs recorded about $201.9M in net outflows on August 28, ending a nine-day inflow streak. This is important because ETF flows are closely watched as a measure of institutional demand.
Corporate BTC activity remains active: moved 1,600 BTC to newly created wallets. No official reason was disclosed, so this should be treated as an on-chain activity update rather than a confirmed buy or sell signal.
Macro uncertainty is influencing crypto: Expectations around interest rates, inflation, bond yields, and geopolitical risk are keeping investors cautious. Bitcoin often reacts to these conditions because they affect appetite for higher-risk assets.
Market remains resilient after August strength: BTC had rallied strongly in August and is now consolidating below recent highs. A consolidation phase can mean buyers and sellers are reassessing the next major catalyst; it does not confirm the next direction by itself.
What this means for the market
The positive side is that institutional interest and corporate Bitcoin activity are still visible. The risk side is that ETF outflows and tighter macro expectations can reduce short-term demand. BTC’s next move may depend heavily on whether ETF flows stabilize, broader financial markets remain calm, and liquidity returns to crypto.
In short: Bitcoin is still one of the strongest assets in crypto by institutional attention, but short-term conditions are mixed and volatility can remain high.
#BTC #btc70k #BTC☀ #BTC70K✈️
1
93

·
--
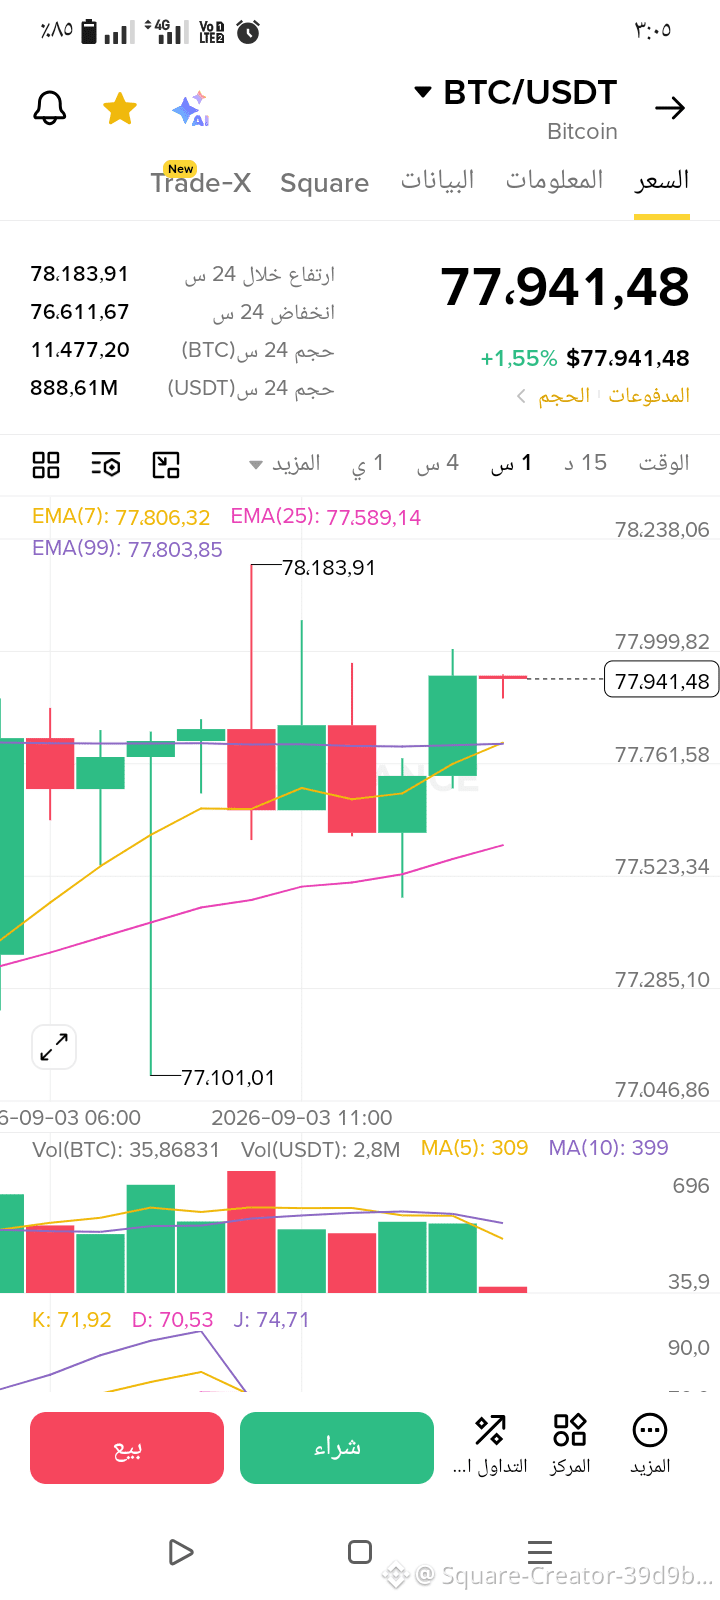
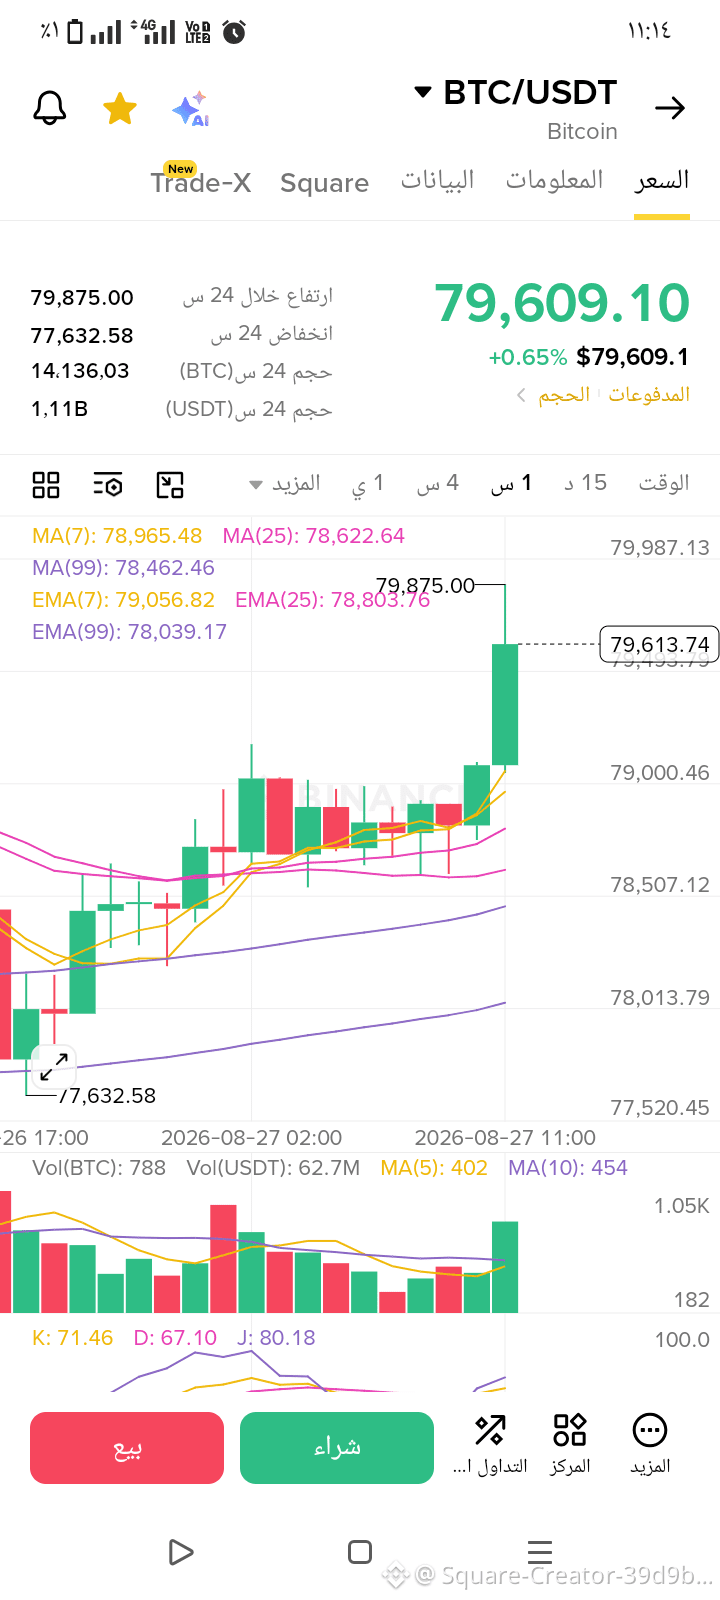
🚀 Bitcoin is in a very strong uptrend today! 🔥
Focus on $80,000 🎯
The buying momentum is clear and the move is strong—stay fast and seize the opportunity.
💰 Take your profit step by step and get out safely—no greed.
Come on, let’s go champions 🚀🔥$BTC
{spot}(BTCUSDT)
#btc70k #BTC走势分析 #BinanceHerYerde
🚀 Bitcoin is in a very strong uptrend today! 🔥
Focus on $80,000 🎯
The buying momentum is clear and the move is strong—stay fast and seize the opportunity.
💰 Take your profit step by step and get out safely—no greed.
Come on, let’s go champions 🚀🔥$BTC
#btc70k #BTC走势分析 #BinanceHerYerde
Focus on $80,000 🎯
The buying momentum is clear and the move is strong—stay fast and seize the opportunity.
💰 Take your profit step by step and get out safely—no greed.
Come on, let’s go champions 🚀🔥$BTC
#btc70k #BTC走势分析 #BinanceHerYerde
4
1.5k

·
--
Bullish
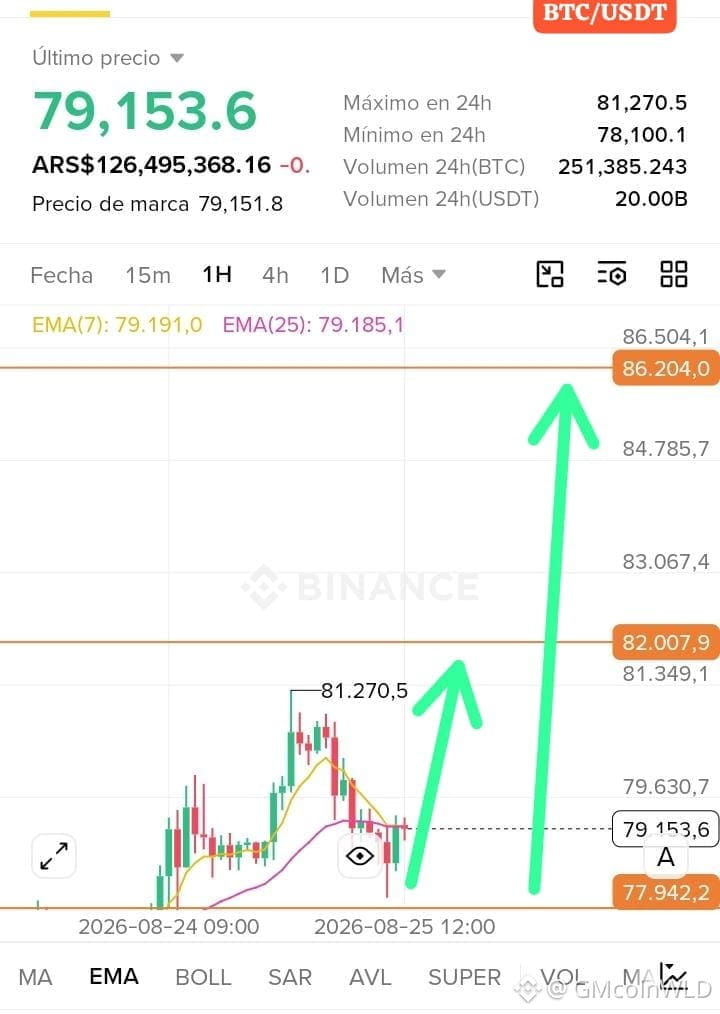
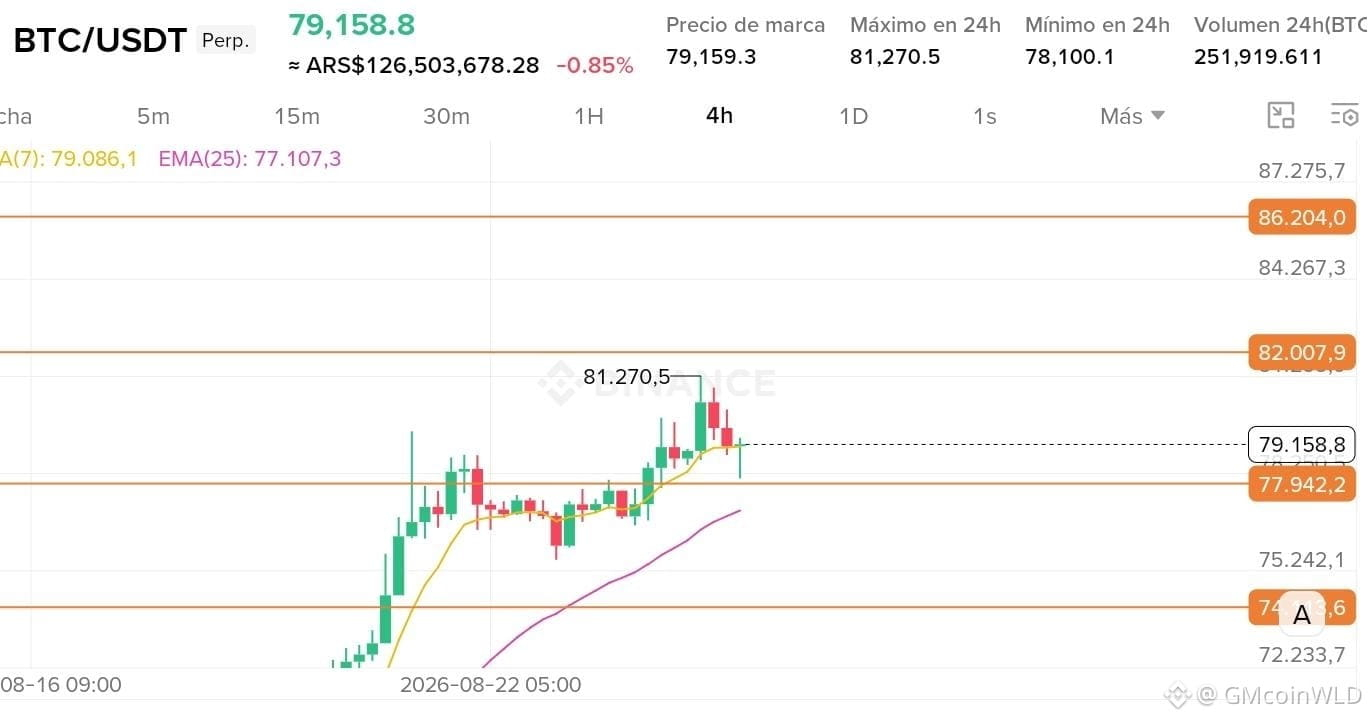
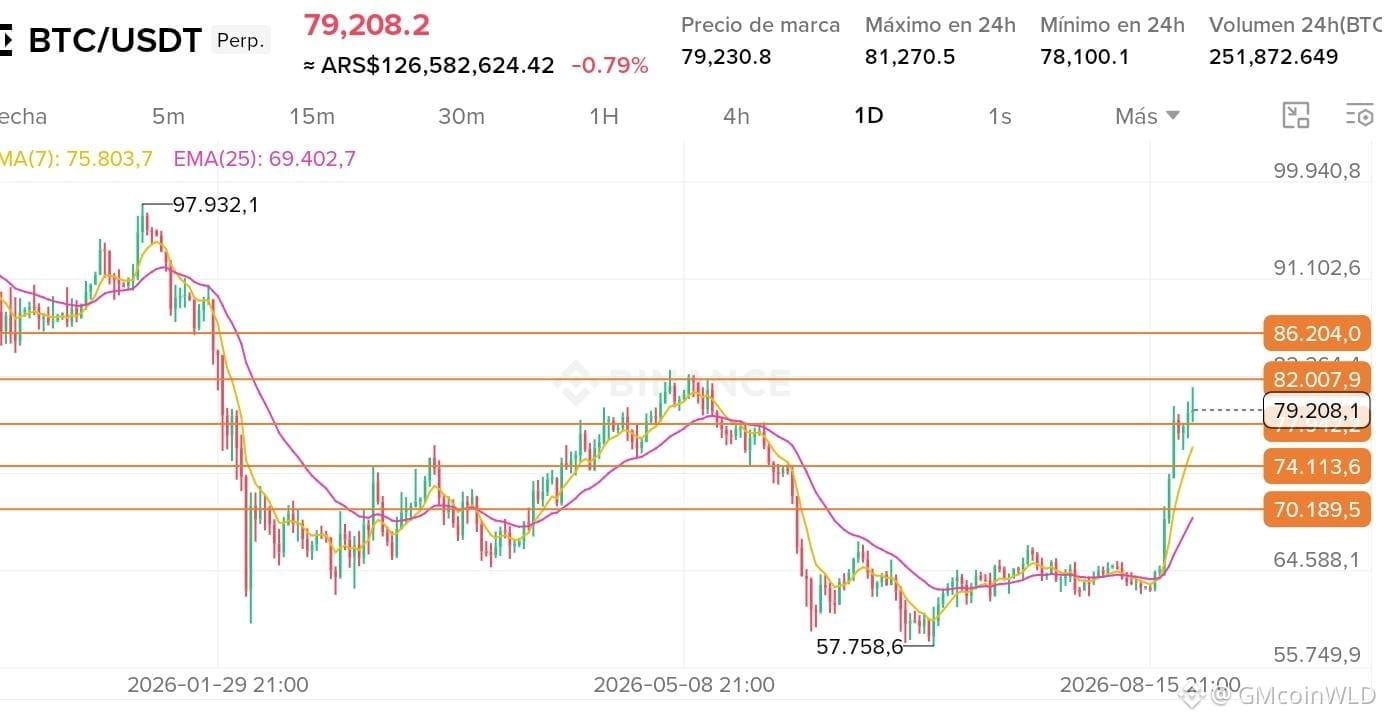
$BTC #btc70k Btc is setting a record!!!!
It looks like the $78 or $87 million that was injected is done intelligently!!!
If it breaks $86!! It’s already a range for it to go to $100 thousand!! 📈✅
{future}(BTCUSDT)
$BTC #btc70k Btc is setting a record!!!!
It looks like the $78 or $87 million that was injected is done intelligently!!!
If it breaks $86!! It’s already a range for it to go to $100 thousand!! 📈✅
It looks like the $78 or $87 million that was injected is done intelligently!!!
If it breaks $86!! It’s already a range for it to go to $100 thousand!! 📈✅
667
·
--
Bullish
#btc70k $BTC The strong Bitcoin rally surged over 20% in just a few days, reaching its highest level since May as it traded above US$ 77,000. This vertical rebound was driven directly by a combination of macroeconomic liquidity factors and a strong regulatory push in the United States
{spot}(BTCUSDT)
#btc70k $BTC The strong Bitcoin rally surged over 20% in just a few days, reaching its highest level since May as it traded above US$ 77,000. This vertical rebound was driven directly by a combination of macroeconomic liquidity factors and a strong regulatory push in the United States

44

·
--
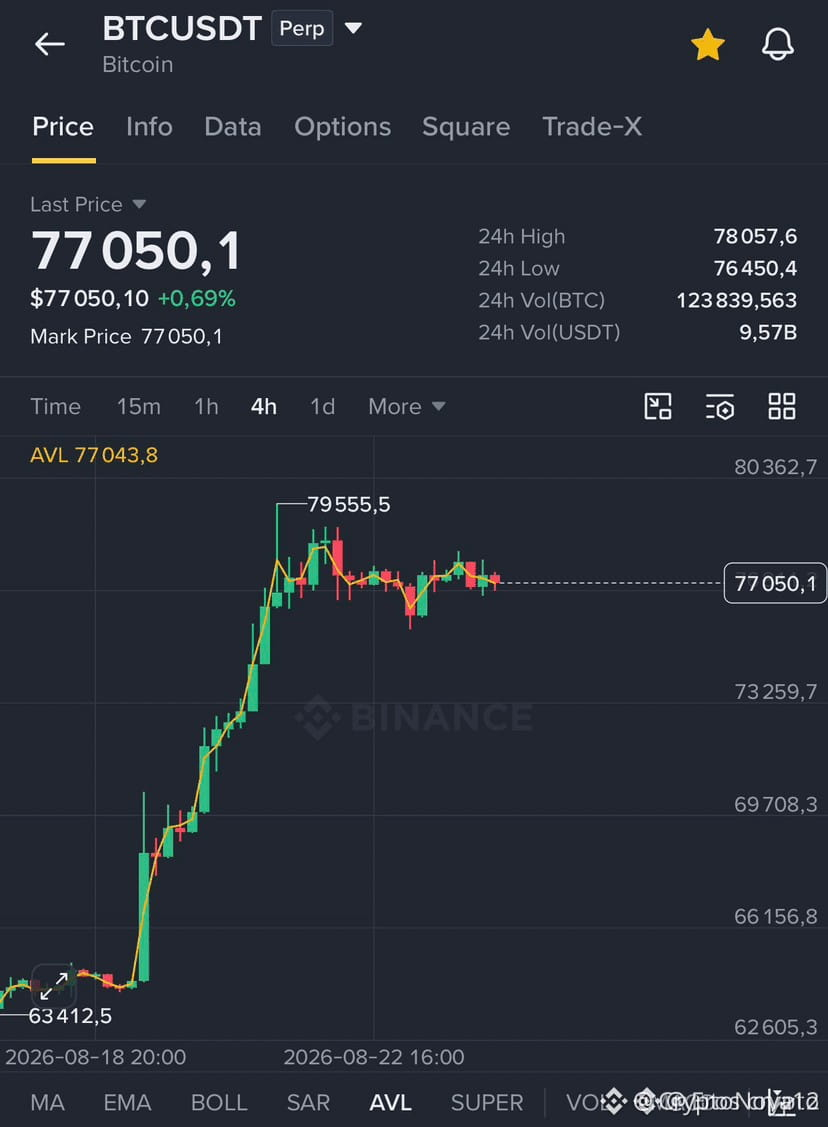
🚨BTC is holding steady against resistance at $78,000. My preferred BUY zone sits between $71,700–$73,600 — a solid demand area that lines up nicely with the 0.382 Fib retracement (~$73,571) and the prior breakout structure.
Rather than chase price here, I'd rather wait for a pullback into this zone before positioning for the next move up toward $82,500.
Stay patient, avoid FOMO — the market has a habit of punishing impatient entries 😅
#TradingTales
{spot}(BTCUSDT)
ng #btc70k C
Want a shorter version for a tweet, or a more formal one for a report?$BTC
🚨BTC is holding steady against resistance at $78,000. My preferred BUY zone sits between $71,700–$73,600 — a solid demand area that lines up nicely with the 0.382 Fib retracement (~$73,571) and the prior breakout structure.
Rather than chase price here, I'd rather wait for a pullback into this zone before positioning for the next move up toward $82,500.
Stay patient, avoid FOMO — the market has a habit of punishing impatient entries 😅
#TradingTales
ng #btc70k C
Want a shorter version for a tweet, or a more formal one for a report?$BTC
Rather than chase price here, I'd rather wait for a pullback into this zone before positioning for the next move up toward $82,500.
Stay patient, avoid FOMO — the market has a habit of punishing impatient entries 😅
#TradingTales
ng #btc70k C
Want a shorter version for a tweet, or a more formal one for a report?$BTC
60
Log in to explore more content
Join global crypto users on Binance Square
⚡️ Get latest and useful information about crypto.
💬 Trusted by the world’s largest crypto exchange.
👍 Discover real insights from verified creators.
Email / Phone number
Related Coins
Trending Topics
1
#BOJRaisesRatesTo31YearHigh
157,446 views
2,429 Discussing
2
#BuffettStepsDownAsBerkshireChairman
75,443 views
1,247 Discussing
3
#XRPExchangeReservesHitSevenYearLow
82,552 views
1,114 Discussing
4
#HKCompletesFirstHKDStablecoinUseCase
116,629 views
1,522 Discussing
5
#VietnamPlansFirstCryptoLicensesIn2026
72,350 views
1,063 Discussing
6
#BTCBreaks80K
446,609 views
5,202 Discussing
7
#BitcoinMarketCapTopsTesla
104,754 views
1,251 Discussing
8
#SOLJumpsAbout10%
106,378 views
1,150 Discussing
9
#EthereumReclaims$2600
9,148 views
127 Discussing
10
#LineraShutsDownAfterFundraisingFallsShort
31,938 views
341 Discussing