24/10/30 BTC surged to 73620, the cup and handle pattern is about to complete, and the fourth quarter is approaching 80-100K.
Last night, Bitcoin's price reached a maximum of 73620, just 1-200 points away from the March high. Yesterday's bullish candle also showed some volume, indicating capital inflow. Now, it is a critical moment: will it break through directly or will it need to go through a pullback before breaking through?
Since we reminded about the weekly cup and handle pattern on March 15, it has been more than 7 months. As of the time of writing, it has actually broken through, but it hasn't yet solidified this week and is currently just below the previous high. The next few days are very critical.
Bitcoin
After the weekly chart stood above the BOLL middle band, last week it formed a pregnant line combination, indicating a continuation pattern. The weekly chart has also formed a duckbill shape. Those who have positions from lower levels should not easily discard their chips. Those who haven't entered can only wait for a pullback; the moving stop-loss position should be raised to 70888.
The daily chart is currently forming an ascending triangle structure within an ascending flag. In the future, it should not drop back below the upper edge of this triangle, which is around 70888. Technical indicators are consistently bullish; continue to hold low-priced chips around 60000. Those who haven't entered can only consider short-term pullbacks or breakouts followed by a retest that does not break.
Support:
Resistance: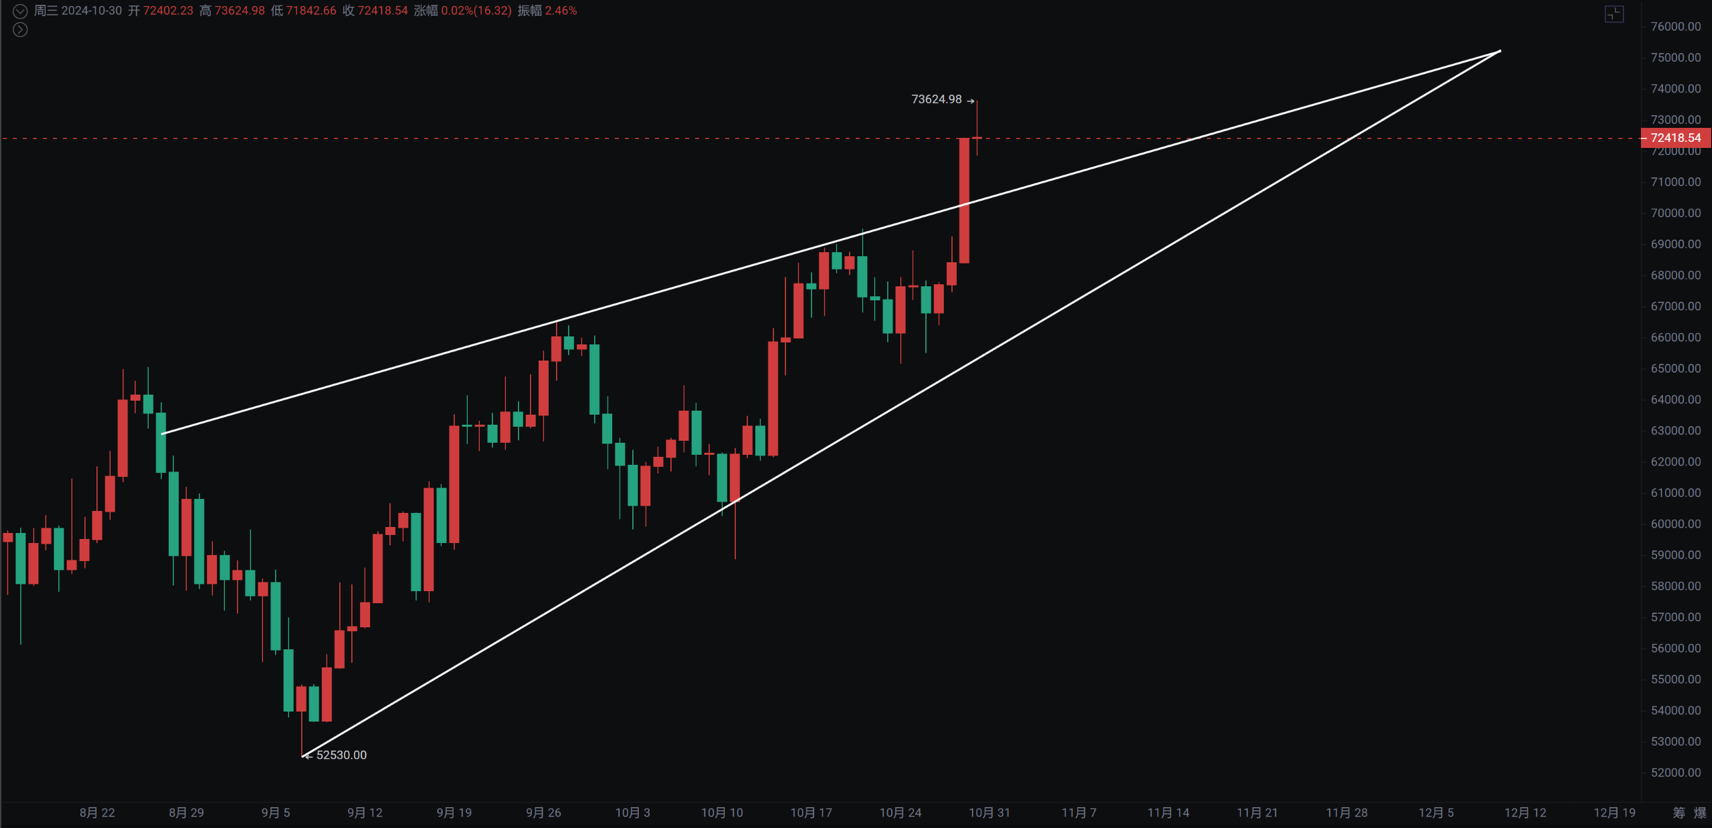
Ethereum
The weekly chart is still in continuous fluctuation. It is worth noting that if it can break through 2769 this week, it will form a bullish signal with a double positive candle sandwiching a negative one, providing a chance to break through the 2800 threshold for ETH. The weekly MACD is also showing a continuously shortening histogram with the fast and slow lines crossing below the zero line.
The daily chart is oscillating within a converging triangle as previously mentioned. It broke through again yesterday and is currently in a corrective phase; the 3-day line will be more apparent. A false breakdown followed by a continued breakout is a strong performance. MACD also shows a bullish divergence. The 4-hour downtrend line breakout has been mentioned, and if Bitcoin cannot directly break through the previous high, it is not recommended to chase directly; wait for a pullback to find an entry opportunity.
Support:
Resistance: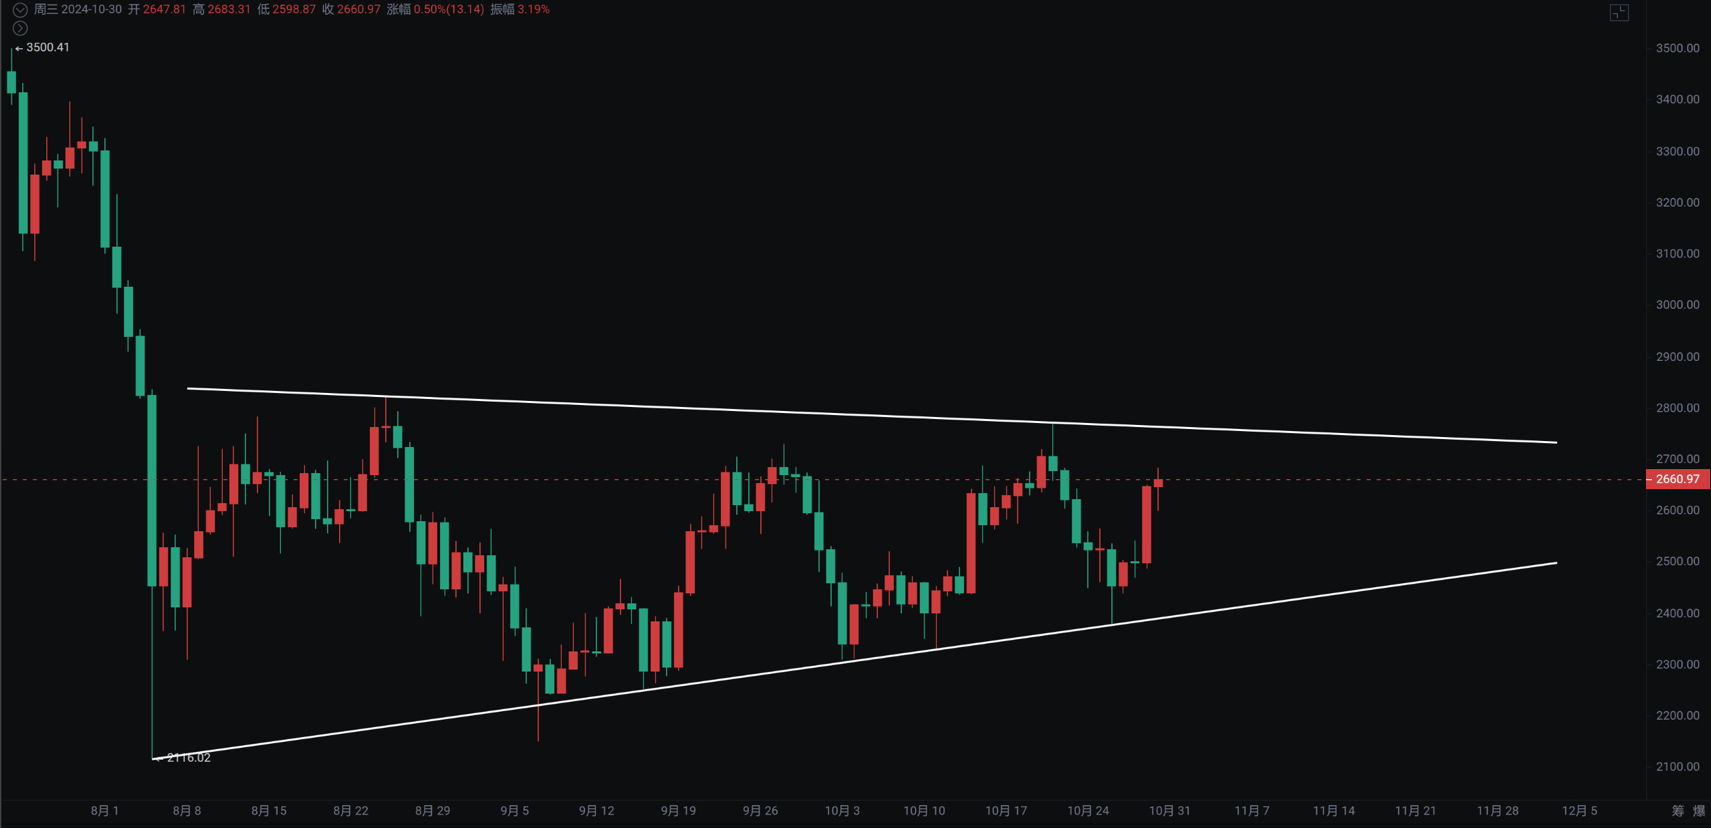
$BTC $ETH $SOL #BinanceBlockchainWeek #狗狗币创数月新高 #下一BTC历史新高是多少?

