24/09/12 US stock market "Big V Tianlong" linkage, BTC channel + head and shoulders bottom breakthrough, how long can this rebound last?
Yesterday, after the Comrade Jianguo debate and the announcement of the August CPI, we reminded us to remain firmly bearish. The market fell from 58,000 to 57,000 and then to a low of 55,555, a drop of about 2,500 points. At that time, U.S. stocks also fell sharply, with the Dow Jones Industrial Average falling as low as 1.7% and closing in the red. The Nasdaq and S&P opened low and then rebounded. Afterwards, BTC also fell back to the key 55,555 support and made a quick V-reversal. We reminded us again that we can take long positions and there will be another rebound in the short term.
Ethereum will also maintain an upward channel in the short term, with relatively small fluctuations and difficult up and down insertion operations. With still a week before the interest rate cut, it is not ruled out that it will continue to fluctuate and find a direction.
Yesterday we also talked about the comparison between the 3-day MA120 support and the previous 519 trend. Although the pattern stages are different, it can still be used as a reference. If it falls back to the 3-day MA120 without breaking, we can continue to look for a rebound. Unless it falls below 49,000, there will be a chance for the second and third bottom-picking opportunities we reminded you of before.
Flatbread
The 3-day line rebounded twice when it touched MA120. The rebound pressure is between 61500 and 62000. The MACD bottom divergence is quite obvious. The daily MACD also bottom diverges and the column turns over the zero axis, and the fast and slow lines cross.
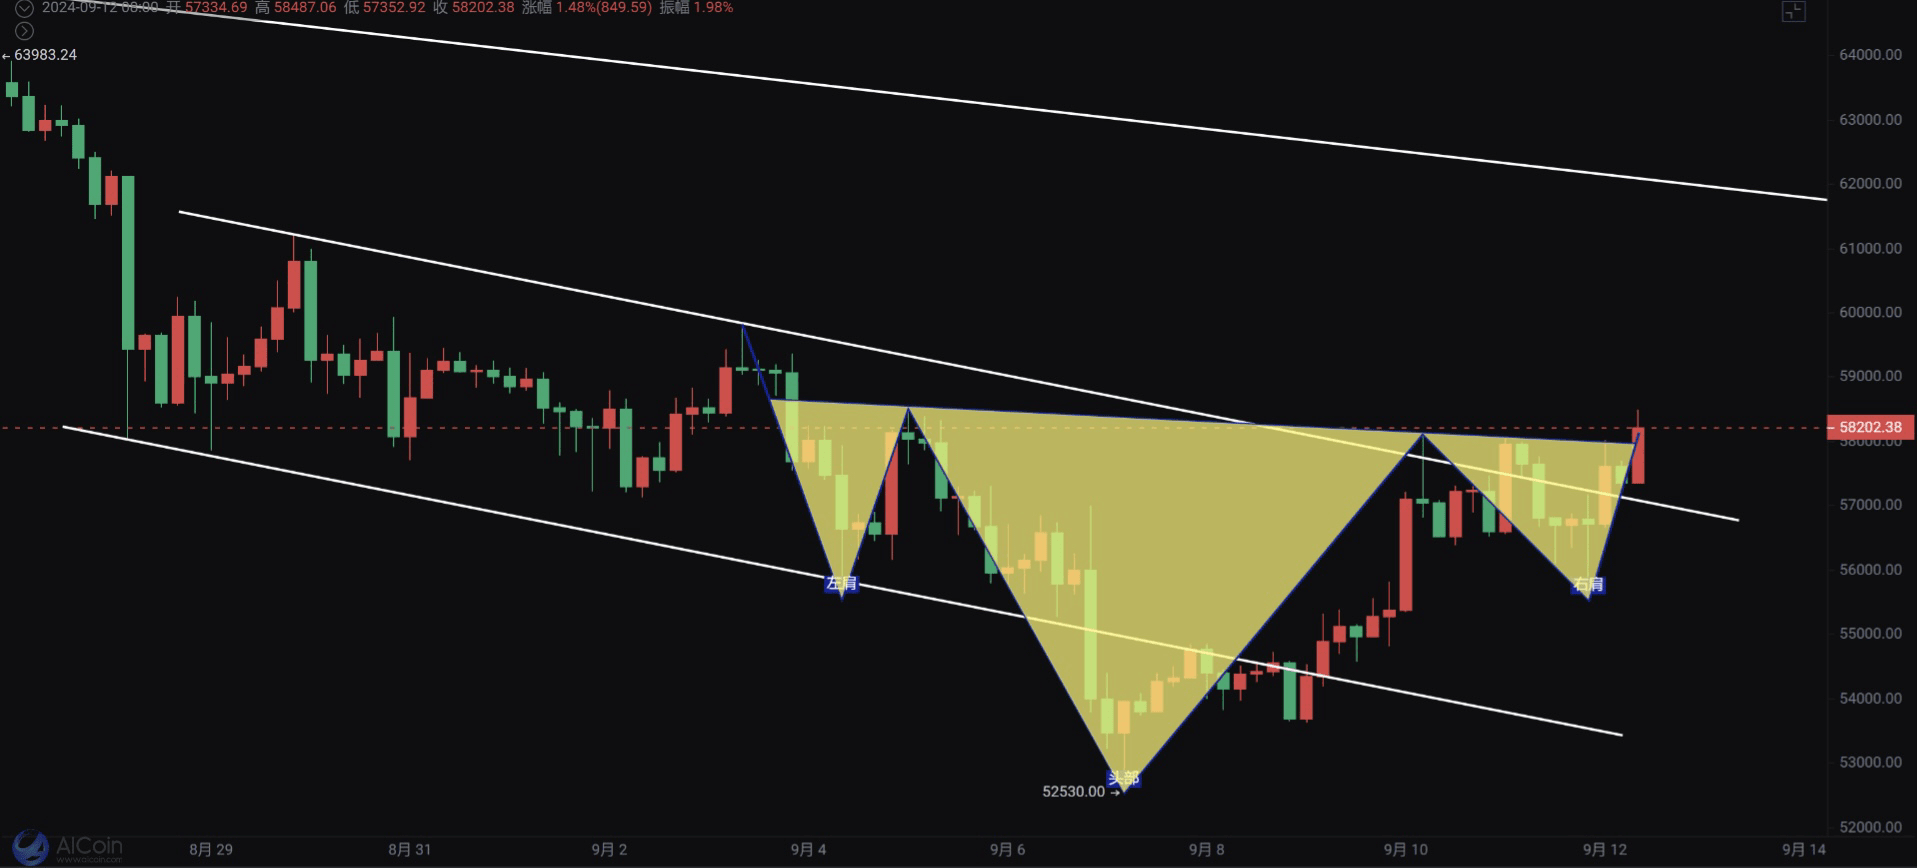
The 4-hour falling channel was broken, the short-term high of 58088 was broken, and the 4-hour chart also formed a head and shoulders bottom pattern, continuing the rebound.
support:
pressure:
ether
The daily line formed a doji yesterday and it seems to have broken through the short-term pressure of 2400 today. MACD also bottomed out and continued to rebound to the upper pressure of 2600-2700.
In the 4-hour chart, yesterday's spike retracted the rising channel and continued to rebound. The ETH/BTC exchange rate was very weak and returned to the bottom area of the previous spike. Pay attention to where Ethereum can rebound after Bitcoin rebounds?
support:
pressure: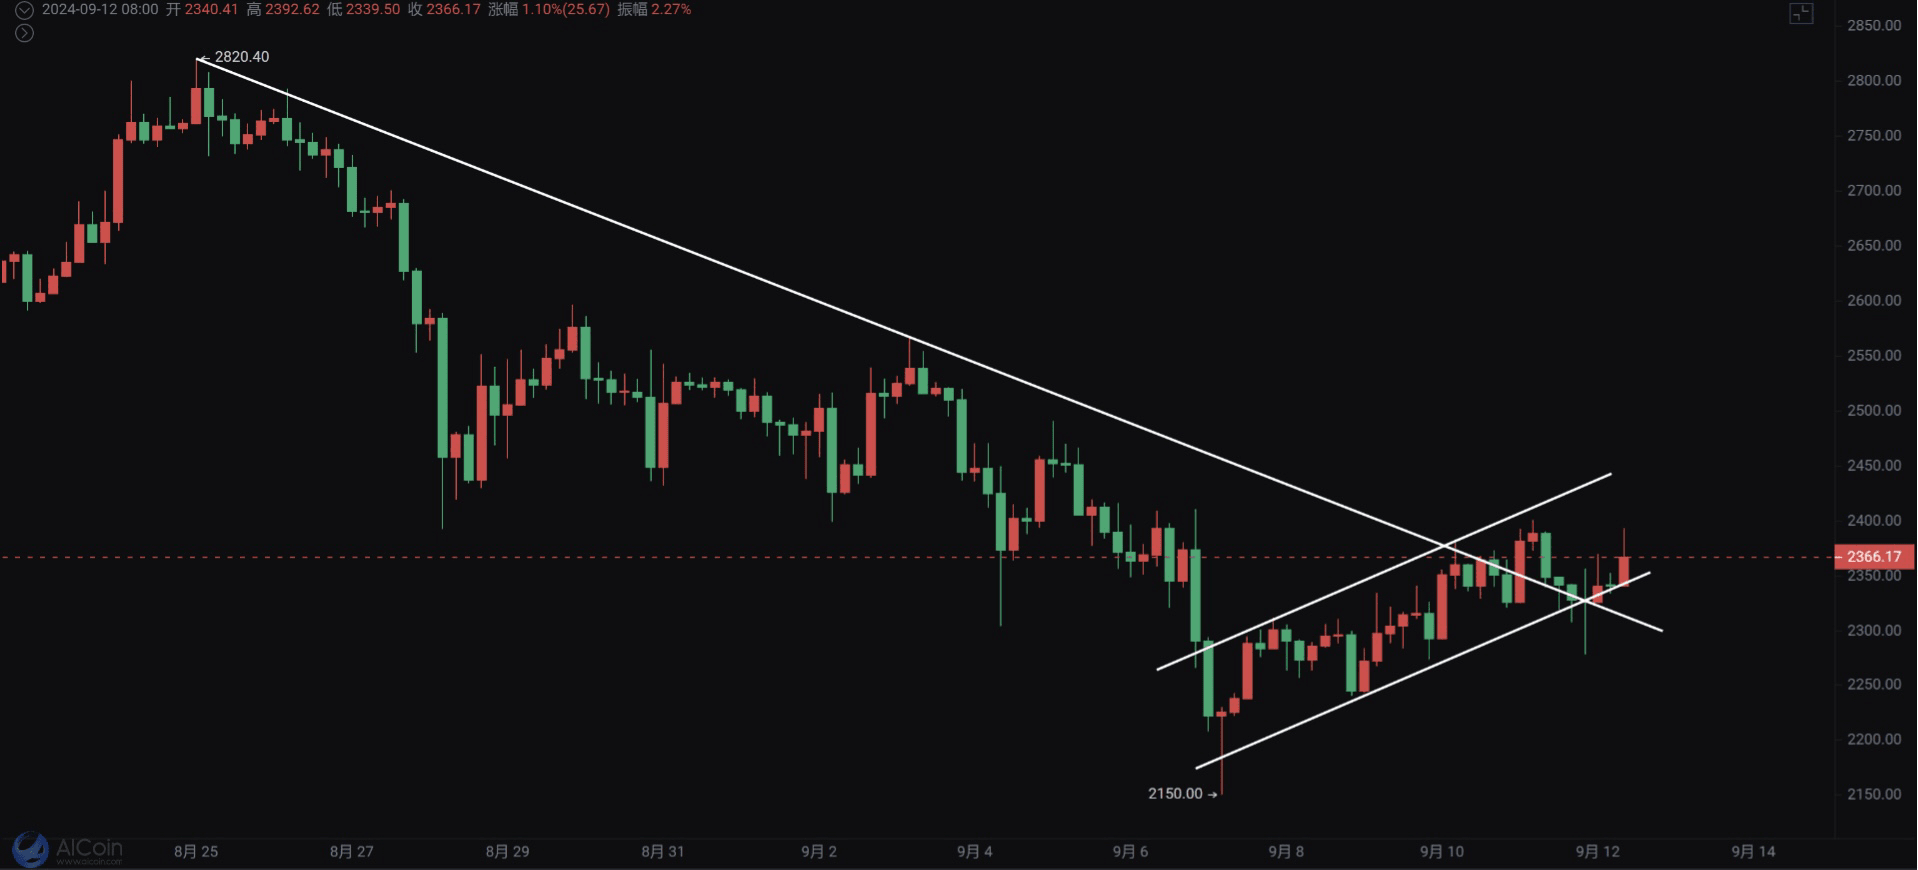
$BTC $ETH $SOL #美降息25个基点预期升温 #美国8月核心CPI超预期 #特朗普哈里斯辩论未提及加密货币 #比特币挖矿难度创历史新高

