24/07/25 US stocks and Crypto stocks plummeted, and once again escaped from the top in advance, and only made trend orders
US stocks plummeted. Poor financial reports from technology giants caused investors to be disappointed with the prospects of artificial intelligence. The market sold off violently, and US stocks plummeted. The Nasdaq fell 3.6%, and together with the S&P 500, it recorded the largest single-day drop in nearly a year and a half. The "fear index" VIX rose to a three-month high.
The Crypto market accelerated its decline in the morning. As of the time of writing, BTC fell to 63,950 and ETH fell to 3,153. On 24/07/23, the ETF was officially approved for listing and trading. The rise of the broader market was blocked. DXY falsely fell below the copycat, so beware of a pullback. Beware of a copycat pullback.
On July 22, BTC was reminded that the 4-hour channel triangle structure fell below, and the 1-hour channel was also supported by the lower edge of the rising channel. The 4-hour MACD top diverged from SKDJ downward. The 65777 long support fell below the disk and turned short. Pay attention to the rebound at 60600-62300. ETH hourly level also walked out of the rising channel. ETH should pay attention to the support of 3080-3240
iShares Ethereum Spot ETF (ETHA) fell below the issue price at the opening, reaching a current low of 25.48. 21Shares Ethereum Spot ETF (CETH) fell from 17.49 to 16.8, and Fidelity FETH35 fell to 33.6. BTC spot ETF has seen an outflow of 99.5 million for two consecutive days, and ETH spot ETF has seen an outflow of 151 million, mainly due to Grayscale's outflow of 811 million for two consecutive days. This situation will continue for some time.
Flatbread
The weekly BOLL middle track fell below, and the OBV touched the yellow line and turned downward, and the volume was reduced. We reminded that the daily rebound began to pull back on the 22nd. The RSI indicator turned downward without touching the overbought area. The MACD column shortened for two weeks but did not change the trend. The monthly KDJ has already crossed. The ideal trend fell to 60600-62700 for a rebound, but there is another situation that the high point of the daily rising flag pattern keeps moving down, and the low point keeps moving down. According to the flag pattern, the possibility of adjusting to 50000-52000 cannot be ruled out, so be vigilant.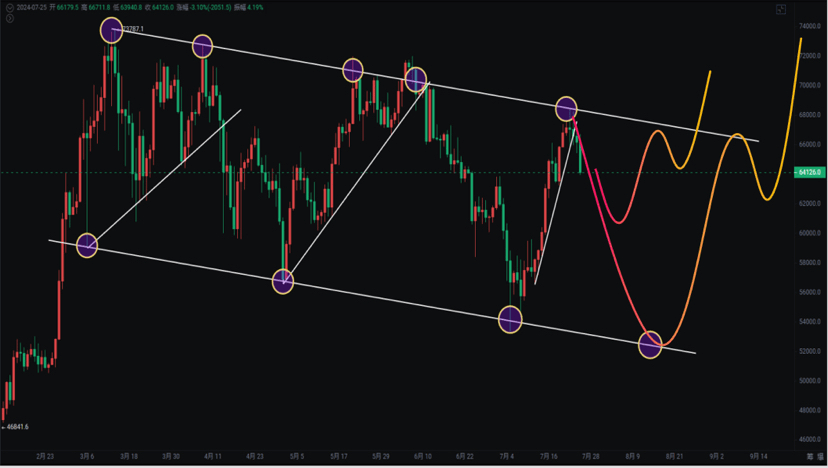
The BTC spot ETF also fell after it was approved, the ETH spot ETF fell short of expectations and Grayscale started the same routine as GBTC, and Mt.Gox also executed compensation, which takes time to digest.
On July 22, it was reminded that the 4-hour bearish wedge has fallen by 6.6%, and Fibonacci has fallen below 0.618 (64925). The overall idea is still to pull back and buy the bottom to arrange the medium and long term (wait patiently and I will remind you) with a target of 80,000-100,000.
support:
pressure: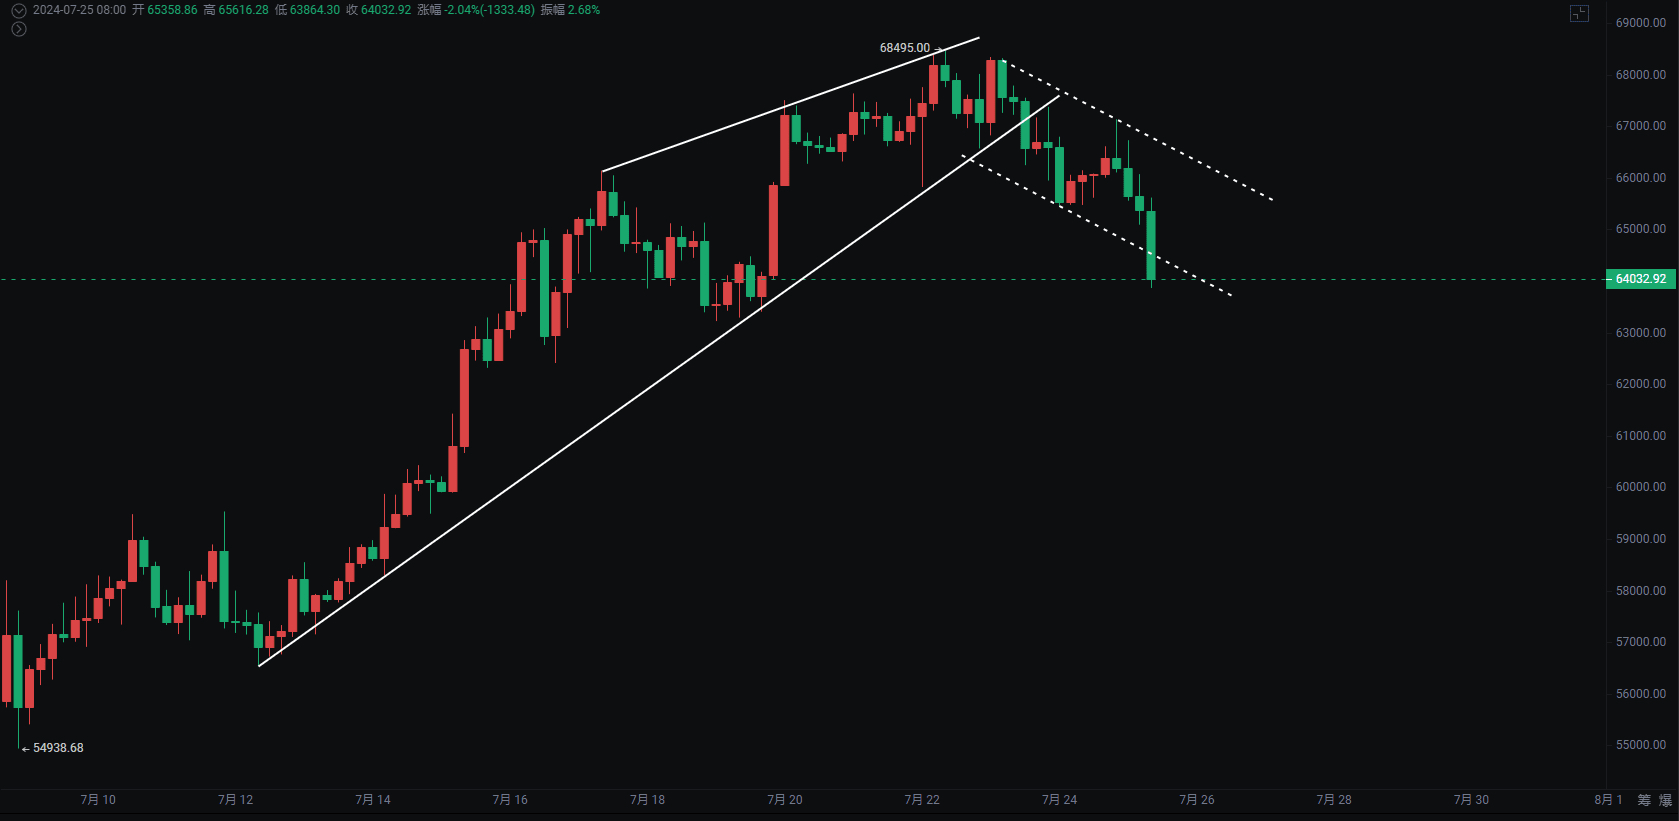
ether
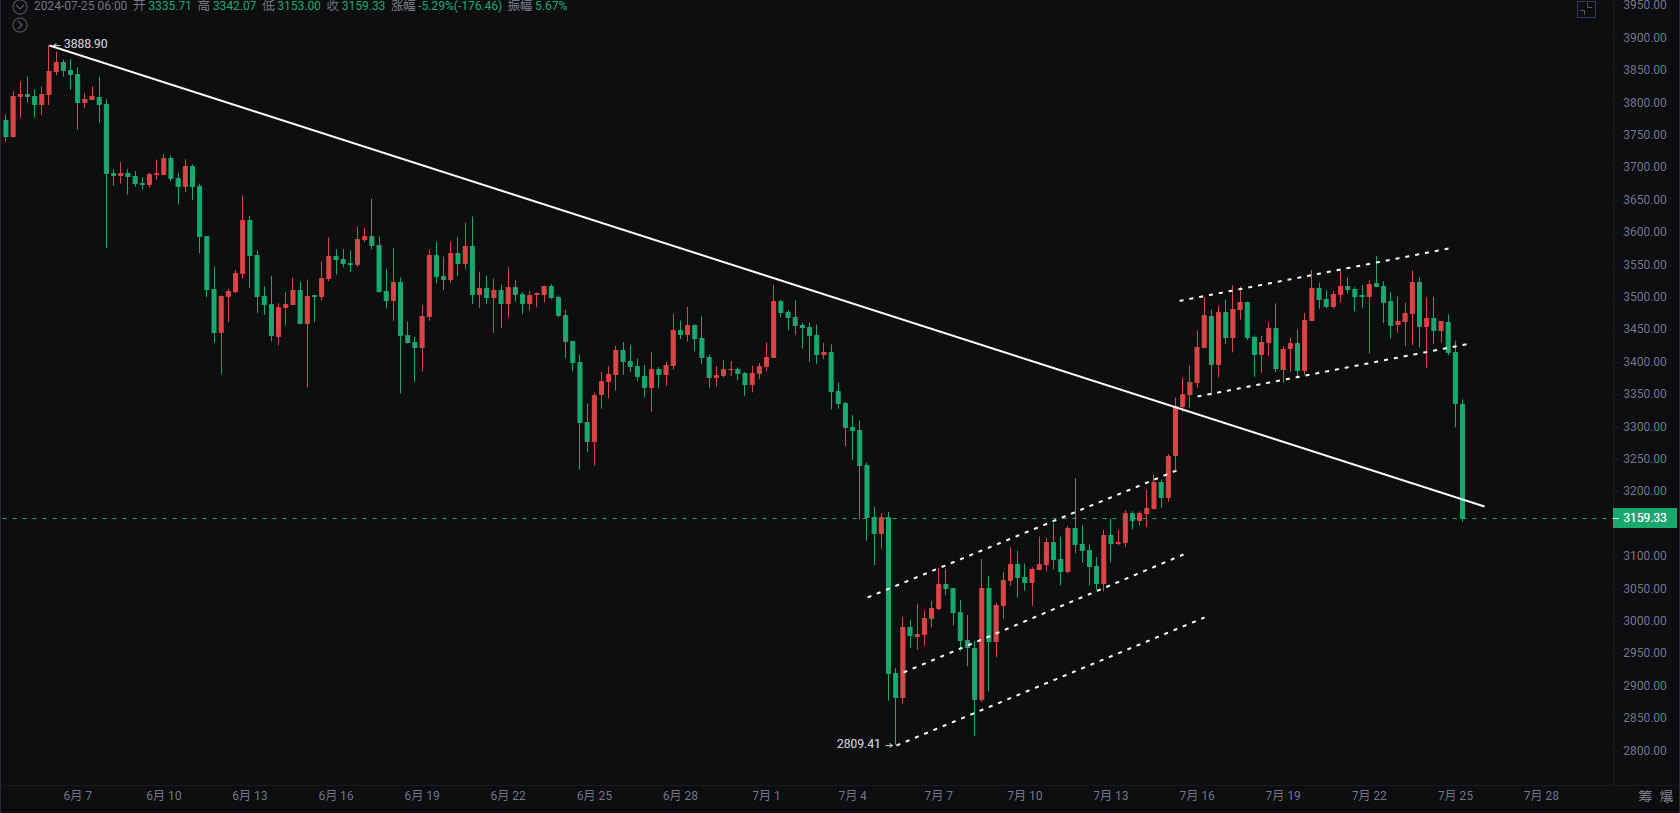
After breaking through the rising channel, the decline accelerated. The weekly line showed a Yin-swallowing-Yang pattern, and all the gains of last week were lost. The MACD fast and slow lines continued to move downward, the RSI indicator moved downward, and the KDJ golden cross failed and turned downward.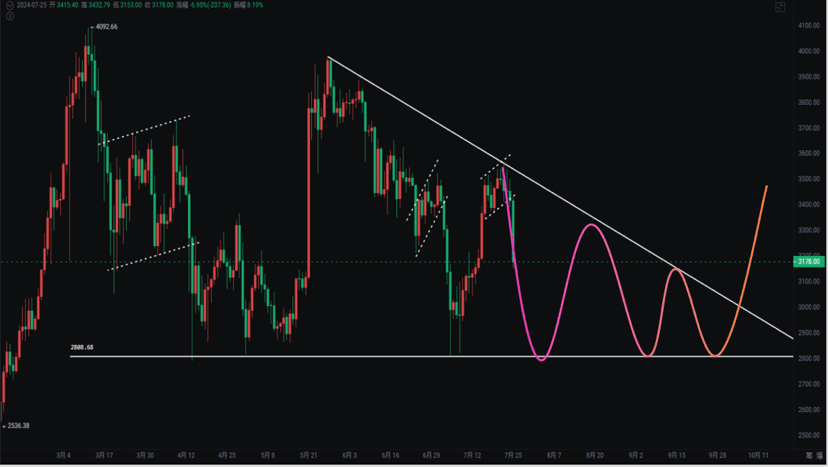 If the daily line falls below the middle track, the 2800 bottom support will be tested again. If the 4-hour rising channel falls below the Fibonacci 0.382, the 3080 line will be tested.
support:
pressure: