25/06/22 The 'Third World War' has officially begun, BTC's converging triangle has broken down, and global safe-haven demand is about to rise.
The most notable news today is that the U.S. has taken action, the specifics of which everyone is likely aware. This marks the official start of the 'Third World War.'
Lu Qiyuan analyzed the global situation before Trump took office, pointing out that Trump’s main goal is to take military action against Iran, using this to drive oil prices up to 150 - 200 USD, benefiting traditional American industries such as military and petrochemicals, while also benefiting large enterprises; this action would impact Europe, Japan, and South Korea, putting pressure on Chinese inflation, but China could buffer this with its development of new energy and energy reserves. Additionally, it is speculated that Trump may implement military control over Mexico to promote its industrialization and reconstruct the American industrial chain, even reducing external resistance through transactions (like 'giving two cents to big enterprises and the bay to pandas'). If these plans succeed, Trump could solidify his historical position and extend his time in office. However, these are merely unverified speculations.
Thus, we have always emphasized not just to listen to what others say, but to pay attention to what others do. Like Buffett, who has been continuously selling stocks and still holds a large amount of cash. In the long term, localized conflicts and even the 'Third World War' will not easily end in a short time, and the safe-haven roles of gold and Bitcoin will become increasingly significant.
Bitcoin
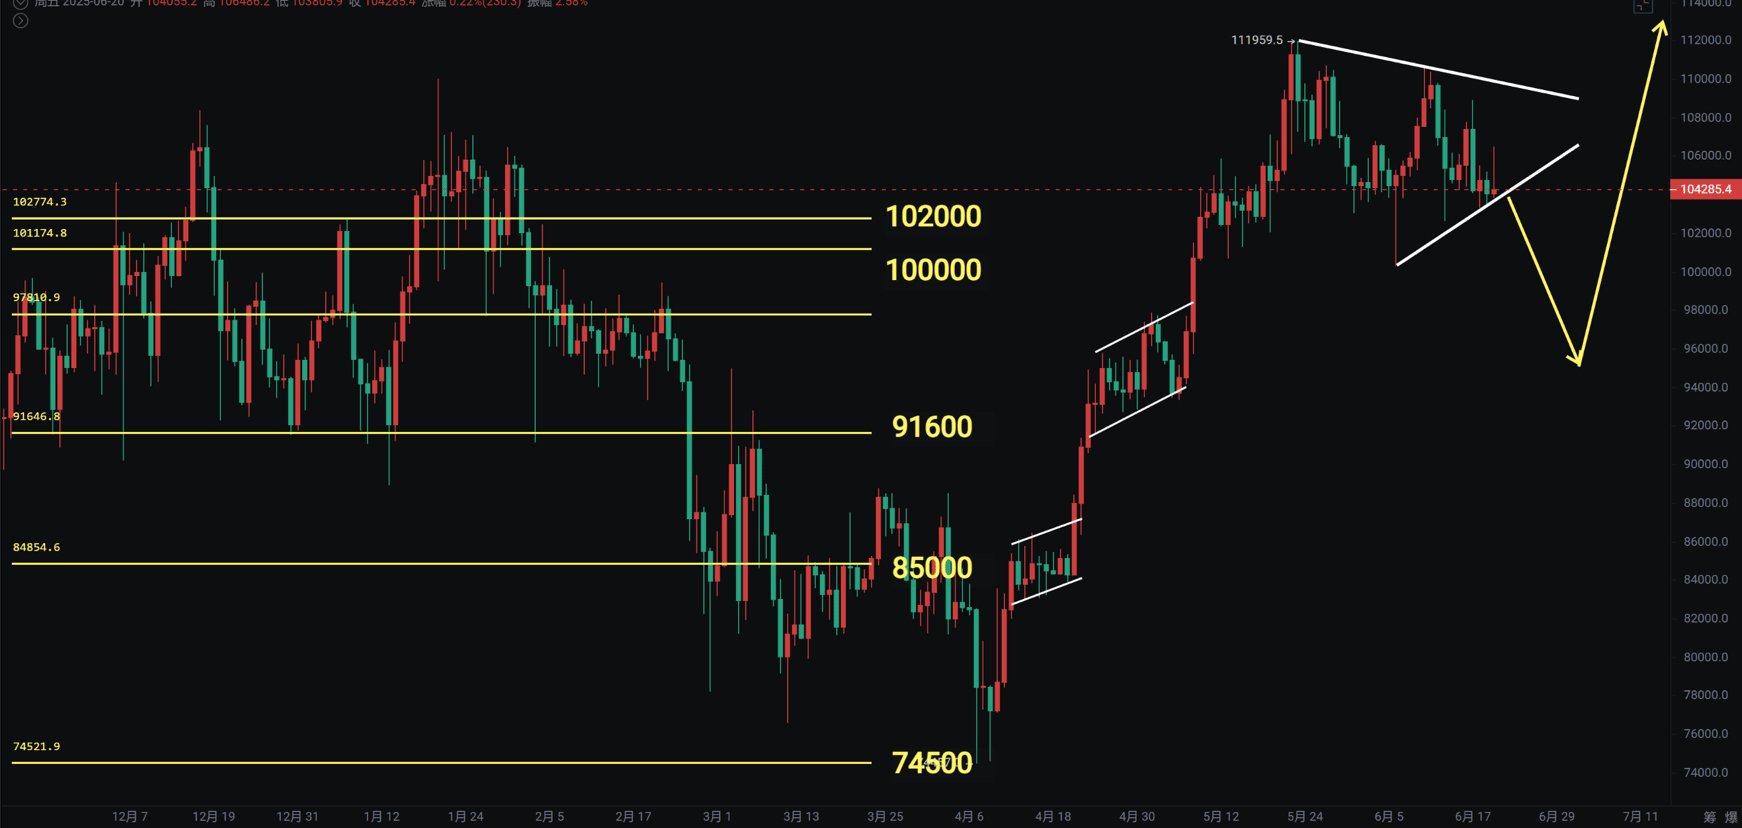
As of the time of writing, Bitcoin has spiked to 99000. A couple of days ago, I reminded that the daily chart maintained a converging triangle with the risk of continuing to break down. I had mentioned earlier that 98000 to 94000 might be a good opportunity to bottom-fish, and it is still worth looking forward to. Tonight, Bitcoin accelerated to fall below 100000, and after breaking the entire upward trend, it has formed a downward ABC wave. The CME gap is at 97000, with the weekly Bollinger middle line at 94000, so I have been reminding that there might be an opportunity to retest the Bollinger middle line, even experiencing a spike.
The daily MACD failed to show a bottom divergence, with the histogram continuing to extend below the zero axis, and the daily Bollinger Bands opening downward, prolonging the adjustment period. Therefore, I have been emphasizing not to chase high prices and to wait for a pullback to position for medium to long-term opportunities.
• Support: 94000—98000
• Resistance: 103000—107000—110000
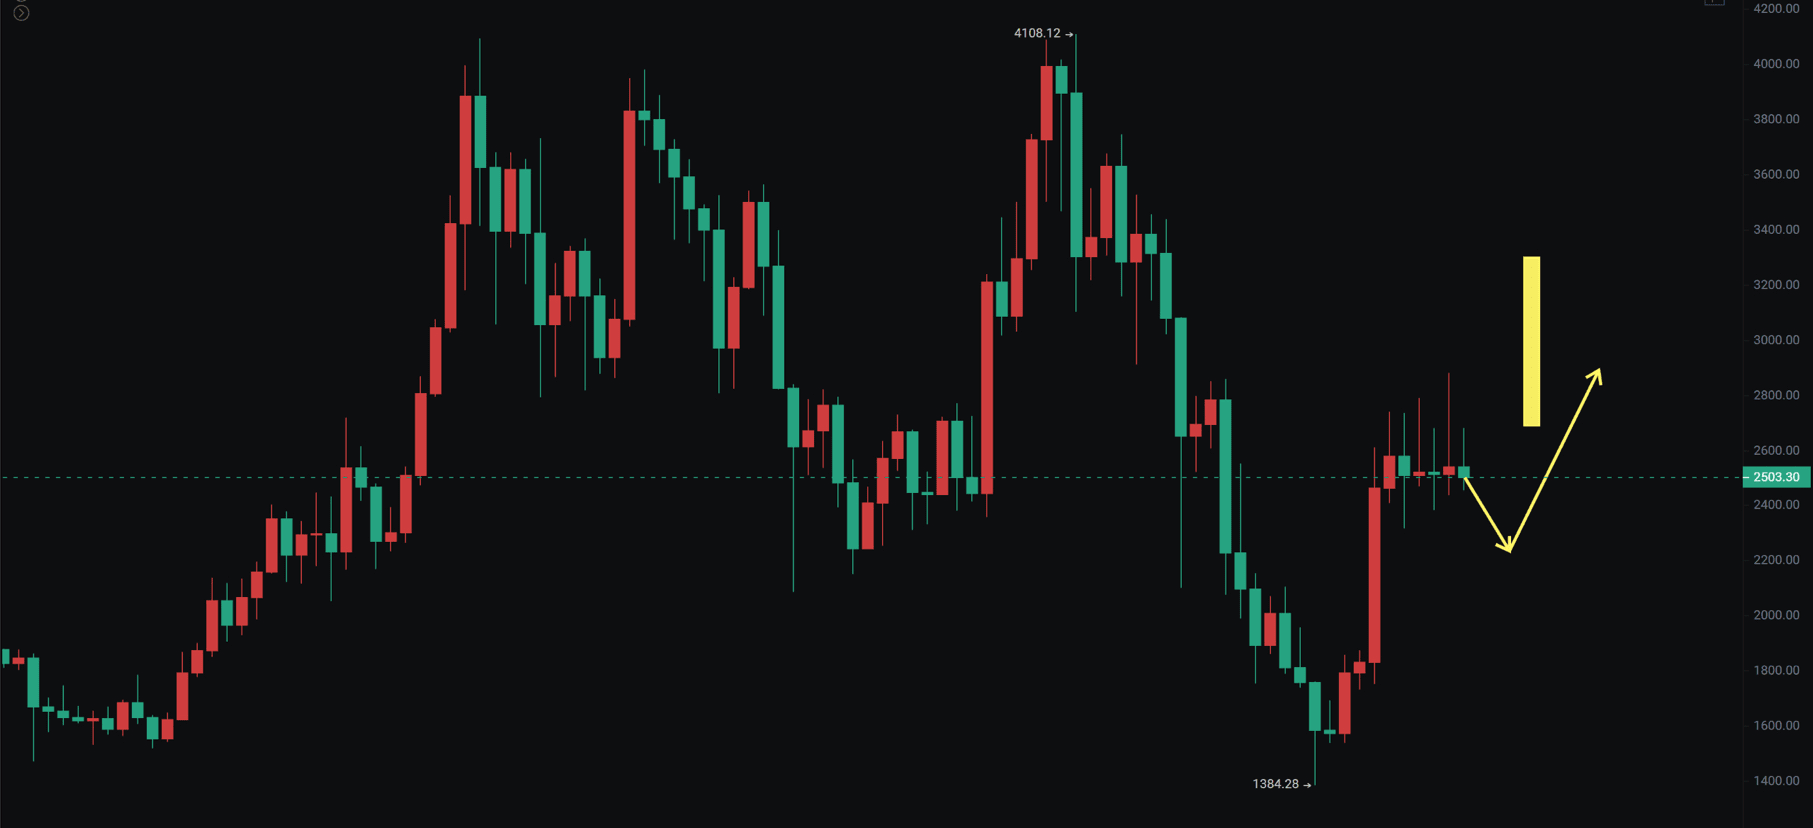
Ethereum
The weekly chart shows five doji candles. I previously mentioned that this is a 'throwing a brick to attract jade' pattern, and the overall outlook is bullish, but we must also pay attention to the possibility of a rebound following a drop in Bitcoin. 2800 has always been the dividing line between bullish and bearish for Ethereum. After more than forty days of narrow fluctuations on the daily chart, it was similarly dragged down by Bitcoin’s market, breaking the support levels of 2300 and 2200, with a lowest spike at 2155. As a result, a drop to the 1700—1800 range cannot be ruled out.
• Support: 1700—1800—1900
• Resistance: 2300—2879