Binance Square
#sp500slipsfridaythirdstraightweeklygain

sp500slipsfridaythirdstraightweeklygain

36,713 views
227 Discussing
Vinhtocdo
·
--
Bullish
Verified
Bitcoin Up or Down on August 15?

Bitcoin Up or Down on August 15?

99%Up1%Down
Volume $131,462.6
Verified
#sp500slipsfridaythirdstraightweeklygain Market wrap – Fri close:S&P -0.18% to 7,784… after yday’s ATH (7,799). Soft retail + weak consumer vibes, but market shrugged & kept the AI party going.Reddit +15% on S&P inclusion. AMAT got clapped for “good but not god-tier” nums…My take: Pure AI hopium + “Fed ain’t hiking” energy. Classic “this is fine” dog mode. Fun while it lasts… until it doesn’t.$DOS $GRIFFAIN $FOLKS
If you're still treating every S&P dip like automatic altcoin fuel, stop now. The painful trade is buying $BTC or $ETH because “stocks were green all week,” then watching Friday risk-off turn your entry into exit liquidity. Macro is still driving crypto mood, and with Fear & Greed sitting in Fear, traders are not exactly YOLO-ing like it’s 2021. The S&P 500 slipping Friday after a third straight weekly gain feels small, but the setup matters. We’ve seen this movie before: equities grind higher on rate-cut hopes, crypto front-runs the party, then one weak session reminds everyone that liquidity narratives can flip faster than a meme coin roadmap. The difference now is positioning. In 2023, dips often got bought because cash was waiting and AI stocks carried sentiment. Today, $USDT searches are hot, which tells me people are watching from the sidelines, not blindly aping every green candle. So is this just a healthy pause before risk assets continue higher, or the early crack before crypto gives back the recent bounce? #SP500SlipsFridayThirdStraightWeeklyGain #TradersCutFedRateHikeBetsBeforeMid2027 #DollarFallsToMayLow
If you're still treating every S&P dip like automatic altcoin fuel, stop now.

The painful trade is buying $BTC or $ETH because “stocks were green all week,” then watching Friday risk-off turn your entry into exit liquidity. Macro is still driving crypto mood, and with Fear & Greed sitting in Fear, traders are not exactly YOLO-ing like it’s 2021.

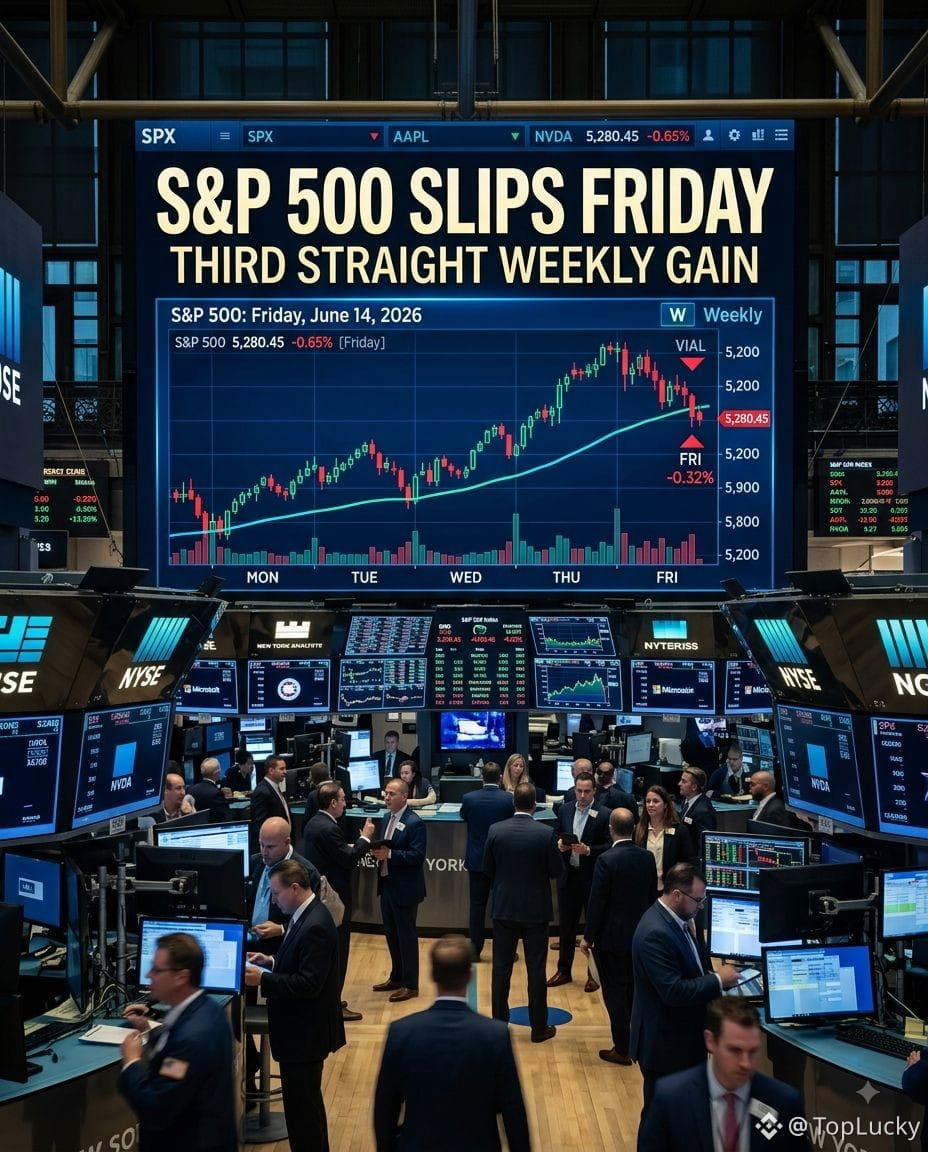
The S&P 500 slipping Friday after a third straight weekly gain feels small, but the setup matters. We’ve seen this movie before: equities grind higher on rate-cut hopes, crypto front-runs the party, then one weak session reminds everyone that liquidity narratives can flip faster than a meme coin roadmap.

The difference now is positioning. In 2023, dips often got bought because cash was waiting and AI stocks carried sentiment. Today, $USDT searches are hot, which tells me people are watching from the sidelines, not blindly aping every green candle.

So is this just a healthy pause before risk assets continue higher, or the early crack before crypto gives back the recent bounce? #SP500SlipsFridayThirdStraightWeeklyGain #TradersCutFedRateHikeBetsBeforeMid2027 #DollarFallsToMayLow
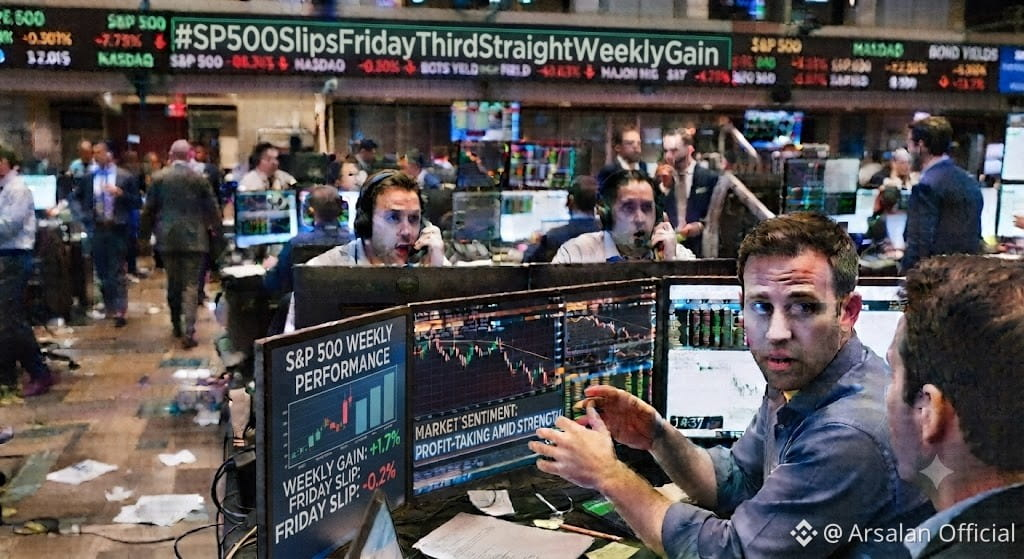
#SP500SlipsFridayThirdStraightWeeklyGain That headline means: the S&P 500 fell on Friday, but still finished the week higher overall, and that marked its third consecutive weekly gain. So the key message is: one weak day did not stop the broader short-term upward trend. How traders usually read it: “slips Friday” = short-term weakness or profit-taking at the end of the week. “third straight weekly gain” = the broader market trend over the last three weeks has still been positive. Why this matters: It suggests equities may still have underlying support even if daily momentum softens. Sometimes this kind of headline reflects a market that is climbing gradually but not in a straight line. For crypto: a steady equity backdrop can be mildly supportive for risk assets, but a down Friday can also signal some near-term caution. The net effect depends on whether the decline was just routine profit-taking or part of a bigger risk-off move. So the headline is basically saying: stocks dipped at the end of the week, but the overall weekly trend remained positive for a third week in a row.$BTC {spot}(BTCUSDT) $SPX {future}(SPXUSDT) $SPYB {spot}(SPYBUSDT)
#SP500SlipsFridayThirdStraightWeeklyGain That headline means:
the S&P 500 fell on Friday,
but still finished the week higher overall,
and that marked its third consecutive weekly gain.

So the key message is: one weak day did not stop the broader short-term upward trend.

How traders usually read it:
“slips Friday” = short-term weakness or profit-taking at the end of the week.
“third straight weekly gain” = the broader market trend over the last three weeks has still been positive.

Why this matters:
It suggests equities may still have underlying support even if daily momentum softens.
Sometimes this kind of headline reflects a market that is climbing gradually but not in a straight line.

For crypto:
a steady equity backdrop can be mildly supportive for risk assets,
but a down Friday can also signal some near-term caution.
The net effect depends on whether the decline was just routine profit-taking or part of a bigger risk-off move.

So the headline is basically saying: stocks dipped at the end of the week, but the overall weekly trend remained positive for a third week in a row.$BTC

$SPX

$SPYB
·
--
Bullish
Verified
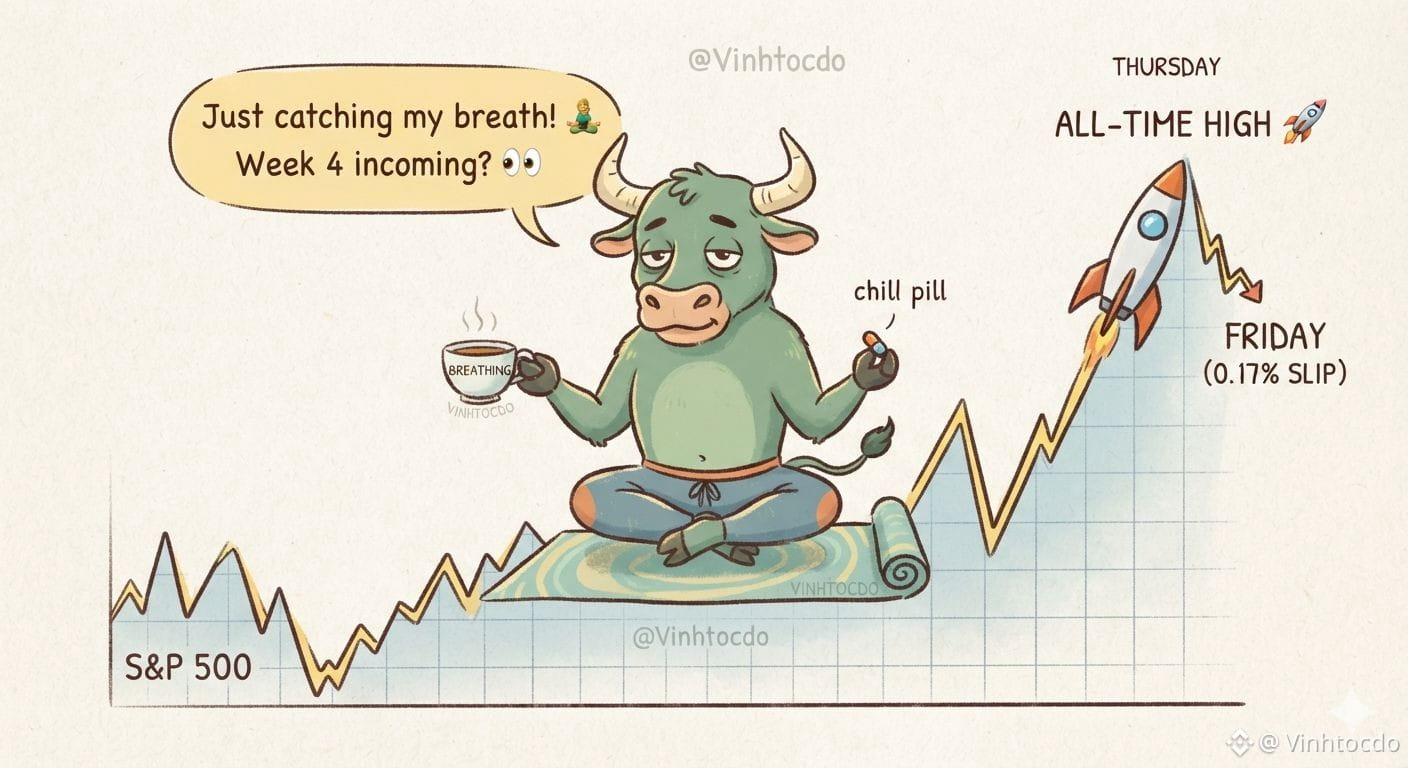
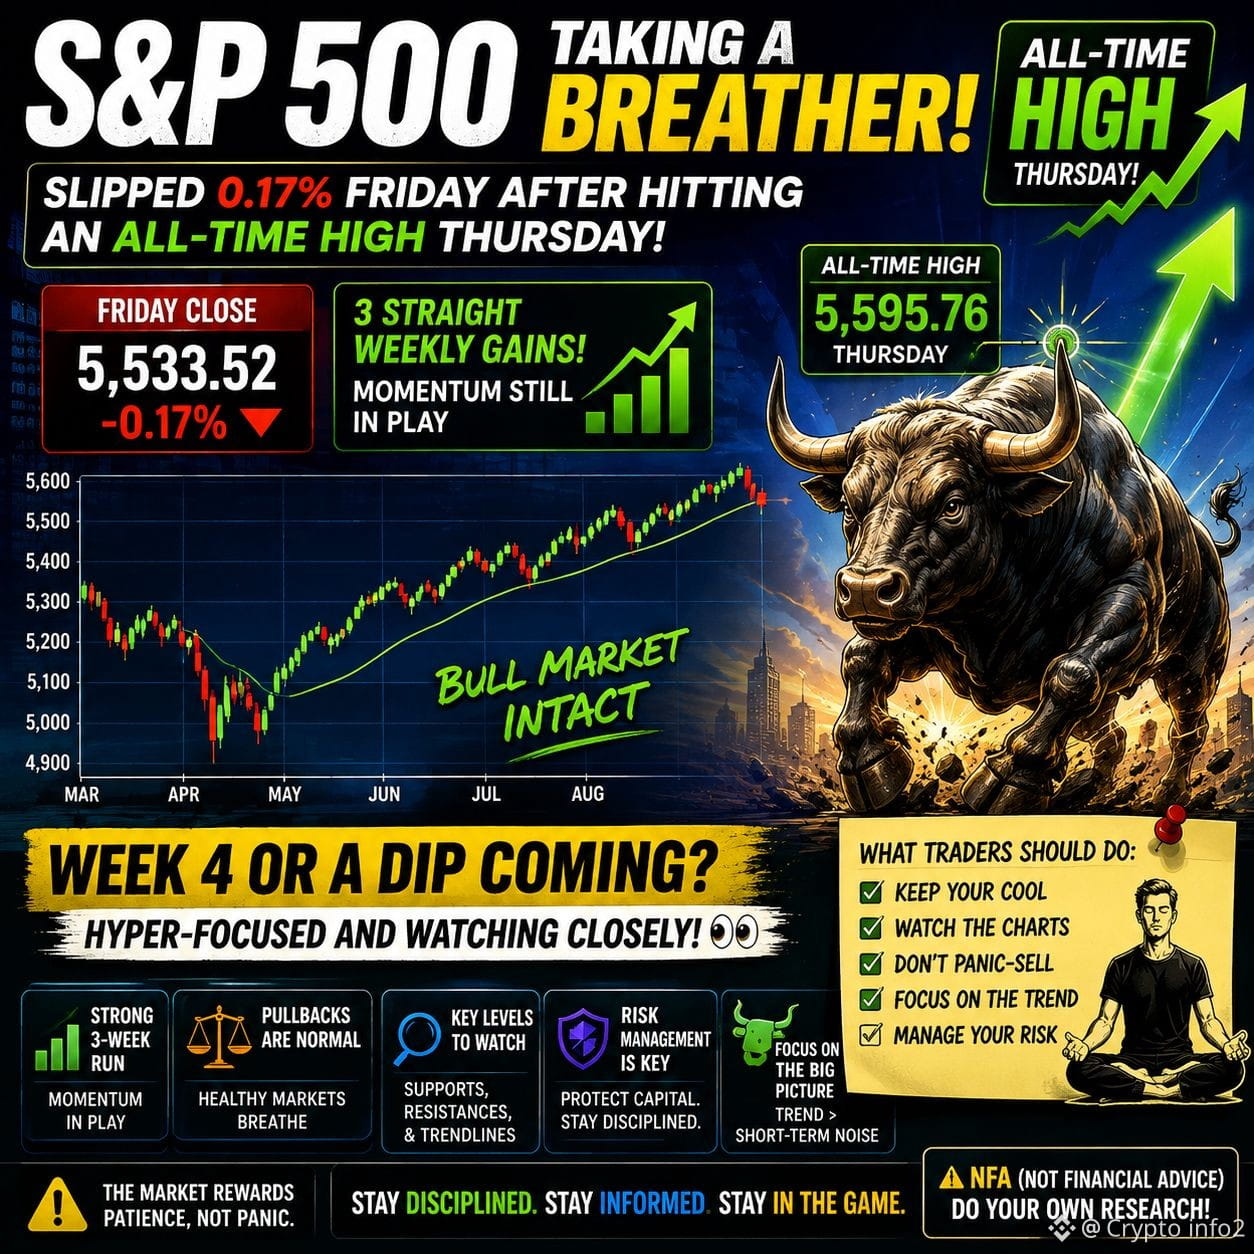
#sp500slipsfridaythirdstraightweeklygain 📈🔥 S&P 500: Taking a Breath, Not Breaking Down The S&P 500 slipped just 0.17% Friday after hitting a fresh all-time high Thursday—and the bigger picture remains strong. 🚀 3 straight weekly gains! So the real question: Week 4… or a pullback? 👀 For traders: 🔹 Don’t panic-sell normal pullbacks. 🔹 Watch support & momentum. 🔹 Track volume and market breadth. 🔹 Respect risk if volatility picks up. 🔹 Avoid chasing after extended moves A red day after record highs doesn’t automatically mean the rally is over. Sometimes the market simply needs to breathe before the next move. 🧘‍♂️📊 Are you betting on Week 4—or preparing for a dip? 👇 ⚠️ NFA. Do your own research. #SP500 #SPX #StockMarket #Trading CLICK TO BELOW TRADE👇 $BTC $ETH $BNB {future}(BNBUSDT) {future}(ETHUSDT) {future}(BTCUSDT)
#sp500slipsfridaythirdstraightweeklygain 📈🔥 S&P 500: Taking a Breath, Not Breaking Down
The S&P 500 slipped just 0.17% Friday after hitting a fresh all-time high Thursday—and the bigger picture remains strong.
🚀 3 straight weekly gains!
So the real question: Week 4… or a pullback? 👀
For traders:
🔹 Don’t panic-sell normal pullbacks.
🔹 Watch support & momentum.
🔹 Track volume and market breadth.
🔹 Respect risk if volatility picks up.
🔹 Avoid chasing after extended moves
A red day after record highs doesn’t automatically mean the rally is over. Sometimes the market simply needs to breathe before the next move. 🧘‍♂️📊
Are you betting on Week 4—or preparing for a dip? 👇
⚠️ NFA. Do your own research.
#SP500 #SPX #StockMarket #Trading
CLICK TO BELOW TRADE👇
$BTC $ETH $BNB
·
--
Bullish
Verified
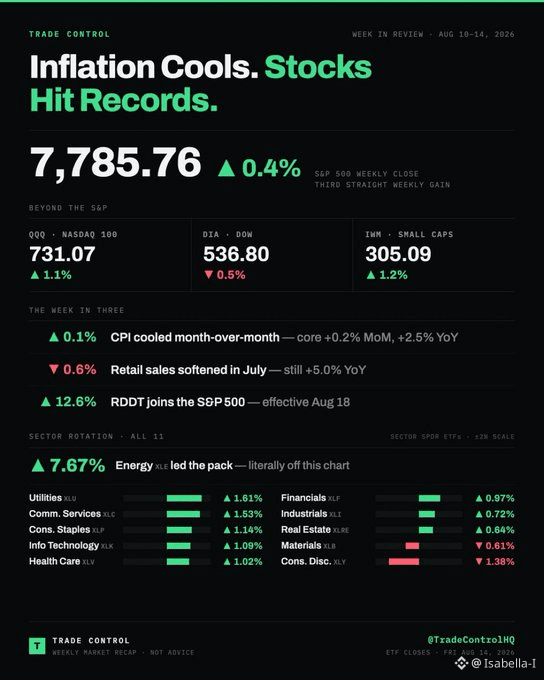
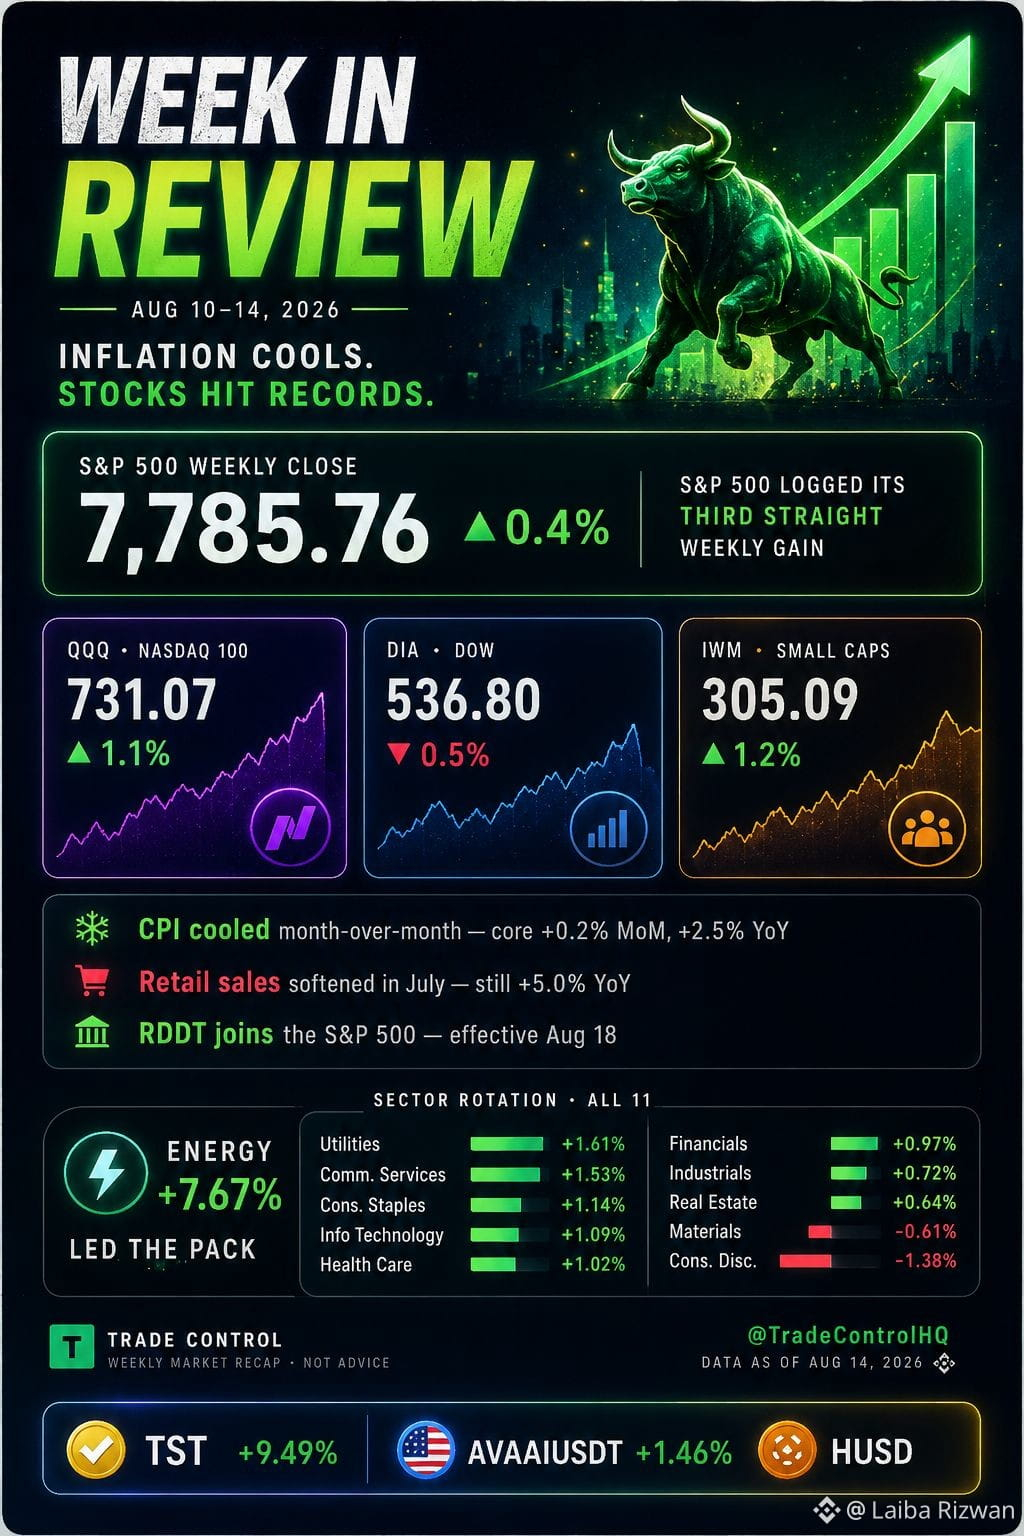
The S&P 500 dipped 13.23 points (0.2%) to 7,785.76 on Friday, retreating from a record high but securing its third consecutive weekly gain of 0.4%. Despite the weekly advance, market gains were capped by a 0.6% decline in July U.S. retail sales and rising oil prices stemming from geopolitical tensions. The Nasdaq added 0.1% for the week, while the Dow dropped 0.6%. Investor sentiment remains largely bullish, supported by cooling inflation data that suggests a potential September interest rate pause. Year-to-date, the S&P 500 maintains strong momentum with a ~13.7% gain. Retail investor sentiment as of mid-August 2026 is leaning toward caution and skepticism, showing a growing divide between institutional momentum and retail confidence. Despite the S&P 500 achieving its third straight weekly gain and hovering near record highs, everyday traders are increasingly anxious about the real economy. #sp500slipsfridaythirdstraightweeklygain
The S&P 500 dipped 13.23 points (0.2%) to 7,785.76 on Friday, retreating from a record high but securing its third consecutive weekly gain of 0.4%. Despite the weekly advance, market gains were capped by a 0.6% decline in July U.S. retail sales and rising oil prices stemming from geopolitical tensions.

The Nasdaq added 0.1% for the week, while the Dow dropped 0.6%. Investor sentiment remains largely bullish, supported by cooling inflation data that suggests a potential September interest rate pause. Year-to-date, the S&P 500 maintains strong momentum with a ~13.7% gain.

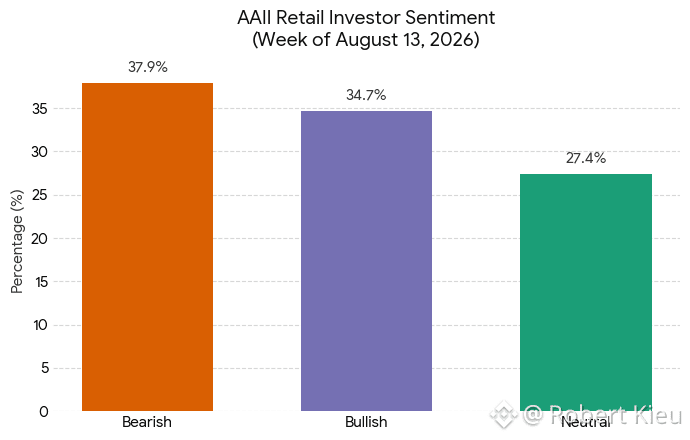
Retail investor sentiment as of mid-August 2026 is leaning toward caution and skepticism, showing a growing divide between institutional momentum and retail confidence.

Despite the S&P 500 achieving its third straight weekly gain and hovering near record highs, everyday traders are increasingly anxious about the real economy.

#sp500slipsfridaythirdstraightweeklygain
Verified
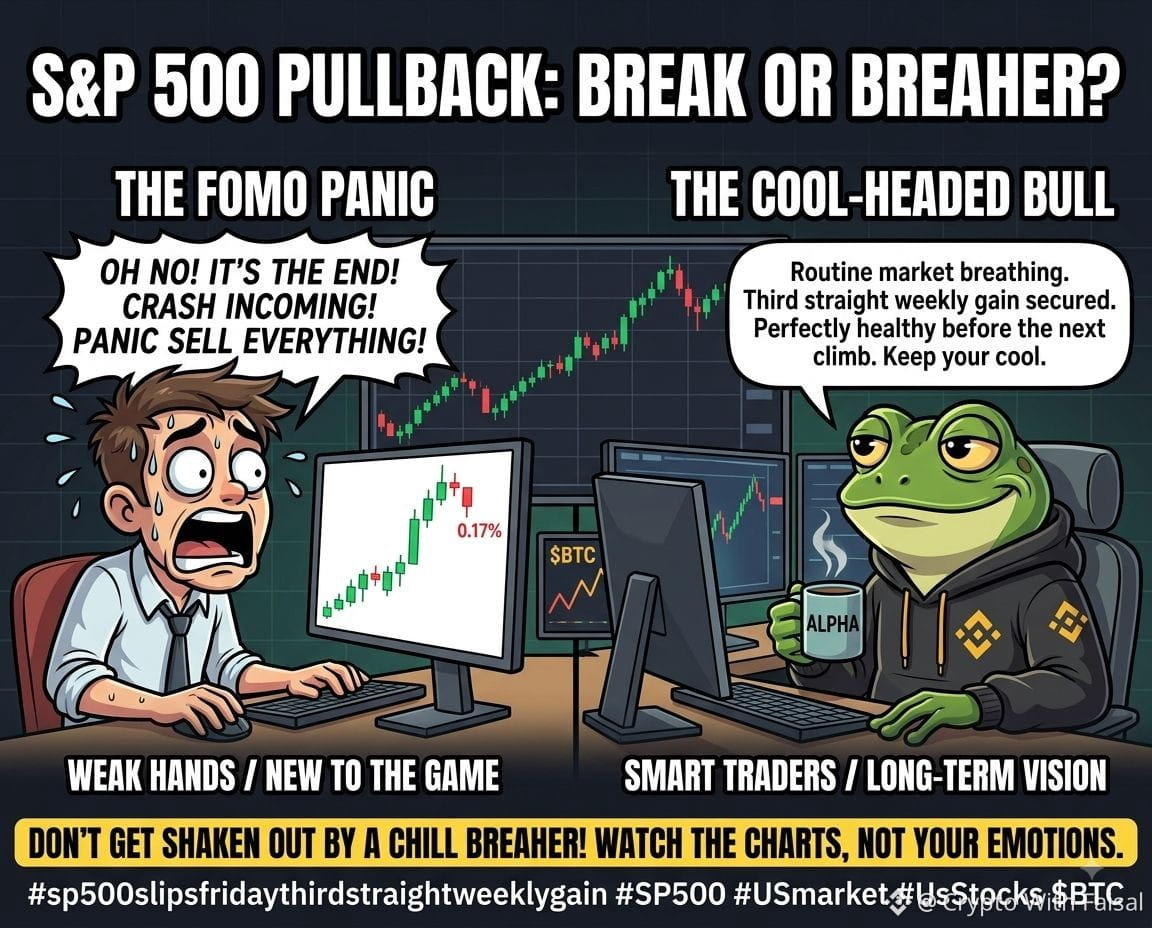
#sp500slipsfridaythirdstraightweeklygain ​📉 A minor 0.17% pullback for the S&P 500 this Friday—but don't let the red fool you. This is merely a healthy market consolidation following Thursday's explosive All-Time High. 📈 ​🔥 We’ve officially secured three consecutive weeks in the green. The critical question now: Are we gearing up for a massive Week 4 rally, or is a broader market correction imminent? The momentum is shifting, and I am closely monitoring the tape. 🦅 ​💡 Strategic Playbook for Traders: ​Maintain discipline: Keep your emotions in check. ​Trust the data: Rely on your chart analysis. ​Hold the line: Avoid getting shaken out during routine market breathers! 🧘‍♂️ ​🚀 Just starting your trading journey? Dive into the action and set up your Binance Registration today to get started! ​⚖️ Disclaimer: NFA (Not Financial Advice). ​#SP500 #USmarket #UsStocks $BTC {future}(BTCUSDT) $ETH {future}(ETHUSDT) $BNB {future}(BNBUSDT)
#sp500slipsfridaythirdstraightweeklygain

​📉 A minor 0.17% pullback for the S&P 500 this Friday—but don't let the red fool you. This is merely a healthy market consolidation following Thursday's explosive All-Time High. 📈

​🔥 We’ve officially secured three consecutive weeks in the green. The critical question now: Are we gearing up for a massive Week 4 rally, or is a broader market correction imminent? The momentum is shifting, and I am closely monitoring the tape. 🦅

​💡 Strategic Playbook for Traders:

​Maintain discipline: Keep your emotions in check.

​Trust the data: Rely on your chart analysis.

​Hold the line: Avoid getting shaken out during routine market breathers! 🧘‍♂️

​🚀 Just starting your trading journey? Dive into the action and set up your Binance Registration today to get started!

​⚖️ Disclaimer: NFA (Not Financial Advice).

​#SP500 #USmarket #UsStocks
$BTC
$ETH
$BNB
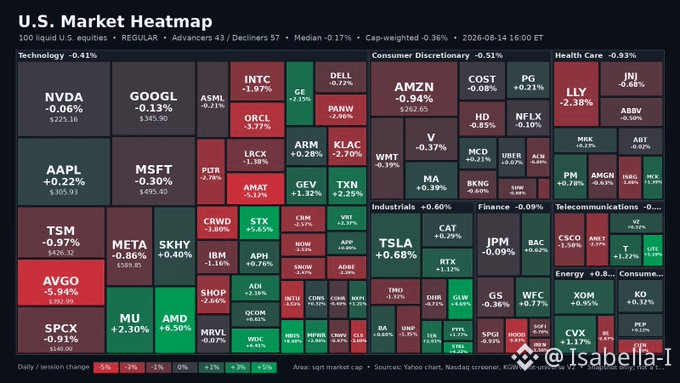
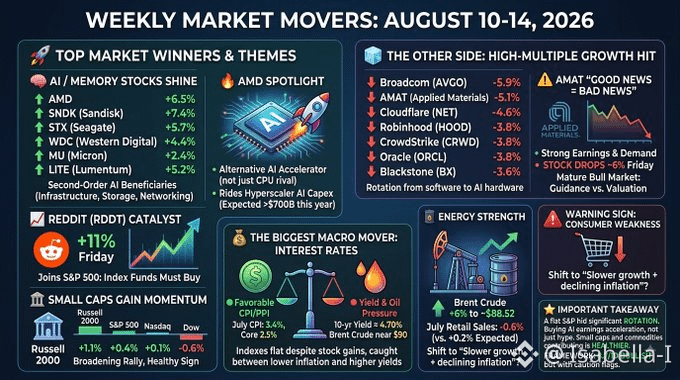
#sp500slipsfridaythirdstraightweeklygain The S&P 500 looked flat (+0.4%) this week, but massive rotations happened under the hood. Here is what you need to know: 1. The #AI Trade Expands Beyond $NVDA Capital rotated hard into memory, storage, and optical infrastructure: * $SNDK +7.4% | $AMD +6.5% | $STX +5.7% | $LITE +5.2% | $WDC +4.4% | $MU +2.4% 2. Key Single-Stock Drivers * $RDDT (+11%): Surged on S&P 500 inclusion catalyst. * $AMAT (-6%): Beat earnings but slid—market is demanding pristine guidance at current multiples. * Software/High-Multiple Tech: Took a backseat ( $AVGO , $NET , $CRWD , $ORCL seeing profit-taking). 3. Rally Breadth is Improving * Small Caps: Russell 2000 outperformed at +1.1%. * Energy & Commodities: Brent crude jumped ~6% to $88.50/bbl, boosting $SLB ,$DVN, and miners ( $NEM , $AEM.NE ). 4. The Macro Tug-of-War * 🟢 Cooling Inflation: July Core CPI at 2.5% YoY gives the Fed breathing room. * 🔴 Friction Points: 10Y yield hovering near 4.70%, oil pressing $90, and July Retail Sales surprising to the downside at -0.6%. The Takeaway: The rally is evolving from "buy anything AI" to rewarding tangible infrastructure earnings and broadening into small caps. Overall structure: 8.7/10 Bullish, imo—with a close eye on the consumer and yields. $EUL $LINK $THETA
#sp500slipsfridaythirdstraightweeklygain The S&P 500 looked flat (+0.4%) this week, but massive rotations happened under the hood. Here is what you need to know: 1. The #AI Trade Expands Beyond
$NVDA
Capital rotated hard into memory, storage, and optical infrastructure: *
$SNDK
+7.4% |
$AMD
+6.5% |
$STX
+5.7% |
$LITE
+5.2% |
$WDC
+4.4% |
$MU
+2.4% 2. Key Single-Stock Drivers *
$RDDT
(+11%): Surged on S&P 500 inclusion catalyst. *
$AMAT
(-6%): Beat earnings but slid—market is demanding pristine guidance at current multiples. * Software/High-Multiple Tech: Took a backseat (
$AVGO
,
$NET
,
$CRWD
,
$ORCL
seeing profit-taking). 3. Rally Breadth is Improving * Small Caps: Russell 2000 outperformed at +1.1%. * Energy & Commodities: Brent crude jumped ~6% to $88.50/bbl, boosting
$SLB
,$DVN, and miners (
$NEM
,
$AEM.NE
). 4. The Macro Tug-of-War *
🟢
Cooling Inflation: July Core CPI at 2.5% YoY gives the Fed breathing room. *
🔴
Friction Points: 10Y yield hovering near 4.70%, oil pressing $90, and July Retail Sales surprising to the downside at -0.6%. The Takeaway: The rally is evolving from "buy anything AI" to rewarding tangible infrastructure earnings and broadening into small caps. Overall structure: 8.7/10 Bullish, imo—with a close eye on the consumer and yields.
$EUL $LINK $THETA
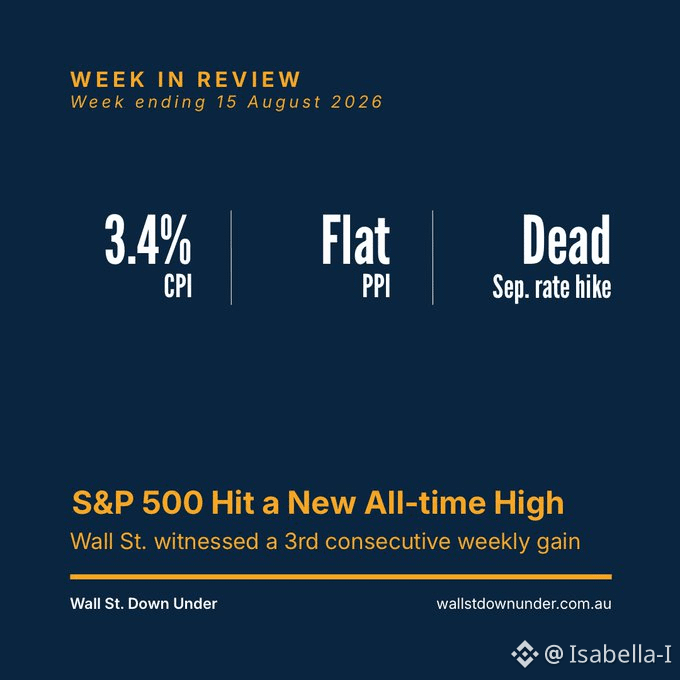
#sp500slipsfridaythirdstraightweeklygain Oil hit $89 on Iran tensions. Markets sold Mon-Tue. Then July CPI landed at 3.4% — Sep. rate hike: dead. S&P 500 hit a new all-time high on Thu. Third straight weekly gain. The anxiety machine and the pricing machine both showed up this week.$CL $LA $COLLECT
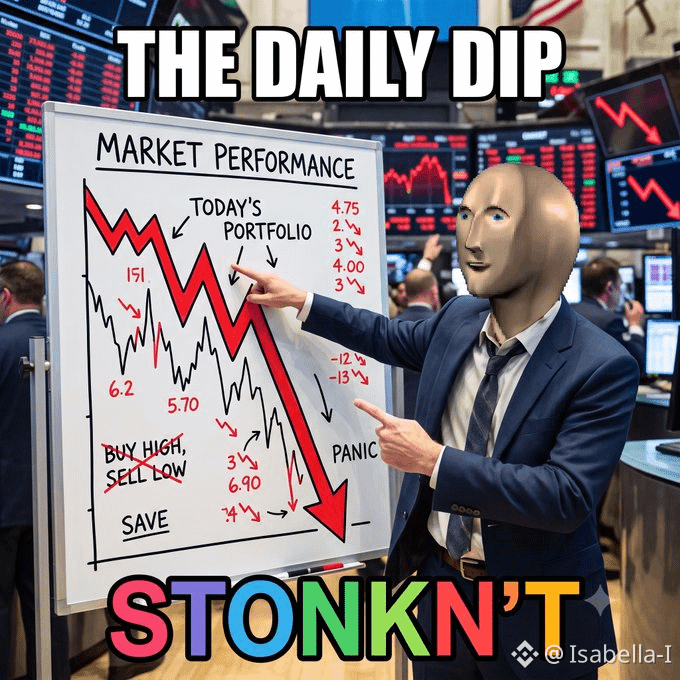
#sp500slipsfridaythirdstraightweeklygain The Daily Dip What a wild Friday… S&P hits a fresh ATH yesterday then immediately takes a chill pill like “nah I’m good” S&P500 $7,785 (DOWN 0.17%) NASDAQ $26,729 (DOWN 0.28%) GOLD $4,375 (UP 0.5%) OIL $82.40 (UP 1.4%) BITCOIN $62,900 (DOWN 0.7%) Markets just closed and the plot twist was real. Soft retail sales (biggest drop in 14 months) + consumer sentiment tanking sent the party to the curb after yesterday’s record high flex. Tech got the cold shoulder hard while oil decided to flex on Iran/Hormuz drama and US blockade vibes. Classic end-of-week “wait… what just happened?” energy. Biggest movers? Chips took the L (Applied Materials got smoked even on good numbers ), energy laughed all the way to the bank, and gold just quietly did its safe-haven thing like the responsible adult in the group chat.$BTC $XAU $BZ
#oiledgeshigher — but look past the headlines. The real bid isn't just geopolitics. It's the dollar. DXY just hit a 5-month low after weak US retail sales (99.6, -0.33%). When the dollar breaks, every dollar-priced asset gets a tailwind — oil and gold both. But they're running on different fuel: 🛢️$BZ ~$90 — supply risk premium, three fronts at once: · Strait of Hormuz: talks at an impasse, Iran lists conditions · Russia pumping ~1M bpd below OPEC+ quota after daily drone strikes · Black Sea tanker freight at record highs {future}(BZUSDT) 🥇$XAU ~$4,400 — not just safe haven: · Weak retail sales → Fed "hold" bets firming → real yields softer · Dollar at 5-month low = cheaper gold for every non-USD buyer · Central banks keep buying dips — this bid doesn't go away {future}(XAUUSDT) Same direction, different engine. Oil = supply shock beta. Gold = policy + reserve hedge. Together they're the classic stagflation pairing — and the dollar just lit the fuse on both. GLD +0.63%, USO +1.26% on the day the dollar broke. The tape agrees. 📈 #UkraineSaysOdesaBlackSeaPortsEffectivelyClosed #WallStreetBanksPledgeTrillionsForInfrastructureAndAI #SP500SlipsFridayThirdStraightWeeklyGain #GlobalStocksNearRecordHighs
#oiledgeshigher — but look past the headlines. The real bid isn't just geopolitics. It's the dollar.

DXY just hit a 5-month low after weak US retail sales (99.6, -0.33%). When the dollar breaks, every dollar-priced asset gets a tailwind — oil and gold both.

But they're running on different fuel:
🛢️$BZ ~$90 — supply risk premium, three fronts at once: · Strait of Hormuz: talks at an impasse, Iran lists conditions · Russia pumping ~1M bpd below OPEC+ quota after daily drone strikes · Black Sea tanker freight at record highs

🥇$XAU ~$4,400 — not just safe haven: · Weak retail sales → Fed "hold" bets firming → real yields softer · Dollar at 5-month low = cheaper gold for every non-USD buyer · Central banks keep buying dips — this bid doesn't go away

Same direction, different engine. Oil = supply shock beta. Gold = policy + reserve hedge. Together they're the classic stagflation pairing — and the dollar just lit the fuse on both.

GLD +0.63%, USO +1.26% on the day the dollar broke. The tape agrees. 📈

#UkraineSaysOdesaBlackSeaPortsEffectivelyClosed #WallStreetBanksPledgeTrillionsForInfrastructureAndAI #SP500SlipsFridayThirdStraightWeeklyGain #GlobalStocksNearRecordHighs
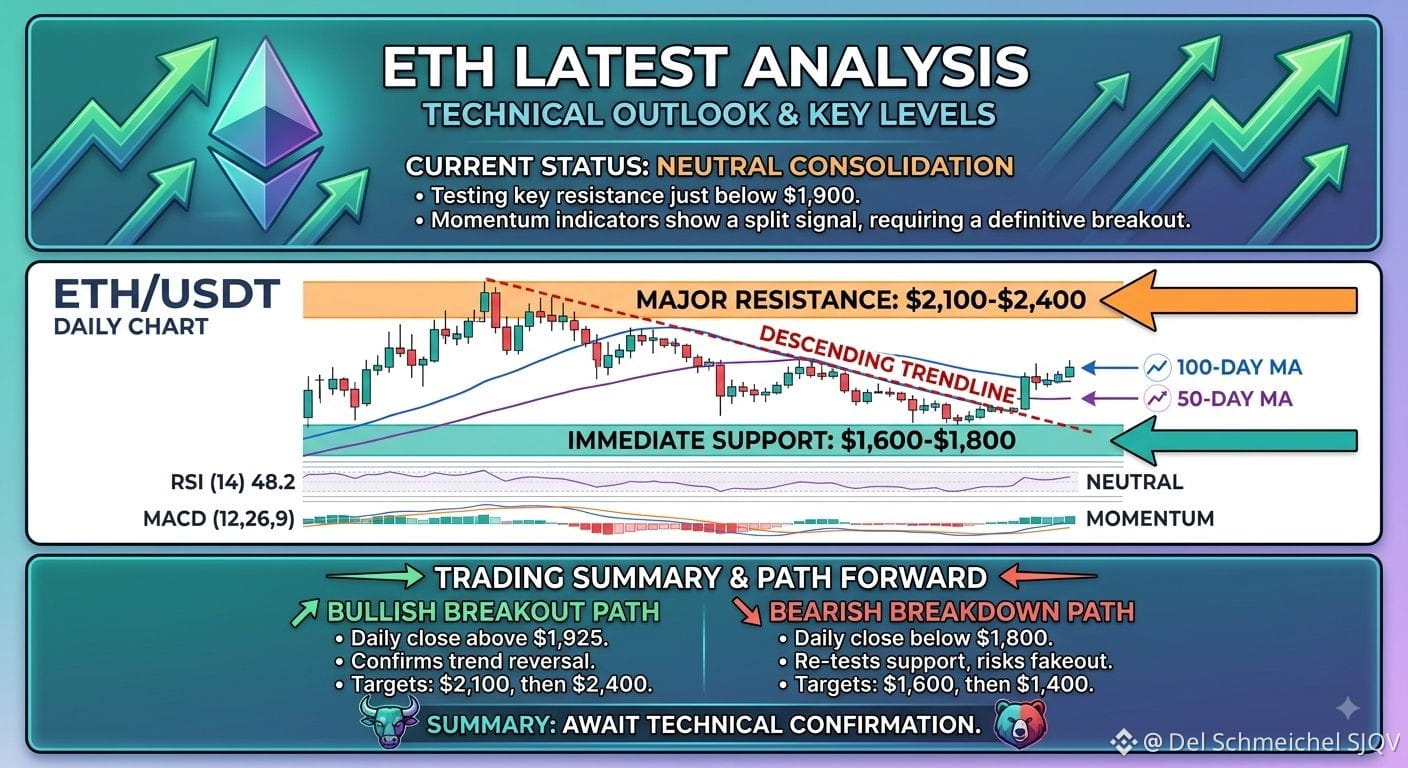
$ETH {spot}(ETHUSDT) has recently shown notable price volatility, influenced by broader cryptocurrency market trends and network-specific updates. Despite a recent minor correction, analysts maintain a bullish outlook for the remainder of the year. This optimism is driven by increasing adoption, the ongoing development of layer-2 solutions, and anticipation surrounding potential future upgrades. ​Technical indicators present a mixed signal, suggesting short-term consolidation before a potential breakout. However, long-term sentiment remains strongly positive, fueled by institutional interest and the growing relevance of the Ethereum ecosystem in decentralized finance (DeFi) and non-fungible tokens (NFTs). ​[Picture: A dynamic image illustrating the Ethereum logo and a rising price graph, symbolizing positive market momentum.] ​Key Takeaways: ​Volatility: ETH experiences price fluctuations reflecting overall market volatility. ​Bullish Long-term Outlook: Analysts predict a positive trajectory for ETH in the coming months. ​Network Development: Ongoing improvements and layer-2 adoption contribute to long-term growth. ​Institutional Interest: Increasing interest from institutions bolsters investor confidence. ​DeFi & NFT Role: Ethereum’s position as a foundation for DeFi and NFTs remains a key driver #BerkshireAddsToDeltaAndAlphabetHoldings #AnthropicQ2RevenueRoseOver14Fold #UkraineSaysOdesaBlackSeaPortsEffectivelyClosed #SP500SlipsFridayThirdStraightWeeklyGain
$ETH
has recently shown notable price volatility, influenced by broader cryptocurrency market trends and network-specific updates. Despite a recent minor correction, analysts maintain a bullish outlook for the remainder of the year. This optimism is driven by increasing adoption, the ongoing development of layer-2 solutions, and anticipation surrounding potential future upgrades.

​Technical indicators present a mixed signal, suggesting short-term consolidation before a potential breakout. However, long-term sentiment remains strongly positive, fueled by institutional interest and the growing relevance of the Ethereum ecosystem in decentralized finance (DeFi) and non-fungible tokens (NFTs).

​[Picture: A dynamic image illustrating the Ethereum logo and a rising price graph, symbolizing positive market momentum.]

​Key Takeaways:

​Volatility: ETH experiences price fluctuations reflecting overall market volatility.

​Bullish Long-term Outlook: Analysts predict a positive trajectory for ETH in the coming months.

​Network Development: Ongoing improvements and layer-2 adoption contribute to long-term growth.

​Institutional Interest: Increasing interest from institutions bolsters investor confidence.

​DeFi & NFT Role: Ethereum’s position as a foundation for DeFi and NFTs remains a key driver
#BerkshireAddsToDeltaAndAlphabetHoldings #AnthropicQ2RevenueRoseOver14Fold #UkraineSaysOdesaBlackSeaPortsEffectivelyClosed #SP500SlipsFridayThirdStraightWeeklyGain
·
--
Bullish
Log in to explore more content
Join global crypto users on Binance Square
⚡️ Get latest and useful information about crypto.
💬 Trusted by the world’s largest crypto exchange.
👍 Discover real insights from verified creators.
Email / Phone number