

#huma
huma
4.9M views
13,774 Discussing
Hot
Latest

·
--
🔴 $HUMA SHORT Setup
$HUMA is losing ground fast.
📊 HUMAUSDT exhibits distinct bearish momentum, evidenced by a substantial 24-hour decline exceeding 5%. This significant downward pressure, occurring on notable volume, suggests a firm hold by sellers. A short position aims to capitalize on the anticipated continuation of this bearish trend.
🎯 Trade Plan
Entry: 0.02257
Stop Loss: 0.02302
TP1: 0.02212
TP2: 0.02167
TP3: 0.02122
⚖️ Risk:Reward (TP1) 1:1.00
⚡ Trigger: Price at 0.02257
⚠️ Risk Note: Cryptocurrency trading is highly speculative and involves substantial risk of loss. Only commit capital you are prepared to lose.
Manage your risk and size positions wisely.
#HUMA #huma
1

·
--
$HUMA
🔻 $HUMA SHORT SETUP 🔴 Sellers are stepping in — here's the setup. ⚡
$HUMA is showing significant weakness, currently down by 4.88% over the last 24 hours as bearish momentum persists. The price is hovering near the lower end of its daily range, suggesting that sellers maintain control over the current price action.
📊 24h: -4.88% | Vol: $11,470,432.00
📉 TRADE PLAN
🔹 Entry: 0.02263
🛑 Stop Loss: 0.02380
🎯 TP1: 0.02087
🎯 TP2: 0.02029
🎯 TP3: 0.01971
⚖️ Risk:Reward (TP1): 1:1.50
🔔 Trigger: A clean breakdown and hourly candle close below the 0.02250 support level would confirm further downside potential for $HUMA.
⚠️ Risk Note: High volatility is present; ensure strict position sizing and stop-loss placement to manage potential upside whipsaws.
Always wait for the price to confirm the trend on lower timeframes before entering your position.
Click below 👇🏻 to trade
$HUMA
Follow @TZX_Crypto for more updates...
#HUMA #CryptoTrading #MarketAnalysis #BinanceSquare
$HUMA
🔻 $HUMA SHORT SETUP 🔴 Sellers are stepping in — here's the setup. ⚡
$HUMA is showing significant weakness, currently down by 4.88% over the last 24 hours as bearish momentum persists. The price is hovering near the lower end of its daily range, suggesting that sellers maintain control over the current price action.
📊 24h: -4.88% | Vol: $11,470,432.00
📉 TRADE PLAN
🔹 Entry: 0.02263
🛑 Stop Loss: 0.02380
🎯 TP1: 0.02087
🎯 TP2: 0.02029
🎯 TP3: 0.01971
⚖️ Risk:Reward (TP1): 1:1.50
🔔 Trigger: A clean breakdown and hourly candle close below the 0.02250 support level would confirm further downside potential for $HUMA .
⚠️ Risk Note: High volatility is present; ensure strict position sizing and stop-loss placement to manage potential upside whipsaws.
Always wait for the price to confirm the trend on lower timeframes before entering your position.
Click below 👇🏻 to trade
$HUMA
Follow @TZX_Crypto for more updates...
#HUMA #CryptoTrading #MarketAnalysis #BinanceSquare
26

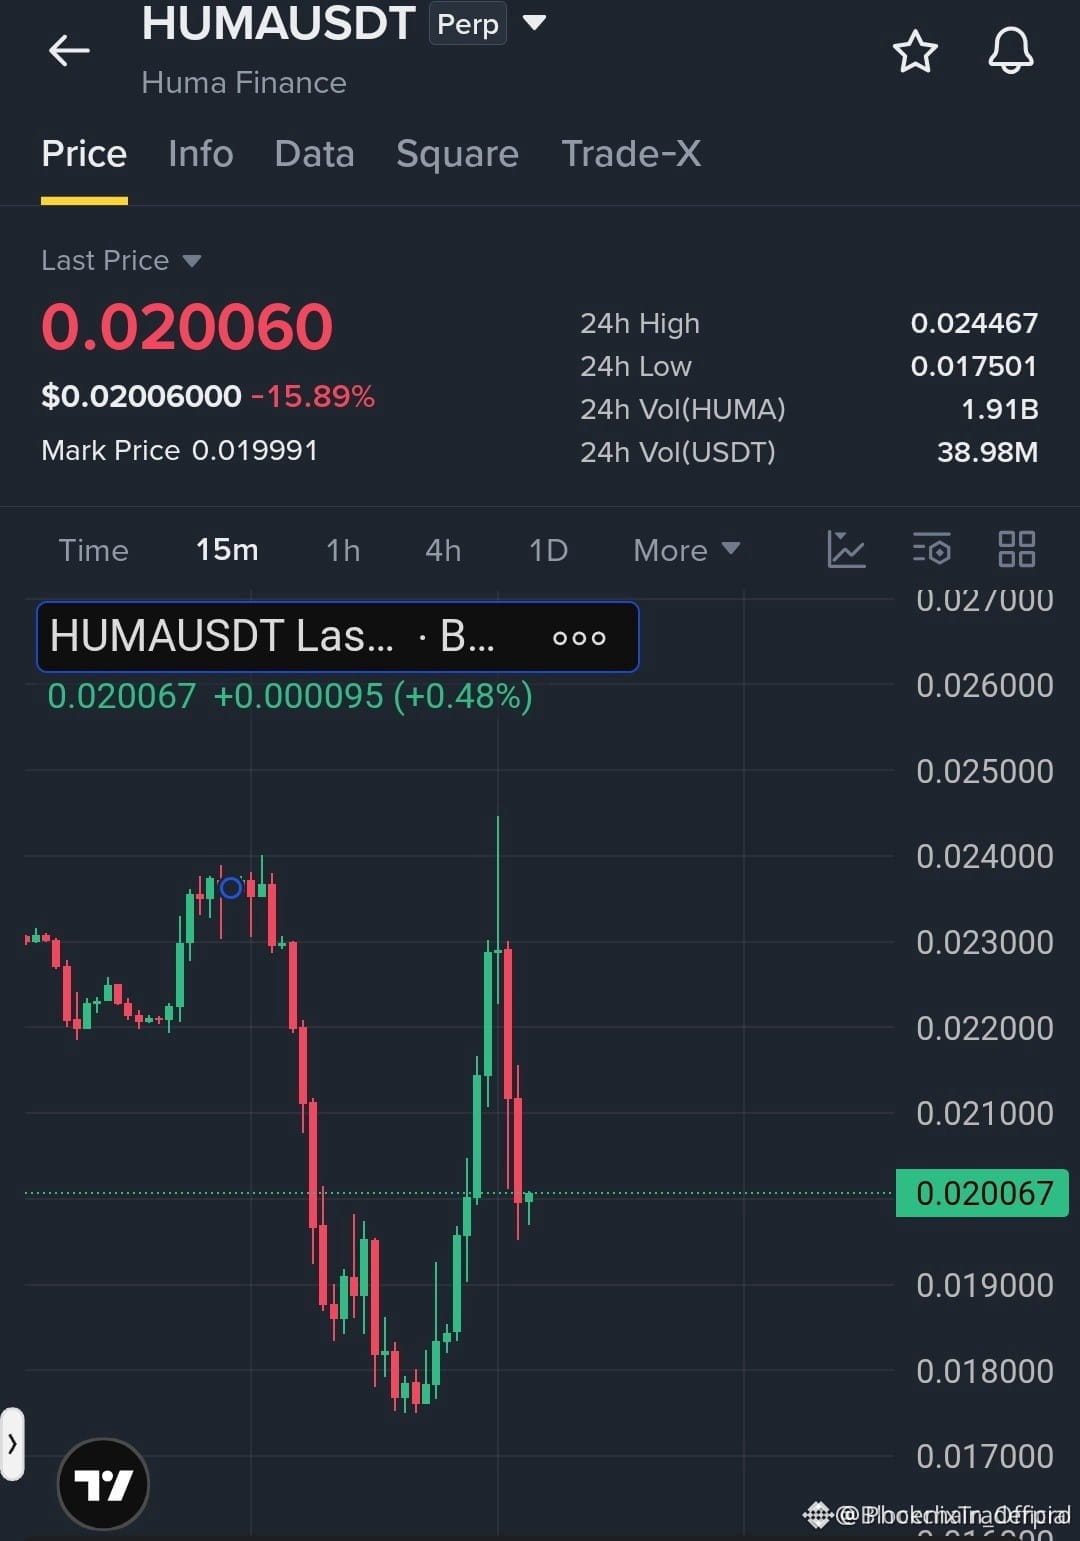
🔴 $HUMA SLIDES DEEPER AFTER SHARP REJECTION 🐻
Entry: 0.0200-0.0205 ⚡
Target: 0.0190 🚀
Target: 0.0180 🚀
Target: 0.0175 🚀
Stop Loss: 0.0215 ⚠️
The bears seized control after a brutal kick at $0.0230, wiping out the brief rally. Volume on the 4‑hour chart shows a clean sell‑off, and the $0.0200‑$0.0205 block now acts as fresh supply. 📊 If the price pierces the stop, liquidity will cascade lower, feeding the next demand bucket around $0.0190. 🦈
Liquidity sweeps are primed; each dip is likely devoured by smart money. Watch the $0.0180‑$0.0175 corridor as the next profit magnets. ⚡
💬 Do you see the bears holding the reins or is a short squeeze looming? 👇
⚠️ Not financial advice. Always manage your risk. 🛡️
🏷️ #HUMA #ShortSetup #Crypto #Bearish #Liquidity
🐻 🔥
3

·
--
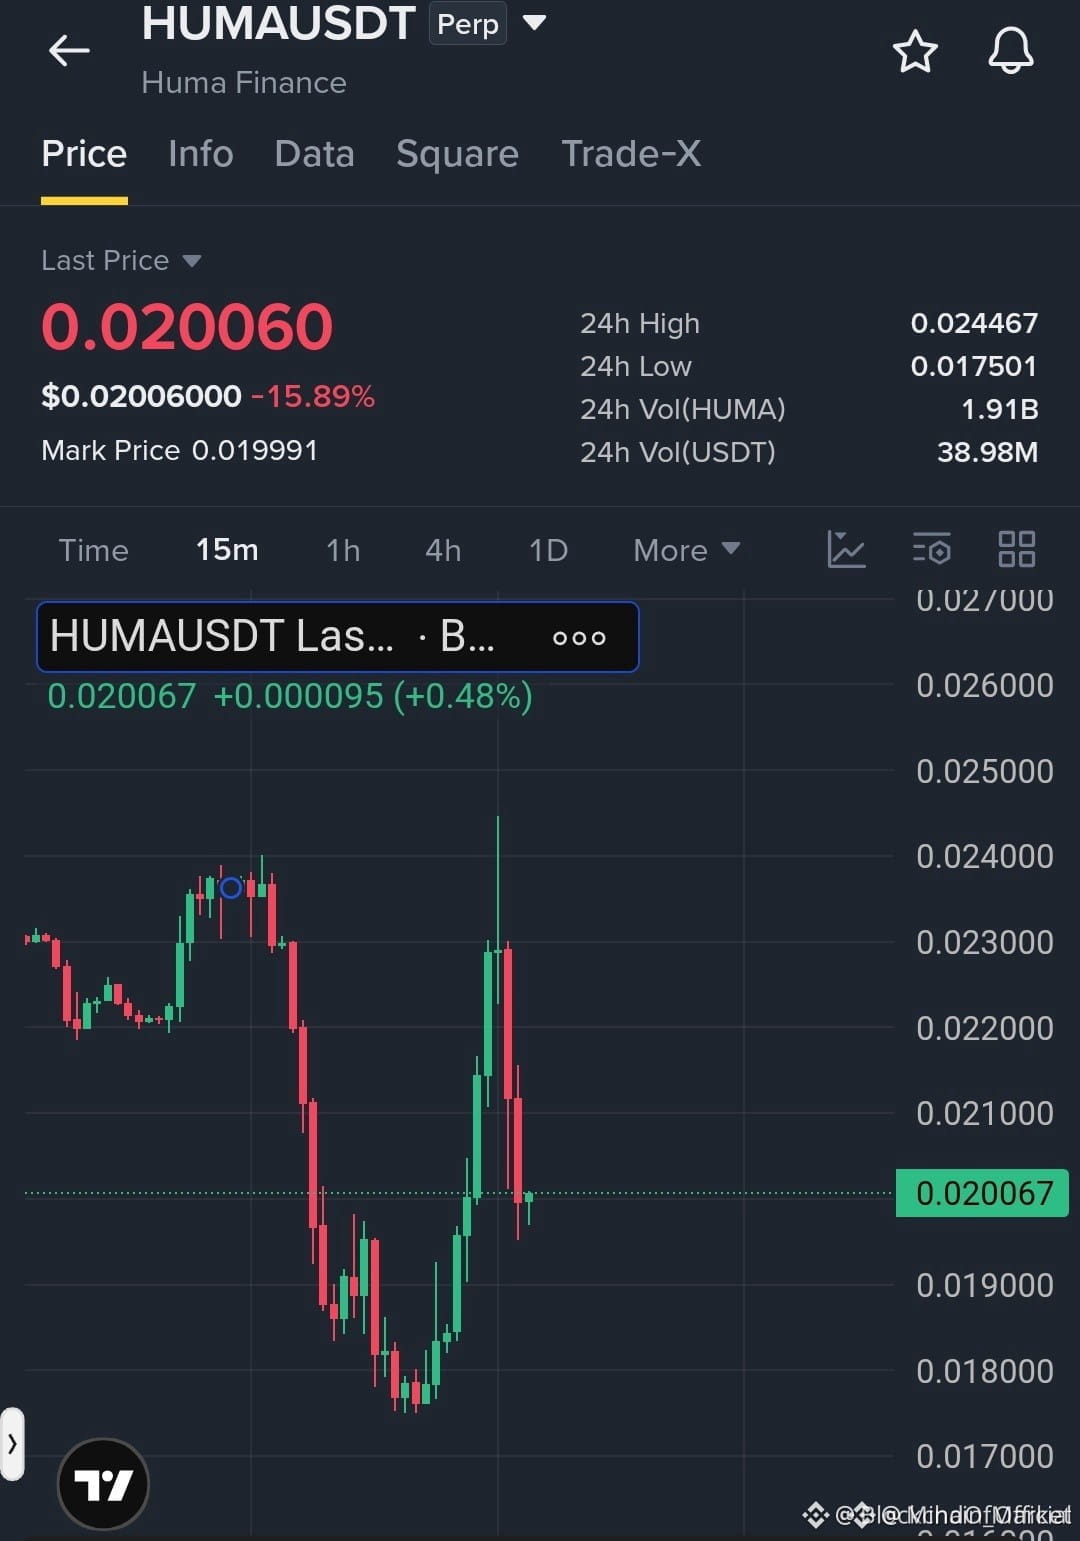
🔴 $HUMA SLIDES INTO DEEP BEAR ZONE AFTER SHARP REJECTION! 🦈
Entry: 0.0200-0.0205 ⚡
Target: 0.0190 🚀
Target: 0.0180 🚀
Target: 0.0175 🚀
Stop Loss: 0.0215 ⚠️
📊 The order flow turned hostile at $0.0230, sweeping liquidity and erasing the brief recovery. 🔍 Sellers now dominate, and the price is probing the short‑entry corridor $0.0200‑$0.0205, a textbook sell‑stop block. 🌊 A breach below $0.0205 would trigger a cascade toward deeper demand zones at $0.0190, $0.0180 and $0.0175, each a fresh liquidity pool for smart money. ⚡ Positioning now offers a tidy risk‑reward edge, but respect the stop at $0.0215. 💬 Are you ready to ride the downside wave or waiting for a reversal signal? 👇
⚠️ Not financial advice. Always manage your risk. 🛡️
🏷️ #HUMA #ShortSetup #LiquiditySweep #Crypto
🦈 🔥
6

·
--
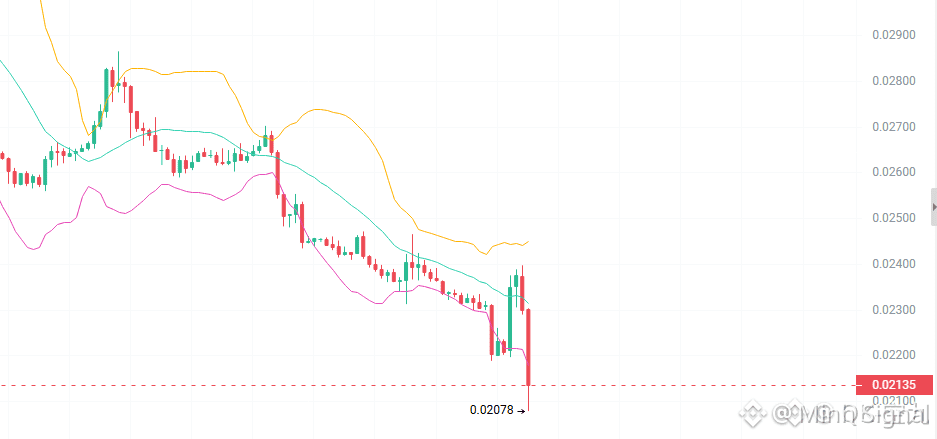
$HUMA is still looking fragile around $0.0213, down 10.5% in 24h with $11.27M traded. The 4h RSI at 36 hints at pressure, but this is not a clean bottom yet, especially with volume running 6.8x its 20-day average and longs still paying funding. I’m watching the $0.02 level closely: lose it, and the short-side momentum could accelerate fast. For now, #HUMA remains a high-risk chop zone ⚠️📉 #Crypto #Web3
Inspired by QK-空九 on Binance Square.
Inspired by QK-空九 on Binance Square.

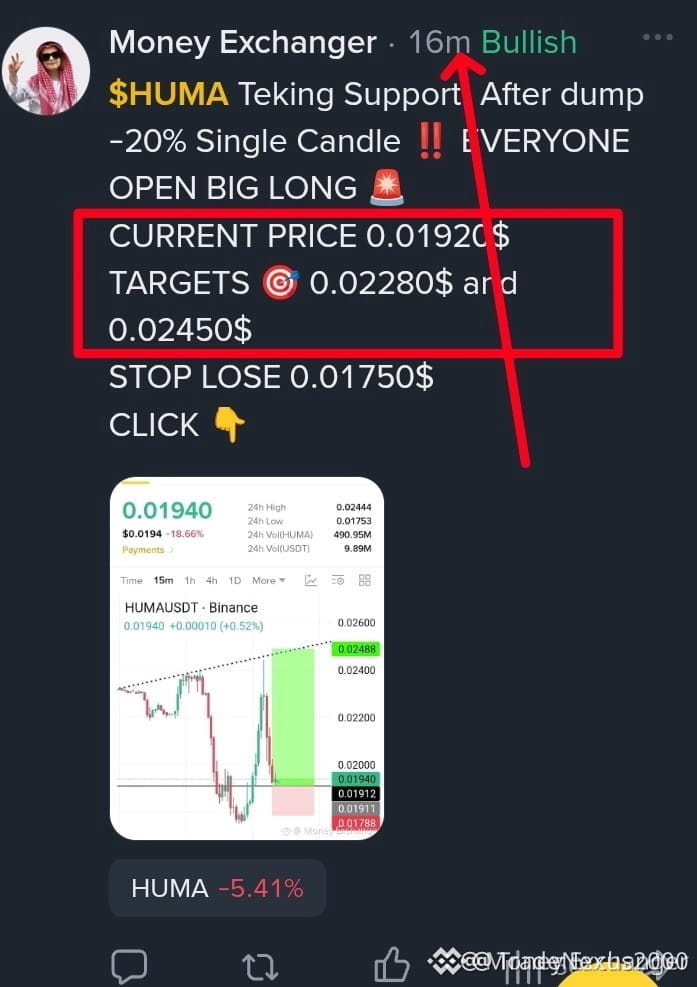
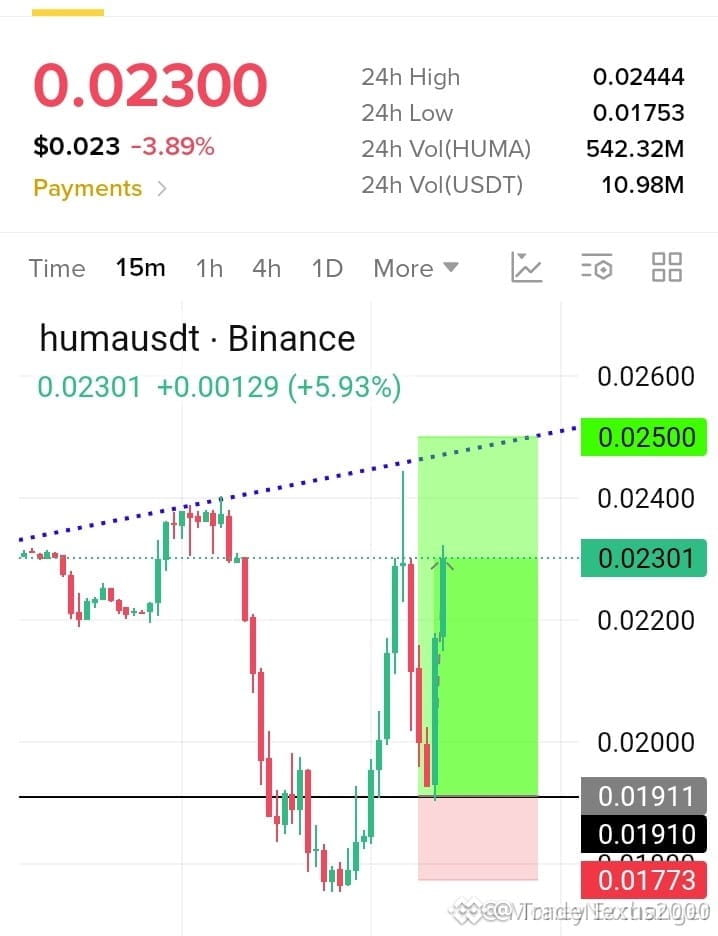
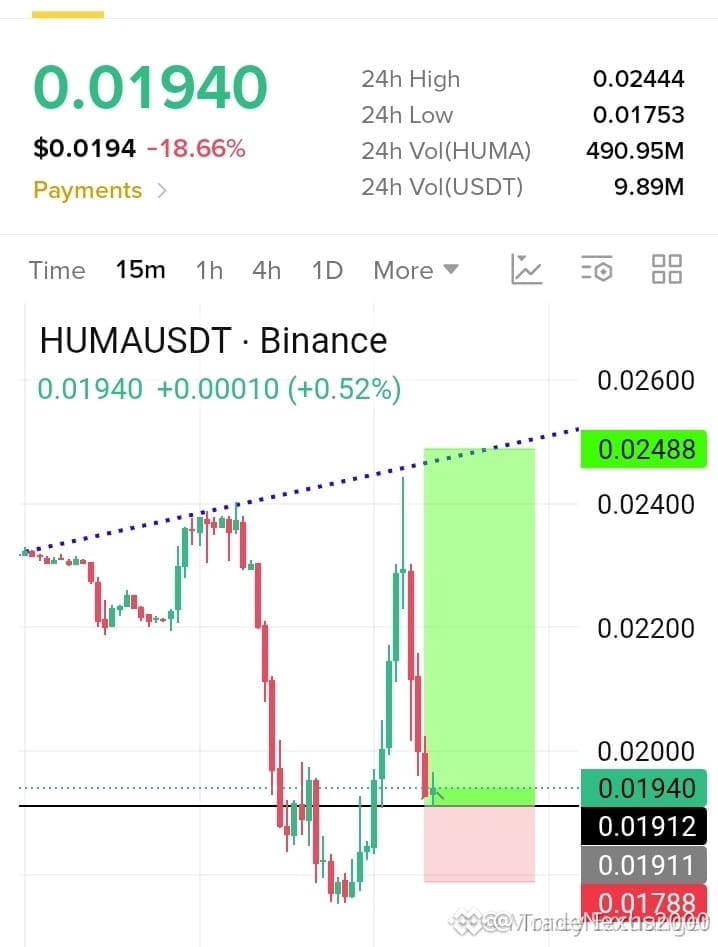
🚨 $HUMA MOMENTUM SURGE HITS TP1 – READY FOR NEXT LEG! 📈
Target: 0.02280 🚀
Target: 0.02450 🚀
📊 Liquidity sweep at 0.02280 proved the smart money's hand, snapping a tight demand block that held through the 15‑minute burst. Volume surged as buyers reclaimed the zone, confirming the bullish order block remains intact.
⚡ With momentum still charging, the next liquidity pool sits near 0.02450, a classic continuation target that aligns with the prevailing market structure. The price action respects the previous swing high, suggesting a clean run to the next imbalance. 💬 Are you stacking positions for the next leg or waiting for a retest? 👇
⚠️ Not financial advice. Always manage your risk. 🛡️
🏷️ #HUMA #LongSetup #Momentum #Crypto
🔥 💎
11

·
--
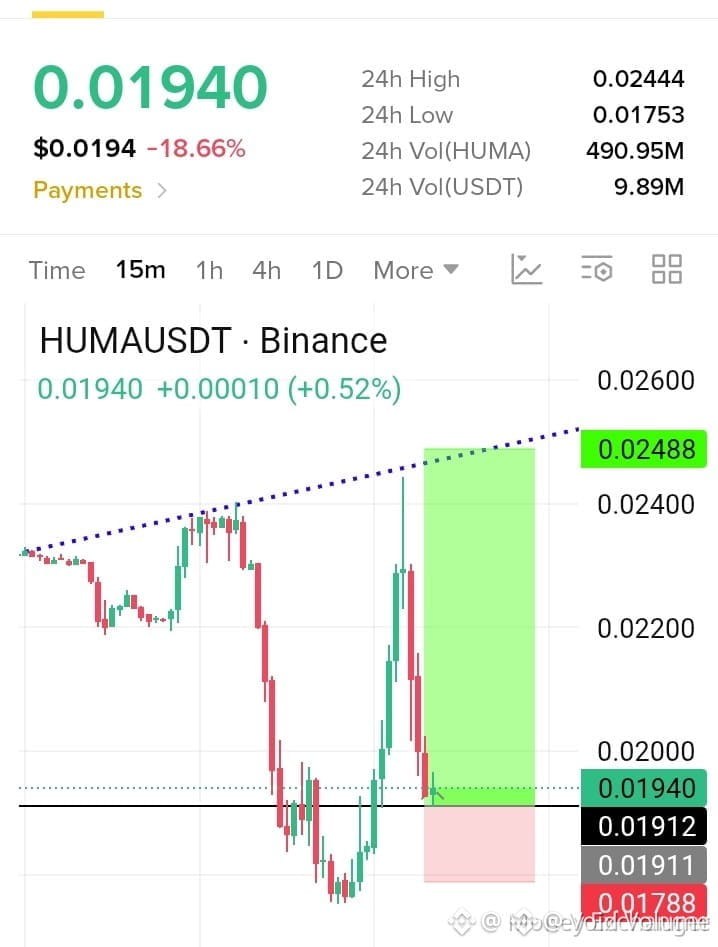
🚨 $HUMA BULLISH SWEEP AFTER 20% CANDLE DROP! 📈
Entry: 0.01920 ⚡
Target: 0.02280 🚀
Target: 0.02450 🚀
Stop Loss: 0.01750 ⚠️
The 0.01920 level has turned into a fresh demand block, swallowing the 20% single‑candle dump and forcing a liquidity vacuum. 🦈 Institutional buying is re‑anchoring here, and volume on the 4H is expanding, confirming the smart‑money footprint. 📊
With the next resistance at 0.02280 and a secondary target at 0.02450, the risk‑to‑reward skews heavily in favor of the long side. ⚡ A tight stop at 0.01750 caps downside while preserving upside potential. 📌
💬 Are you loading up on the retest?
⚠️ Not financial advice. Always manage your risk. 🛡️
🏷️ #HUMA #LongSetup #LiquiditySweep #Crypto
🚀 🦈
6

·
--
$HUMA
🔻 $HUMA SHORT SETUP 🔴 Sellers are stepping in — here's the setup. ⚡
$HUMA is currently experiencing significant bearish momentum, with a sharp 24-hour decline of 8.69% on high selling volume. The price is struggling to find a firm floor, suggesting that further downward pressure could be expected as market sentiment weakens.
📊 24h: -8.69% | Vol: $10,586,355.78
📉 TRADE PLAN
🔹 Entry: 0.02166
🛑 Stop Loss: 0.02274
🎯 TP1: 0.02004
🎯 TP2: 0.01950
🎯 TP3: 0.01895
⚖️ Risk:Reward (TP1): 1:1.50
🔔 Trigger: A confirmed hourly candle close below the current price level of 0.02166 to confirm continued selling dominance.
⚠️ Risk Note: High volatility is present; ensure you use tight stop losses and do not over-leverage in a fast-moving market.
Always wait for clear price action confirmation before entering any new positions.
Click below 👇🏻 to trade
$HUMA
Follow @T4_TZX for more updates...
#HUMA #CryptoTrading #MarketAnalysis #BinanceSquare
$HUMA
🔻 $HUMA SHORT SETUP 🔴 Sellers are stepping in — here's the setup. ⚡
$HUMA is currently experiencing significant bearish momentum, with a sharp 24-hour decline of 8.69% on high selling volume. The price is struggling to find a firm floor, suggesting that further downward pressure could be expected as market sentiment weakens.
📊 24h: -8.69% | Vol: $10,586,355.78
📉 TRADE PLAN
🔹 Entry: 0.02166
🛑 Stop Loss: 0.02274
🎯 TP1: 0.02004
🎯 TP2: 0.01950
🎯 TP3: 0.01895
⚖️ Risk:Reward (TP1): 1:1.50
🔔 Trigger: A confirmed hourly candle close below the current price level of 0.02166 to confirm continued selling dominance.
⚠️ Risk Note: High volatility is present; ensure you use tight stop losses and do not over-leverage in a fast-moving market.
Always wait for clear price action confirmation before entering any new positions.
Click below 👇🏻 to trade
$HUMA
Follow @T4_TZX for more updates...
#HUMA #CryptoTrading #MarketAnalysis #BinanceSquare
34

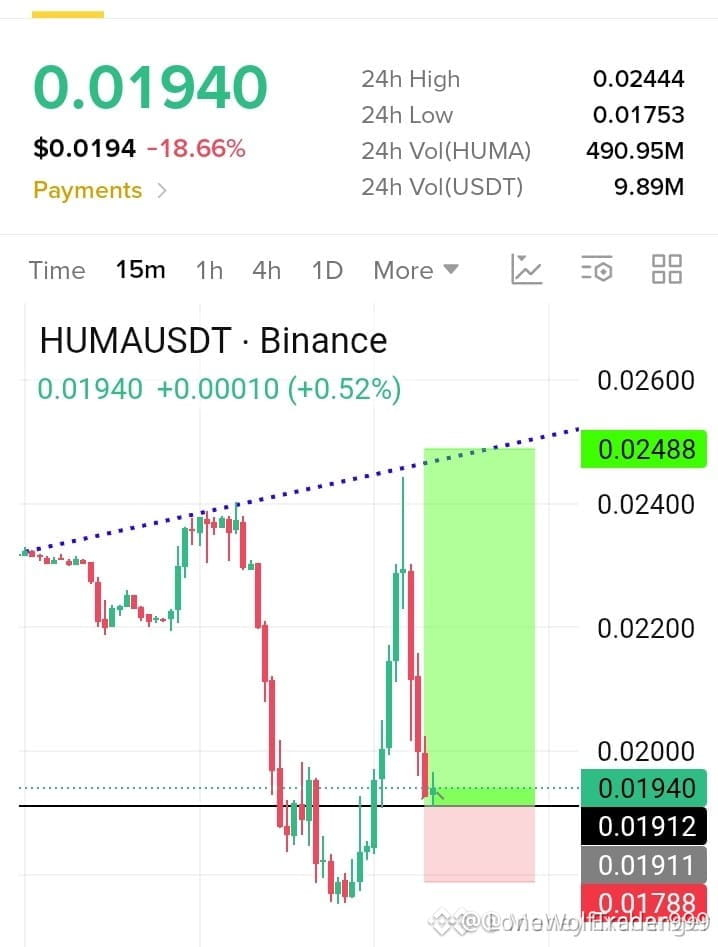
🚀 $HUMA SURGES AFTER 20% CANDLE CRASH—BIG LONG ALERT! 🟢
Entry: 0.01920 ⚡
Target: 0.02280 🚀
Target: 0.02450 🚀
Stop Loss: 0.01750 ⚠️
📊 The 20% single‑candle dump carved a fresh support zone at 0.01920, and smart‑money sharks have already been re‑stacking. 🦈 Volume spikes on the 1H chart confirm buyers are flipping the script, locking liquidity beneath the dip. ⚡ With the order block intact, the next resistance towers at 0.02280, then a second wave at 0.02450—ripe for a clean 1:3‑ish payoff. 📌 How are you positioning for the next liquidity sweep? 💬
⚠️ Not financial advice. Always manage your risk. 🛡️
🏷️ #HUMA #LongSetup #Breakout #Crypto
🔥 💎

·
--
🔻 Blood bath in altcoins today — GTC, HUMA, and T are all getting absolutely hammered. 14-19% red candles across the board. Let's break down where to fade the bounce 🧵
💡 Why these three together? All mid/small-cap alts getting nuked on surging volume. When selling pressure this synchronized, the bounce trades are where the edge is — shorting the relief rally.
📉 GTC — Down 14.46% with RSI at 35.3 (leaning bearish on 4H). Price trading below both SMA7 and SMA25 on the 4H chart, confirming downtrend structure. Volume ratio at 0.45x suggests sellers are in control with no capitulation spike yet.
⚡ Plan: Short $0.2160–$0.2360 | SL $0.2665 | TP $0.2094
📉 HUMA — The worst of the three at -19.28%. RSI deeply oversold at 20.2 on 4H which screams dead cat bounce incoming. But the trend is a strong downtrend and vol ratio at 6.1x tells you institutions are dumping hard.
⚡ Plan: Short $0.0181–$0.0193 | SL $0.0213 | TP $0.0175
📉 T — Down 18.86% with RSI at 42.5 (not yet oversold, room to fall further). Surging volume at 2.39x ratio confirms aggressive selling. Strong downtrend on 4H with price well below all moving averages.
⚡ Plan: Short $0.00436–$0.00502 | SL $0.00601 | TP $0.00423
⚠️ These are counter-trend fade trades on heavy sell days. Tight stops are non-negotiable. Don't fight the tape if the bounce is stronger than expected.
🤔 Which of these beaten-down alts do you think has the best dead cat bounce potential? Drop your pick below 👇
#GTC #HUMA #T
188
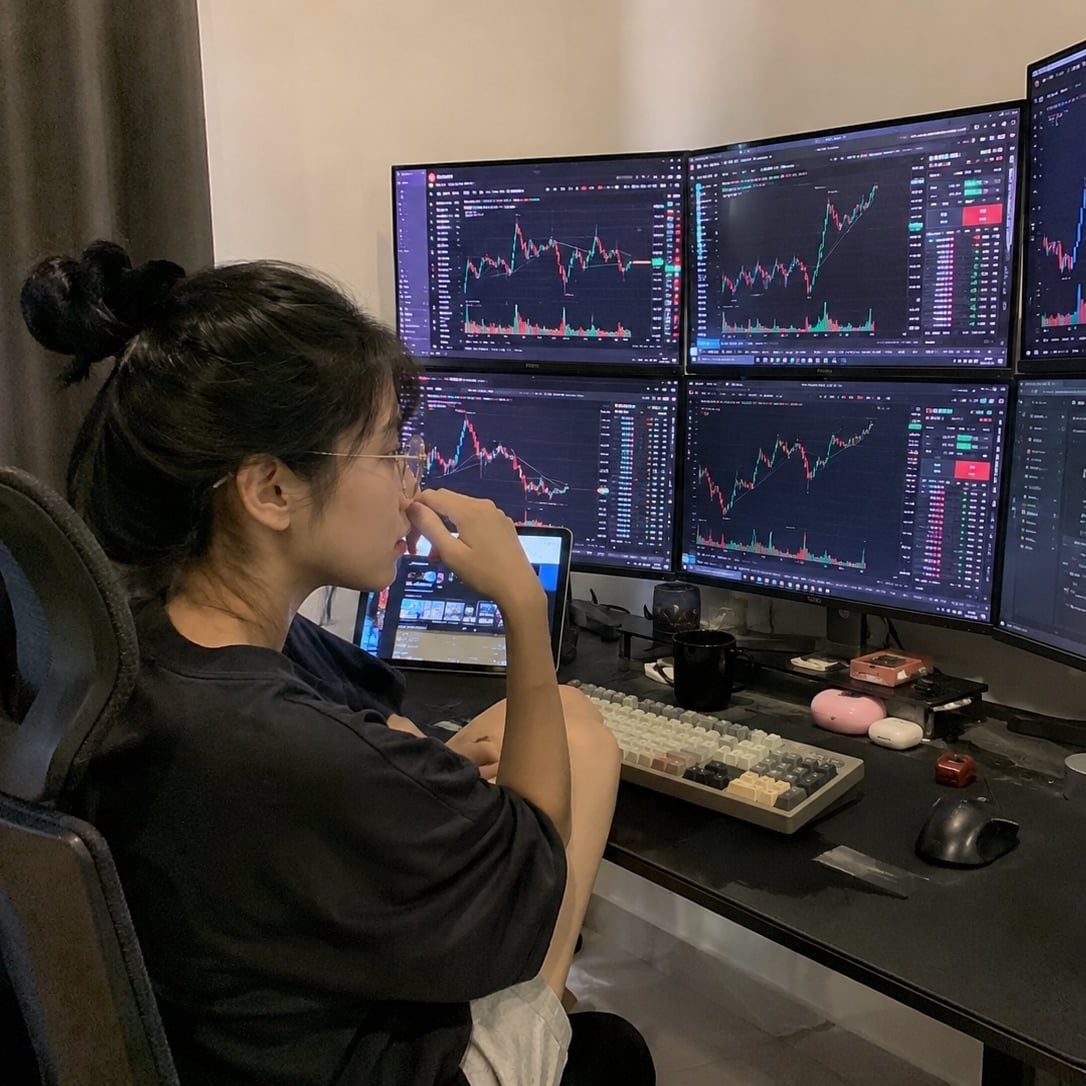
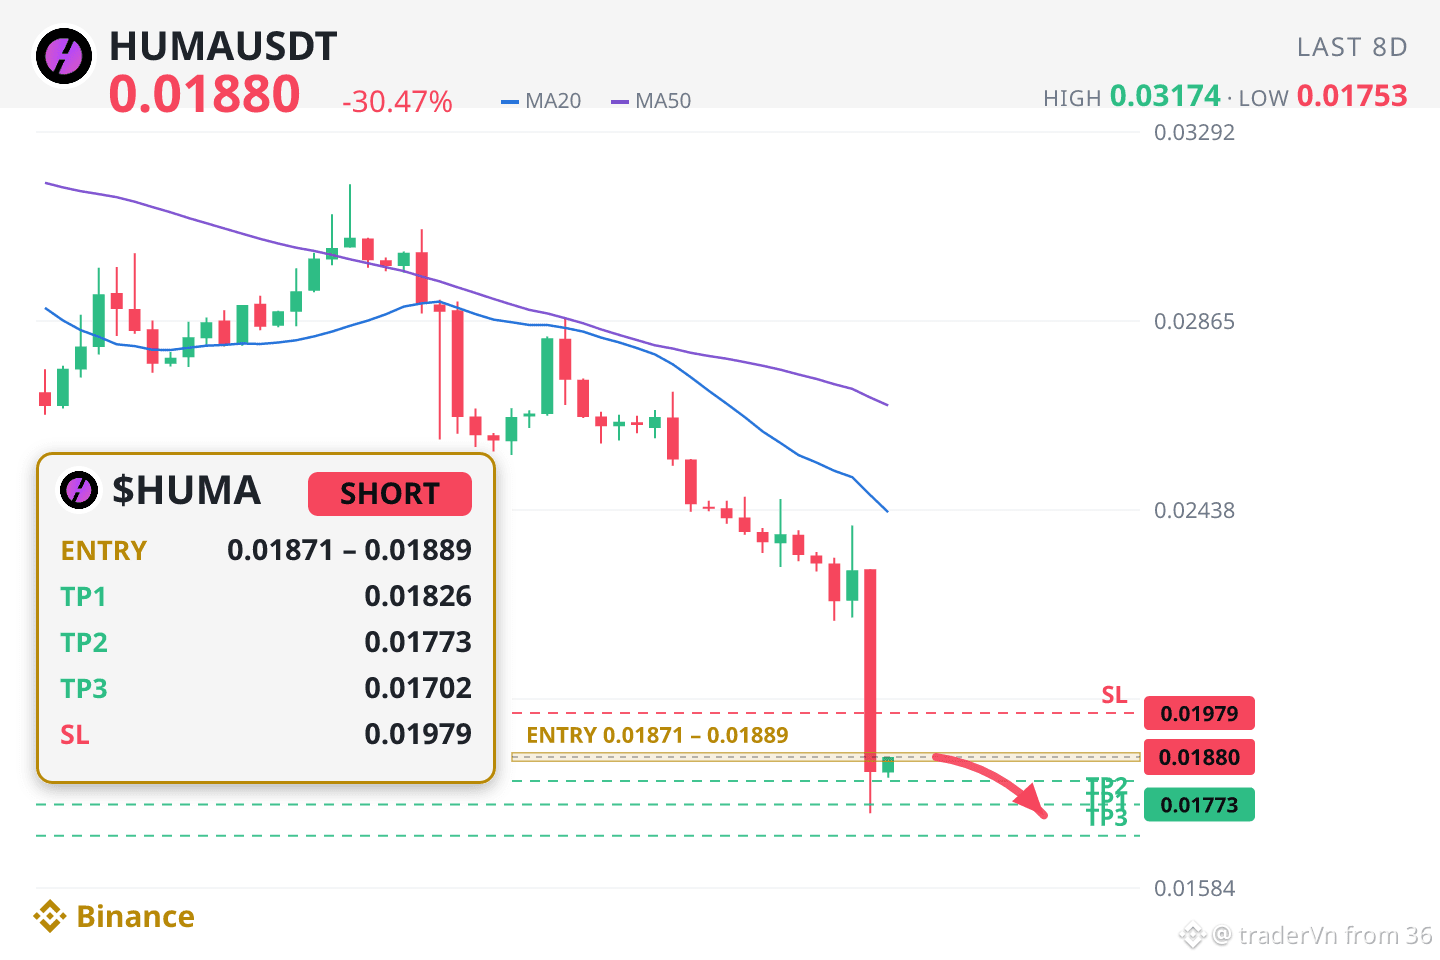
🔥 SHORT HUMA −19% in 24h — ladder just rebuilt on the new price
$HUMA $QNT $ENA
🎯 Entry: 0.018706 - 0.018894
• TP1: 0.01826
• TP2: 0.017729
• TP3: 0.017018
• DCA: 0.019176
• SL: 0.019791
🟡 Risk: 5/10 (medium — moderate)
• Volume: Use modest position size and manage volume strictly
• Why these levels
• TP1 0.01826 is not a guess: across the last 519 sessions, 75% of periods touched that level at some point
• The SL sits further out (5.27%) than TP1 (2.87%) BY DESIGN: a tight stop gets swept while waiting. In exchange, TP1 carries a 75% hit rate
• A normal day on this coin moves 3.39%. The ladder asks for nothing more than a normal day
• Sitting 71.9% below the period high
• This coin swings 6.67% a day, so the distance to TP1 fits inside one session — fast in both directions, hence 5/10
Hottest movers right now: QNT +17.4% · ENA +4.7%
Feel free to ask questions, request a coin review, or share your trading thoughts.
#HUMA #CryptoTrading
For reference only, not financial advice (DYOR).
8

·
--
HUMA: THE NARRATIVE ISN'T ENOUGH TO STOP A WEAKENING STRUCTURE.
THE MARKET READ
0.01871 | 24H -19.32%
4H STRUCTURE: BEARISH
1H CONFIRMATION: BEARISH
RELATIVE VOLUME: 24.77x
THE NARRATIVE
Huma Finance: Huma Finance is the first PayFi network, powering the financing of global payments with instant access to liquidity - anywhere, anytime. Huma Finance enables global payment institutions to settle their payments 24/7 using stablecoins and liquidity on-chain.
MY VIEW — BEARISH
Bearish. The key issue is not one red candle, but whether lower highs and weakening participation continue to reinforce the 4H structure.
WHAT WOULD CONFIRM IT
1H confirms the bearish 4H structure; momentum and timeframe alignment support this read.
This is narrative analysis, not a trade signal. Verify current market data and project claims before acting.
#HUMA #Crypto #MarketStructure
4
·
--
🚨 $HUMA PLUNGES DEEP INTO BEAR ZONE – LIQUIDITY SWEEP ALERT! 🔴
📊 The recent 24‑hour sell‑off has ripped $HUMA through a key order block, exposing a deep liquidity pool that smart money likely harvested. 🦈 Volume spikes on the 1‑hour chart confirm aggressive buying pressure being flushed out, while the price sits below the prior swing low, turning the area into a magnet for further short entries. 📌 Watch the 4‑hour trendline; a break below it would signal a continuation of the bearish wave and set the stage for a potential retest of the next supply zone. 🔍
💬 Do you see a fresh short entry opportunity or are you waiting for a decisive breakdown to confirm the next leg? 👇
⚠️ Not financial advice. Always manage your risk. 🛡️
🏷️ #HUMA #ShortSetup #BearMarket #Crypto #Liquidity
🦈 ⚡
3

·
--
🚨 $HUMA PLUNGES INTO BEAR ZONE! 🔴
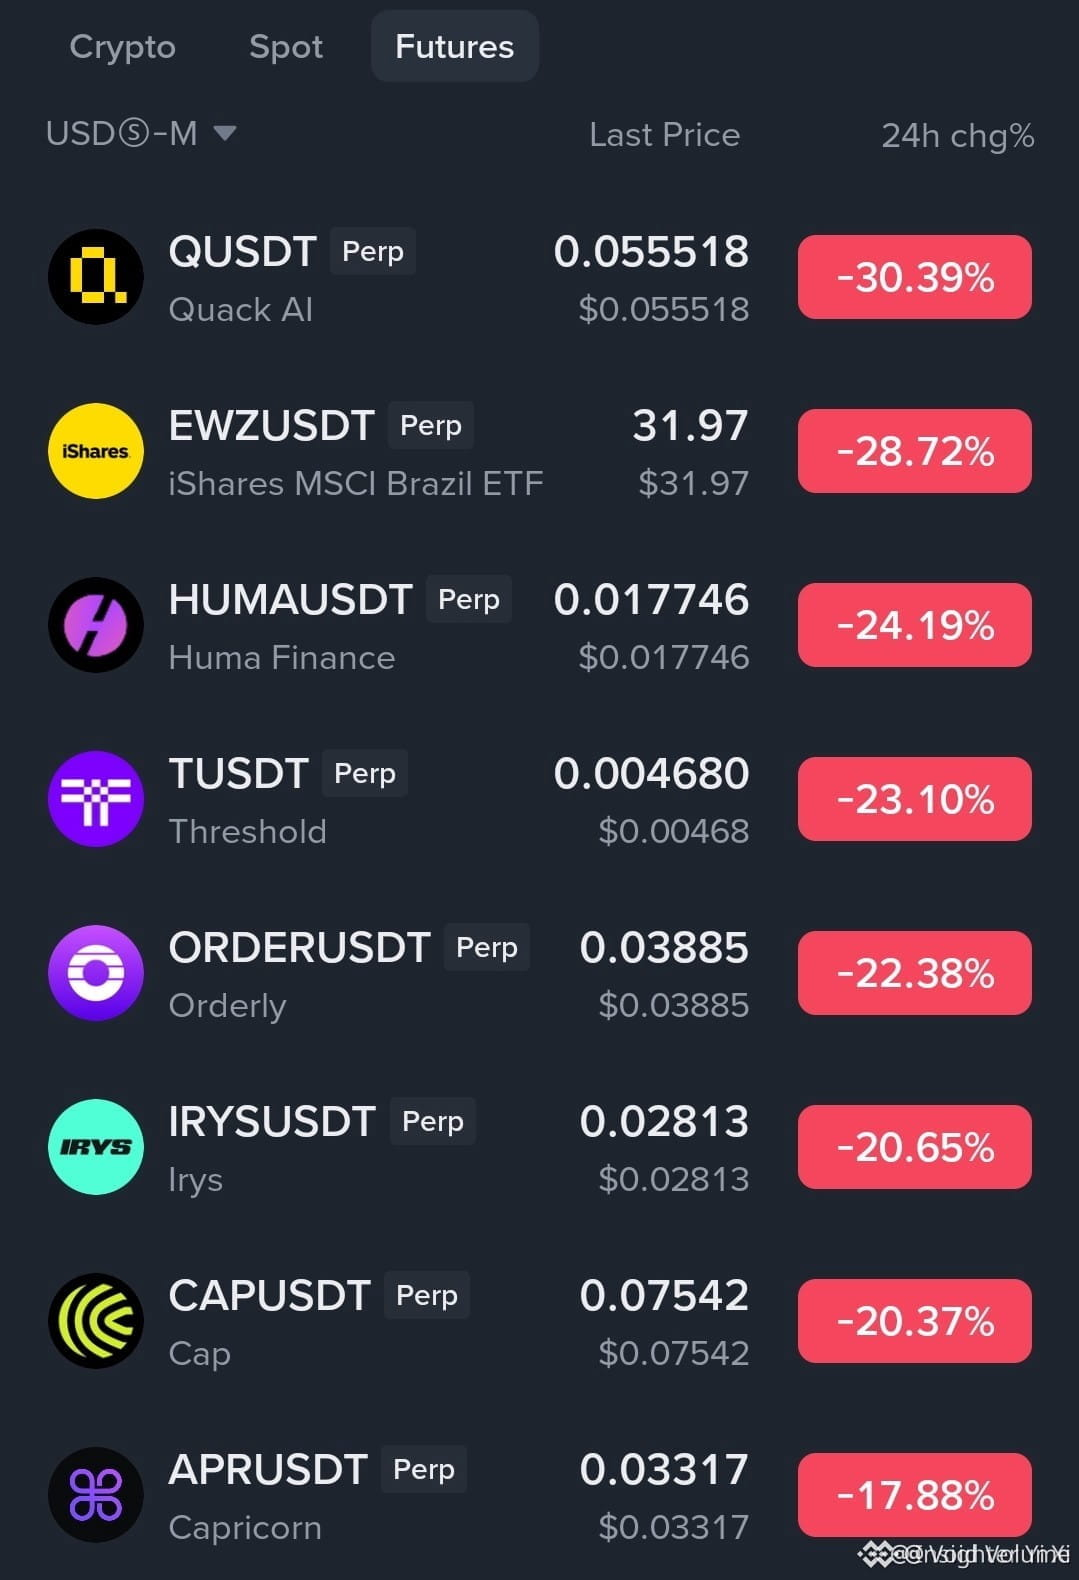
📊 The top eight losers are screaming red, with $HUMA down over 24% and volatility spiking. 📉 Sellers are sweeping liquidity, forcing weak bounce attempts that crumble on the 4H chart. 🦈 Smart money is likely offloading, leaving a thin order book ripe for aggressive short entries only after a clean breakdown confirmation.
💡 Keep eyes on the next support crack; a decisive break could fuel a deeper retrace. 🤔 Are you waiting for that confirmatory dip or already positioning for the next wave? 👇
⚠️ Not financial advice. Always manage your risk. 🛡️
🏷️ #HUMA #ShortSetup #Bearish #Crypto
🔥 🦈
11


·
--
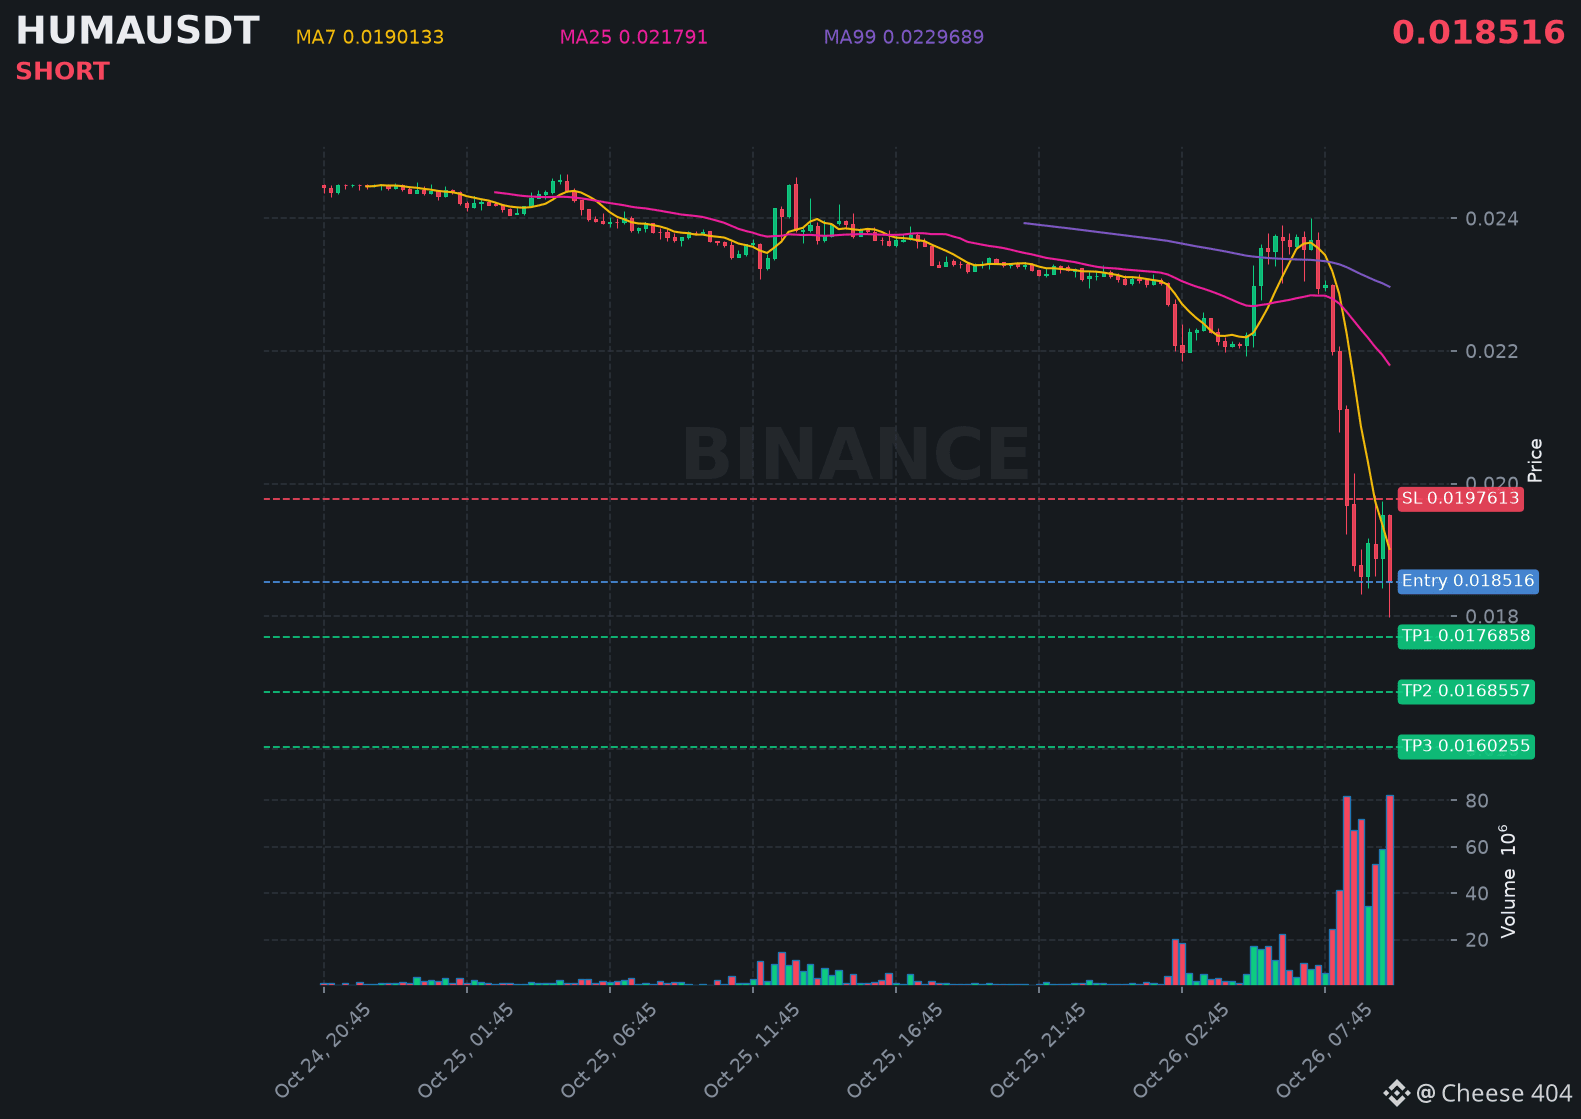
$HUMA just printed a strong bearish candle, signaling more downside pressure building right now.
📍 @ 0.018516 | Volume: 1.53M USD
RSI 26 | EMA20: 0.0208928 USD
📈 Trade Plan:
📈 Entry: 0.0182669 – 0.0187651
🛑 Stop Loss: 0.0197613
🎯 TP1: 0.0176858
🎯 TP2: 0.0168557
🎯 TP3: 0.0160255
Waiting for confirmation, then riding the downtrend.
👉 $HUMA 👈 Catch it
#HUMA
📍 @ 0.018516 | Volume: 1.53M USD
RSI 26 | EMA20: 0.0208928 USD
📈 Trade Plan:
📈 Entry: 0.0182669 – 0.0187651
🛑 Stop Loss: 0.0197613
🎯 TP1: 0.0176858
🎯 TP2: 0.0168557
🎯 TP3: 0.0160255
Waiting for confirmation, then riding the downtrend.
👉 $HUMA 👈 Catch it
#HUMA
Leyyyla:
..86743109..💸🙏💸
1
65

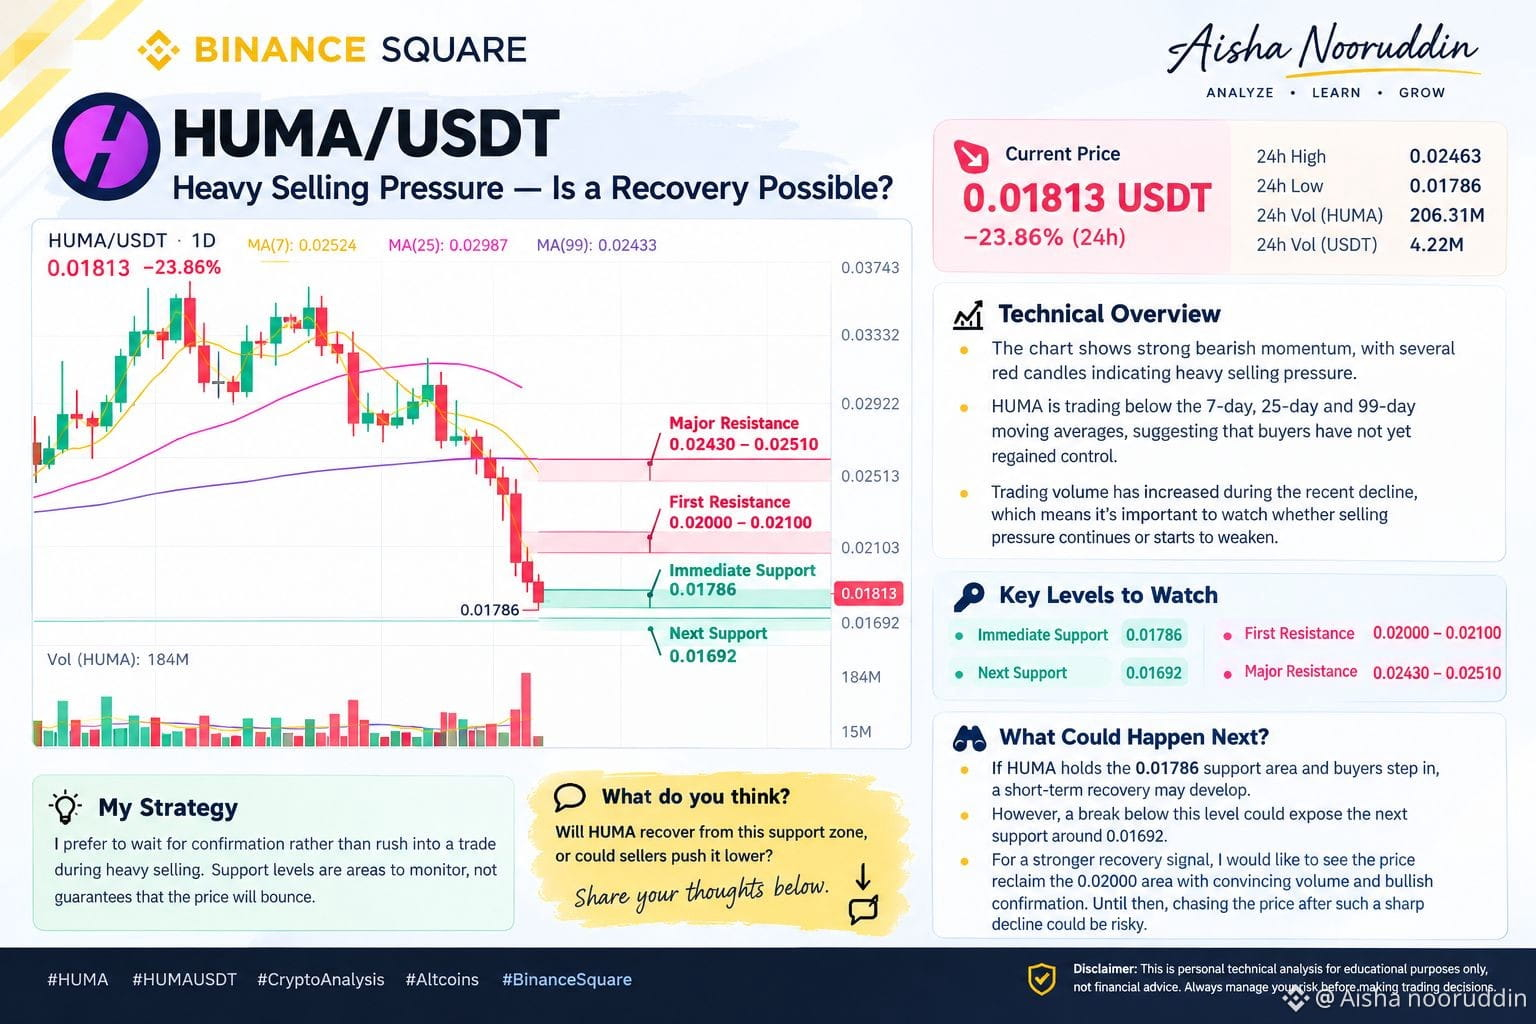
$HUMA /USDT is showing significant weakness , with the price trading around 0.01813 USDT at the , down approximately 23.86% in 24 hours.
📉 Technical Market
strong bearish momentum, with several consecutive red candles indicating heavy selling pressure. $HUMA
{spot}(HUMAUSDT)
is trading below its 7-day, 25-day, and 99-day moving averages, suggesting that buyers have not yet regained control.
Trading volume has also increased during the recent decline, making it important to watch whether selling pressure continues or starts to weaken.
🔑 Key Levels to Watch
* Immediate support: 0.01786 USDT
* Next support area: 0.01692 USDT
* First resistance: 0.02000–0.02100 USDT
* Major resistance zone: 0.02430–0.02510 USDT
👀 What Could Happen Next?
If HUMA holds the 0.01786 support area and buyers step in, a short-term recovery may develop. However, a break below this level could expose the next support around 0.01692.
lFor a stronger recovery signal, I would like to see the price reclaim the 0.02000 area with convincing volume and bullish confirmation. Until then, chasing the price after such a sharp decline could be risky.
💡 My Strategy
I prefer to wait for confirmation rather than rush into a trade during heavy selling. Support levels are areas to monitor, not guarantees that the price will bounce.
What do you think? Will $HUMA recover from this support zone, or could sellers push it lower? Share your thoughts below. 👇
#HUMA #HUMAUSDT #CryptoAnalysis #Altcoins #BinanceSquare
$HUMA /USDT is showing significant weakness , with the price trading around 0.01813 USDT at the , down approximately 23.86% in 24 hours.
📉 Technical Market
strong bearish momentum, with several consecutive red candles indicating heavy selling pressure. $HUMA
is trading below its 7-day, 25-day, and 99-day moving averages, suggesting that buyers have not yet regained control.
Trading volume has also increased during the recent decline, making it important to watch whether selling pressure continues or starts to weaken.
🔑 Key Levels to Watch
* Immediate support: 0.01786 USDT
* Next support area: 0.01692 USDT
* First resistance: 0.02000–0.02100 USDT
* Major resistance zone: 0.02430–0.02510 USDT
👀 What Could Happen Next?
If HUMA holds the 0.01786 support area and buyers step in, a short-term recovery may develop. However, a break below this level could expose the next support around 0.01692.
lFor a stronger recovery signal, I would like to see the price reclaim the 0.02000 area with convincing volume and bullish confirmation. Until then, chasing the price after such a sharp decline could be risky.
💡 My Strategy
I prefer to wait for confirmation rather than rush into a trade during heavy selling. Support levels are areas to monitor, not guarantees that the price will bounce.
What do you think? Will $HUMA recover from this support zone, or could sellers push it lower? Share your thoughts below. 👇
#HUMA #HUMAUSDT #CryptoAnalysis #Altcoins #BinanceSquare
417
🚀 $HUMA PREPARES TO EXPLODE FROM CRITICAL DEMAND ZONE! 💥
Entry: 0.02180 – 0.02210 ⚡
Target: 0.02350 🚀
Stop Loss: 0.02120 ⚠️
Sellers are losing control as $HUMA builds a solid floor right above support. 📊 Order flow indicates smart money is actively absorbing bids in this tight accumulation pocket, laying the groundwork for a violent leg up.
Risk-to-reward on this execution is incredibly sharp. ⚡ Keep your eyes on volume expansion as rotation ripples across momentum plays like $ZEC and $DASH . 💬 Are you placing your bids early or chasing the green candle after the flip? 👇
⚠️ Not financial advice. Always manage your risk. 🛡️
🏷️ #HUMA #LongSetup #Crypto #Breakout #Altcoins
🔥 💎
5

·
--
Bearish
#HUMA pumped like it drank 3 Red Bulls at 18:53 🚀💚 0.0239 to 0.0244 in 2 candles, volume went BRRR 400K 💥
Me: Oh we rich now? 💸🤩
Market 2 minutes later: SIKE 🔴📉 -9.95% and back to 0.02416 😭
Order book saying 55% sellers vs 44% buyers, classic "we climb, they dump" story 🤝😅
Today -4%, 7 days -14%... my portfolio needs therapy 🧠💔
Not financial advice, just emotional damage. Who else got huma-nated today? 🙋♂️$HUMA
{future}(HUMAUSDT)
#HUMA pumped like it drank 3 Red Bulls at 18:53 🚀💚 0.0239 to 0.0244 in 2 candles, volume went BRRR 400K 💥
Me: Oh we rich now? 💸🤩
Market 2 minutes later: SIKE 🔴📉 -9.95% and back to 0.02416 😭
Order book saying 55% sellers vs 44% buyers, classic "we climb, they dump" story 🤝😅
Today -4%, 7 days -14%... my portfolio needs therapy 🧠💔
Not financial advice, just emotional damage. Who else got huma-nated today? 🙋♂️$HUMA
279

·
--
📊 $HUMA Technical Analysis & Setup
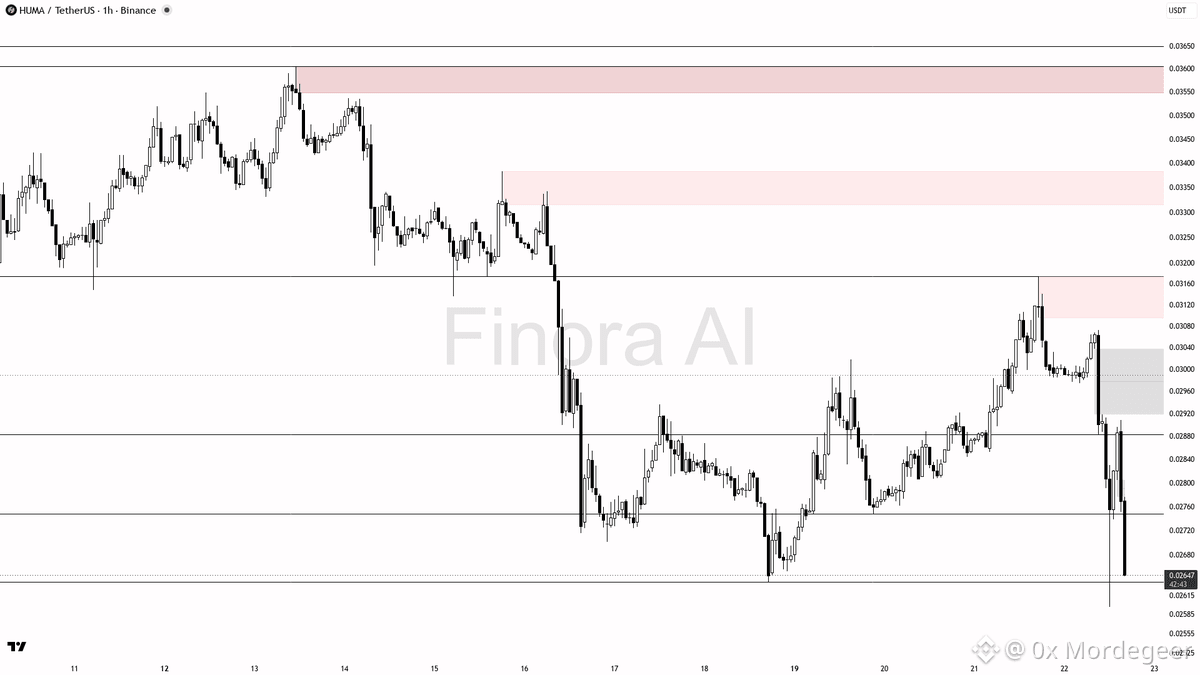
$HUMA is facing intense downward pressure following a sharp 4% drop on a 1.7x volume spike. With the broader daily structure and Bitcoin context aligned to the downside, the bias remains strictly bearish.
• Key Support / Demand: 0.02636, extending toward the 0.02472 target zone.
• Resistance / Supply Targets: 0.02748, 0.02770 zone, with major overhead resistance at 0.02872 and 0.03018.
• Trigger / Confirmation: Lower-timeframe rejection and failure to hold above the 0.02748, 0.02770 retest area.
• Risk / Invalidation: A daily close above 0.02872 threatens a squeeze, while a decisive break above 0.03072 completely invalidates the bearish setup.
• Market Execution: Monitor volume and order book depth carefully during retests to avoid chasing moves in high-volatility conditions.
Always practice strict risk management. DYOR — Educational setup, not financial advice.
#BinanceSquare #Crypto #HUMA #Trading
$BTC
3

·
--
$HUMA +5.16% | $ATOM +5.02% | $BEAMX +4.26%
#HUMA is trading at $0.0279, up +5.16% on $1.7 M volume. The PayFi network’s instant‑liquidity promise is gaining traction, though broader market risk remains.
#ATOM sits at $1.80, advancing +5.02% with $3.6 M changing hands. Cosmos’ expanding zone ecosystem appears to be rewarding investors as cross‑chain activity picks up.
#BEAMX moves to $0.00315400, climbing +4.26% on $1.2 M volume. Its modest rise suggests niche interest, but the price still hovers near support levels.
🔎 Keep an eye on whether the volume gaps between these gainers narrow, as that could hint at a shift in short‑term momentum.
#Write2Earn #Binance
17
Log in to explore more content
Join global crypto users on Binance Square
⚡️ Get latest and useful information about crypto.
💬 Trusted by the world’s largest crypto exchange.
👍 Discover real insights from verified creators.
Email / Phone number
Trending Topics
1
#BinancePick
2.8M views
148,548 Discussing
2
#EarningsSeason
5.1M views
25,382 Discussing
3
#AnthropicTTMRevenueGrewAbout1200%
5,706 views
180 Discussing
4
#AnthropicS1ExpectedToday
8,946 views
181 Discussing
5
#SouthKoreaReportedlyWeighsFourthCryptoTaxDelay
17,542 views
324 Discussing
6
#FranklinTempletonFilesForTwoDividendToBitcoinETFs
23,795 views
442 Discussing
7
#StrategyMSTRSurpassesNasdaqInMarketCap
18,804 views
327 Discussing
8
#CanadaProposesStablecoinRedemptionWithin3BusinessDays
850 views
32 Discussing
9
#ElectrumWalletBugLetRogueServersStealFunds
22,257 views
414 Discussing
10
#ArgentineCourtDismissesLIBRACaseAgainstMilei
33,882 views
508 Discussing