
#cryptomarketdump
cryptomarketdump
99,028 views
93 Discussing
Hot
Latest

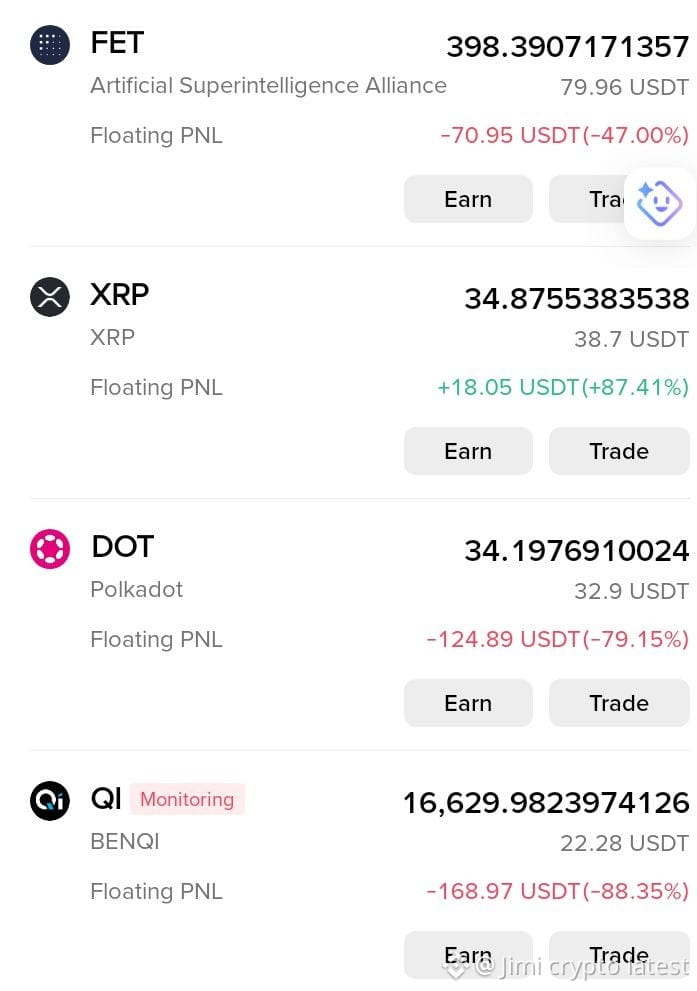

#BTC Update 📉
$BTC is pushing directly into the crucial $78,000–$79,000 rejection zone right now.
T#BTC Update 📉
$BTC is pushing directly into the crucial $78,000–$79,000 rejection zone right now.
This area has already shown strong selling pressure, and the market reaction here could decide the next major move.
If this resistance flips into support next week, many traders may assume continuation to the upside — but the bigger picture still looks dangerous. A massive downside move toward the $48,000 zone by June remains possible if momentum weakens and liquidity starts collapsing.
The market is moving aggressively, and volatility is increasing fast. Chasing pumps at resistance can become extremely risky in these conditions.
📌 Bookmark this chart.
📌 Manage risk carefully.
📌 Position accordingly.
#Bitcoin #Crypto #BTC #Trading #cryptomarketdump
#BTC Update 📉 $BTC is pushing directly into the crucial $78,000–$79,000 rejection zone right now. T
#BTC Update 📉
$BTC is pushing directly into the crucial $78,000–$79,000 rejection zone right now.
This area has already shown strong selling pressure, and the market reaction here could decide the next major move.
If this resistance flips into support next week, many traders may assume continuation to the upside — but the bigger picture still looks dangerous. A massive downside move toward the $48,000 zone by June remains possible if momentum weakens and liquidity starts collapsing.
The market is moving aggressively, and volatility is increasing fast. Chasing pumps at resistance can become extremely risky in these conditions.
📌 Bookmark this chart.
📌 Manage risk carefully.
📌 Position accordingly.
#Bitcoin #Crypto #BTC #Trading #cryptomarketdump
$BTC is pushing directly into the crucial $78,000–$79,000 rejection zone right now.
This area has already shown strong selling pressure, and the market reaction here could decide the next major move.
If this resistance flips into support next week, many traders may assume continuation to the upside — but the bigger picture still looks dangerous. A massive downside move toward the $48,000 zone by June remains possible if momentum weakens and liquidity starts collapsing.
The market is moving aggressively, and volatility is increasing fast. Chasing pumps at resistance can become extremely risky in these conditions.
📌 Bookmark this chart.
📌 Manage risk carefully.
📌 Position accordingly.
#Bitcoin #Crypto #BTC #Trading #cryptomarketdump

·
--
Article
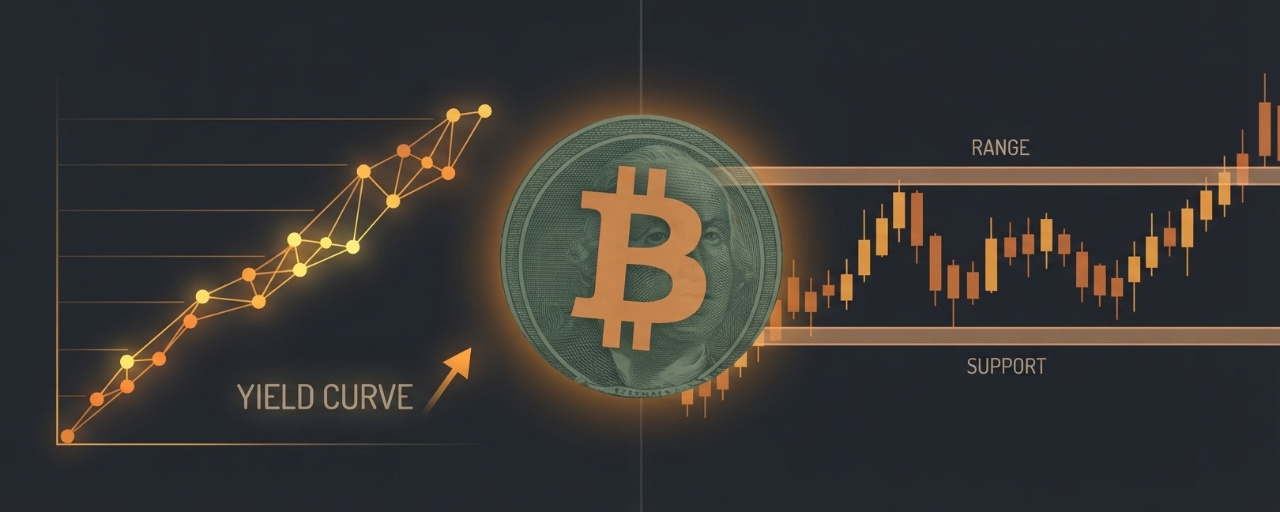
Bitcoin’s $74K Trap: ETF Outflows Meet a Hawkish FedBitcoin is pinned between two macro forces — a Fed that markets now expect to hike again, and spot ETF investors who have been pulling money out for four straight sessions. The result is a compressed $73K–$75.5K range that could break violently in either direction.
What is actually happening (reported facts)
BTC traded around $74,000 at the Wednesday Wall Street open, failing to follow US tech stocks higher even as CoreWeave jumped over 20% and Nvidia opened about 2.5% higher. The 10-year Treasury yield returned to 5% for the first time since 29 October, and the 30-year reached 5.378%, after US October CPI came in hotter than expected.
On-chain data added a bearish overlay: Bitcoin lost support around $75,700, the aggregate cost basis of short-term holders, and STH wallets sent over 47,000 BTC to exchanges at an unrealised loss on Tuesday — a potential precursor to panic selling.
ETF flows have not provided a buffer. US spot Bitcoin ETFs recorded a **$95 million net outflow** on 10 November, the fourth consecutive negative session, with BlackRock’s IBIT accounting for $78 million of that. Cumulative November outflows have reached roughly $1.6 billion, turning the year-to-date net flow negative.
Trader implications
The market is no longer trading purely on crypto-native narratives. BTC is caught in a rates-and-dollar regime: higher real yields raise the opportunity cost of holding a non-yielding asset, and a stronger dollar tightens global liquidity. The fact that BTC failed to rally alongside a 20%+ move in a major tech name is a relative-weakness signal that momentum traders should respect.
The 21-week SMA at $73,078** and the **50-week SMA at $75,492 define the current compression zone. A weekly close outside either boundary is likely to attract trend-following flow.
Key levels (sourced)
LevelSourceSignificance$73,07821-week SMARange floor / trend support$75,49250-week SMARange ceiling / trend resistance$75,700Short-term holder cost basisLost support; now resistance$74,000Spot referencePivot / fair-value zone
Bullish scenario (conditional)
A daily close back above $75,700** would reclaim the short-term holder cost basis and could trigger short covering toward the 50-week SMA at **$75,492. For that to become a trend reversal rather than a relief bounce, ETF flows would need to turn positive and the 10-year yield would need to stabilise below 5%. Neither is confirmed at the time of writing.
Bearish scenario (conditional)
A decisive break below $73,078** (21-week SMA) would invalidate the range and expose the next psychological zone near **$70,000. The bear case is reinforced if the 47,000 BTC that moved to exchanges at a loss converts into actual sell orders.
Risk-management reminder
Range-bound conditions can produce false breakouts. Position sizing should account for the possibility of a liquidity sweep above $75,500 or below $73,000 before the real direction emerges. Leverage in compressed ranges is especially dangerous because funding and liquidation clusters can amplify moves in both directions.
$BTC
{future}(BTCUSDT)
#BitcoinMaximalism #BTC、 #BinanceSquare #cryptomarketdump #Macro
Bitcoin’s $74K Trap: ETF Outflows Meet a Hawkish Fed
Bitcoin is pinned between two macro forces — a Fed that markets now expect to hike again, and spot ETF investors who have been pulling money out for four straight sessions. The result is a compressed $73K–$75.5K range that could break violently in either direction.
What is actually happening (reported facts)
BTC traded around $74,000 at the Wednesday Wall Street open, failing to follow US tech stocks higher even as CoreWeave jumped over 20% and Nvidia opened about 2.5% higher. The 10-year Treasury yield returned to 5% for the first time since 29 October, and the 30-year reached 5.378%, after US October CPI came in hotter than expected.
On-chain data added a bearish overlay: Bitcoin lost support around $75,700, the aggregate cost basis of short-term holders, and STH wallets sent over 47,000 BTC to exchanges at an unrealised loss on Tuesday — a potential precursor to panic selling.
ETF flows have not provided a buffer. US spot Bitcoin ETFs recorded a **$95 million net outflow** on 10 November, the fourth consecutive negative session, with BlackRock’s IBIT accounting for $78 million of that. Cumulative November outflows have reached roughly $1.6 billion, turning the year-to-date net flow negative.
Trader implications
The market is no longer trading purely on crypto-native narratives. BTC is caught in a rates-and-dollar regime: higher real yields raise the opportunity cost of holding a non-yielding asset, and a stronger dollar tightens global liquidity. The fact that BTC failed to rally alongside a 20%+ move in a major tech name is a relative-weakness signal that momentum traders should respect.
The 21-week SMA at $73,078** and the **50-week SMA at $75,492 define the current compression zone. A weekly close outside either boundary is likely to attract trend-following flow.
Key levels (sourced)
LevelSourceSignificance$73,07821-week SMARange floor / trend support$75,49250-week SMARange ceiling / trend resistance$75,700Short-term holder cost basisLost support; now resistance$74,000Spot referencePivot / fair-value zone
Bullish scenario (conditional)
A daily close back above $75,700** would reclaim the short-term holder cost basis and could trigger short covering toward the 50-week SMA at **$75,492. For that to become a trend reversal rather than a relief bounce, ETF flows would need to turn positive and the 10-year yield would need to stabilise below 5%. Neither is confirmed at the time of writing.
Bearish scenario (conditional)
A decisive break below $73,078** (21-week SMA) would invalidate the range and expose the next psychological zone near **$70,000. The bear case is reinforced if the 47,000 BTC that moved to exchanges at a loss converts into actual sell orders.
Risk-management reminder
Range-bound conditions can produce false breakouts. Position sizing should account for the possibility of a liquidity sweep above $75,500 or below $73,000 before the real direction emerges. Leverage in compressed ranges is especially dangerous because funding and liquidation clusters can amplify moves in both directions.
$BTC
#BitcoinMaximalism #BTC、 #BinanceSquare #cryptomarketdump #Macro
What is actually happening (reported facts)
BTC traded around $74,000 at the Wednesday Wall Street open, failing to follow US tech stocks higher even as CoreWeave jumped over 20% and Nvidia opened about 2.5% higher. The 10-year Treasury yield returned to 5% for the first time since 29 October, and the 30-year reached 5.378%, after US October CPI came in hotter than expected.
On-chain data added a bearish overlay: Bitcoin lost support around $75,700, the aggregate cost basis of short-term holders, and STH wallets sent over 47,000 BTC to exchanges at an unrealised loss on Tuesday — a potential precursor to panic selling.
ETF flows have not provided a buffer. US spot Bitcoin ETFs recorded a **$95 million net outflow** on 10 November, the fourth consecutive negative session, with BlackRock’s IBIT accounting for $78 million of that. Cumulative November outflows have reached roughly $1.6 billion, turning the year-to-date net flow negative.
Trader implications
The market is no longer trading purely on crypto-native narratives. BTC is caught in a rates-and-dollar regime: higher real yields raise the opportunity cost of holding a non-yielding asset, and a stronger dollar tightens global liquidity. The fact that BTC failed to rally alongside a 20%+ move in a major tech name is a relative-weakness signal that momentum traders should respect.
The 21-week SMA at $73,078** and the **50-week SMA at $75,492 define the current compression zone. A weekly close outside either boundary is likely to attract trend-following flow.
Key levels (sourced)
LevelSourceSignificance$73,07821-week SMARange floor / trend support$75,49250-week SMARange ceiling / trend resistance$75,700Short-term holder cost basisLost support; now resistance$74,000Spot referencePivot / fair-value zone
Bullish scenario (conditional)
A daily close back above $75,700** would reclaim the short-term holder cost basis and could trigger short covering toward the 50-week SMA at **$75,492. For that to become a trend reversal rather than a relief bounce, ETF flows would need to turn positive and the 10-year yield would need to stabilise below 5%. Neither is confirmed at the time of writing.
Bearish scenario (conditional)
A decisive break below $73,078** (21-week SMA) would invalidate the range and expose the next psychological zone near **$70,000. The bear case is reinforced if the 47,000 BTC that moved to exchanges at a loss converts into actual sell orders.
Risk-management reminder
Range-bound conditions can produce false breakouts. Position sizing should account for the possibility of a liquidity sweep above $75,500 or below $73,000 before the real direction emerges. Leverage in compressed ranges is especially dangerous because funding and liquidation clusters can amplify moves in both directions.
$BTC
#BitcoinMaximalism #BTC、 #BinanceSquare #cryptomarketdump #Macro
1
1

·
--
🔥 BTC Recovery Signals the Market Isn’t Done Yet🚀 The crypto market may dip, but strong coins always bounce back.
Today proved it again — while panic sellers were worried, smart traders stayed patient 😎
$BTC showed a quick recovery and the market is looking stable again, which means buyers are still active and confidence is returning 📈
Big moves often start after fear in the market…
The real question is: which coin will explode next? 👀🔥
#BTC #Bitcoin #Crypto #Binance #Trading #Bullish #Altcoins #cryptomarketdump
🔥 BTC Recovery Signals the Market Isn’t Done Yet
🚀 The crypto market may dip, but strong coins always bounce back.
Today proved it again — while panic sellers were worried, smart traders stayed patient 😎
$BTC showed a quick recovery and the market is looking stable again, which means buyers are still active and confidence is returning 📈
Big moves often start after fear in the market…
The real question is: which coin will explode next? 👀🔥
#BTC #Bitcoin #Crypto #Binance #Trading #Bullish #Altcoins #cryptomarketdump
Today proved it again — while panic sellers were worried, smart traders stayed patient 😎
$BTC showed a quick recovery and the market is looking stable again, which means buyers are still active and confidence is returning 📈
Big moves often start after fear in the market…
The real question is: which coin will explode next? 👀🔥
#BTC #Bitcoin #Crypto #Binance #Trading #Bullish #Altcoins #cryptomarketdump
13
13

·
--
LINA — Silent DeFi Player or Next Surprise?
While the market focuses on hype coins, some projects keep building in silence. LINA (Linear Finance) is one of them.
✅ DeFi-focused ecosystem
✅ Synthetic asset infrastructure
✅ Long-standing presence in crypto market
Smart money doesn’t chase hype — it looks for potential early. 👀
Will LINA wake up in the next bull move? 🚀
#LINA #LinearFinance #DeFi #Crypto #Altcoins
⚡ LINA is sleeping… but for how long?
Sometimes the biggest moves come from the most ignored coins.
Low noise ≠ low potential. 👀
#Crypto #LINA #BinanceSquare #AltcoinWatch
🚀 Hidden gem or forgotten project?
LINA still holds its place in DeFi narratives, waiting for its next momentum cycle.
The real question is — are you early or late? 🤔
#LINA #DeFi #cryptomarketdump
LINA — Silent DeFi Player or Next Surprise?
While the market focuses on hype coins, some projects keep building in silence. LINA (Linear Finance) is one of them.
✅ DeFi-focused ecosystem
✅ Synthetic asset infrastructure
✅ Long-standing presence in crypto market
Smart money doesn’t chase hype — it looks for potential early. 👀
Will LINA wake up in the next bull move? 🚀
#LINA #LinearFinance #DeFi #Crypto #Altcoins
⚡ LINA is sleeping… but for how long?
Sometimes the biggest moves come from the most ignored coins.
Low noise ≠ low potential. 👀
#Crypto #LINA #BinanceSquare #AltcoinWatch
🚀 Hidden gem or forgotten project?
LINA still holds its place in DeFi narratives, waiting for its next momentum cycle.
The real question is — are you early or late? 🤔
#LINA #DeFi #cryptomarketdump
While the market focuses on hype coins, some projects keep building in silence. LINA (Linear Finance) is one of them.
✅ DeFi-focused ecosystem
✅ Synthetic asset infrastructure
✅ Long-standing presence in crypto market
Smart money doesn’t chase hype — it looks for potential early. 👀
Will LINA wake up in the next bull move? 🚀
#LINA #LinearFinance #DeFi #Crypto #Altcoins
⚡ LINA is sleeping… but for how long?
Sometimes the biggest moves come from the most ignored coins.
Low noise ≠ low potential. 👀
#Crypto #LINA #BinanceSquare #AltcoinWatch
🚀 Hidden gem or forgotten project?
LINA still holds its place in DeFi narratives, waiting for its next momentum cycle.
The real question is — are you early or late? 🤔
#LINA #DeFi #cryptomarketdump

1
1

·
--
🔥 MEME COIN ROTATION? PAY ATTENTION.
Today’s crypto market is showing broad positive momentum, with multiple altcoins posting strong moves.
When money starts rotating into higher-risk assets, meme coins often become part of the conversation.
👀 Names on the radar:
$DOGE
$PEPE
$SHIB
$BONK
$FLOKI
But don't confuse attention with confirmation.
A real setup needs:
📊 Volume
📈 Price structure
🔥 Sustained interest
#cryptomarketdump #Memecoins🤑🤑
🔥 MEME COIN ROTATION? PAY ATTENTION.
Today’s crypto market is showing broad positive momentum, with multiple altcoins posting strong moves.
When money starts rotating into higher-risk assets, meme coins often become part of the conversation.
👀 Names on the radar:
$DOGE
$PEPE
$SHIB
$BONK
$FLOKI
But don't confuse attention with confirmation.
A real setup needs:
📊 Volume
📈 Price structure
🔥 Sustained interest
#cryptomarketdump #Memecoins🤑🤑
Today’s crypto market is showing broad positive momentum, with multiple altcoins posting strong moves.
When money starts rotating into higher-risk assets, meme coins often become part of the conversation.
👀 Names on the radar:
$DOGE
$PEPE
$SHIB
$BONK
$FLOKI
But don't confuse attention with confirmation.
A real setup needs:
📊 Volume
📈 Price structure
🔥 Sustained interest
#cryptomarketdump #Memecoins🤑🤑

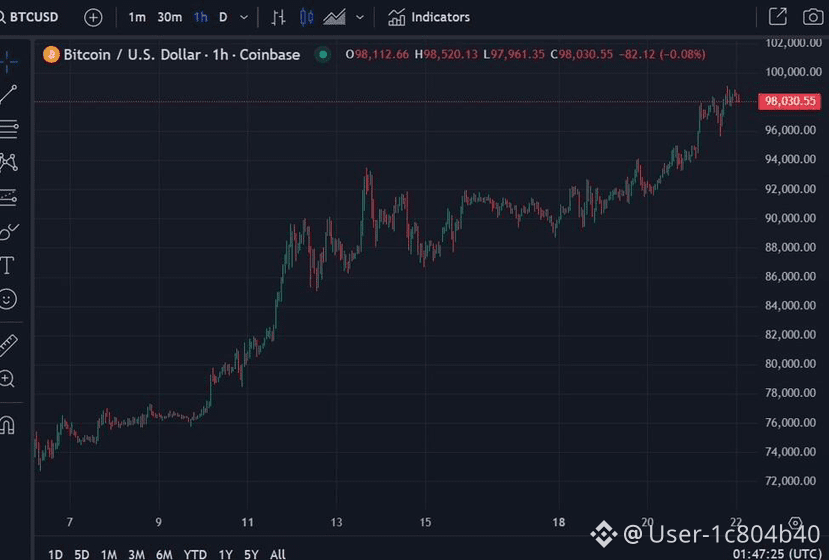
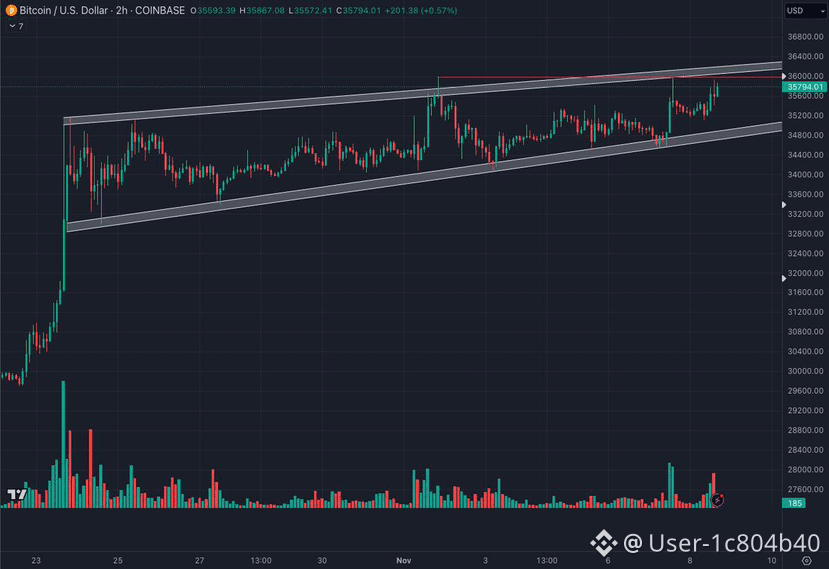
$BTI.US #cryptomarketdump #BitcoinSpotETFs$2.39BWeeklyNetInflow is trading around the $83K–$84K zone after facing resistance near $85K. Current market analysis highlights $83K–$83.3K as an important support area, while $85K remains a key resistance level.
📌 Support: ~$83K
📌 Resistance: ~$85K
👀 Watch the breakout and volume.
#Bitcoin #BTC #Crypto #BitcoinNews #BitgetCEOConfirms$388MStolenInHack #BTCFallsBelow$83000 #BitcoinSpotETFs$2.39BWeeklyNetInflow
$BTI.US #cryptomarketdump #BitcoinSpotETFs$2.39BWeeklyNetInflow is trading around the $83K–$84K zone after facing resistance near $85K. Current market analysis highlights $83K–$83.3K as an important support area, while $85K remains a key resistance level.
📌 Support: ~$83K
📌 Resistance: ~$85K
👀 Watch the breakout and volume.
#Bitcoin #BTC #Crypto #BitcoinNews #BitgetCEOConfirms$388MStolenInHack #BTCFallsBelow$83000 #BitcoinSpotETFs$2.39BWeeklyNetInflow
📌 Support: ~$83K
📌 Resistance: ~$85K
👀 Watch the breakout and volume.
#Bitcoin #BTC #Crypto #BitcoinNews #BitgetCEOConfirms$388MStolenInHack #BTCFallsBelow$83000 #BitcoinSpotETFs$2.39BWeeklyNetInflow




Article
Top Gainers Surge – Altcoins Steal the SpotlightThe crypto market witnessed strong momentum in several altcoins on May 1, 2026, with the Top Gainers list showing impressive double and even triple-digit gains in the last 24 hours.
Leading the pack was MEGA, which exploded with a massive +185.26% gain, followed by QI at +28.75%, ORCA at +22.93%, PENDLE at +19.57%, and ALLO at +14.63%.
This broad-based rally in mid and low-cap altcoins suggests fresh capital rotation and renewed speculative interest in the sector. While large-cap coins like Bitcoin and Ethereum remain relatively stable, many smaller tokens are delivering significant short-term returns.
Key Highlights
MEGA dominated the list with an extraordinary 185% surgeMultiple tokens posted gains between 10% to 29%Increased trading activity indicates growing trader participation in altcoin narratives
Hwever, such sharp gains in low and mid-cap tokens often come with high volatility and risk of quick corrections. Traders are advised to exercise caution and focus on proper risk management rather than chasing momentum blindly.
Note: This is not financial advice.
#TopGainers #Altcoins #cryptomarketdump #May2026
Top Gainers Surge – Altcoins Steal the Spotlight
The crypto market witnessed strong momentum in several altcoins on May 1, 2026, with the Top Gainers list showing impressive double and even triple-digit gains in the last 24 hours.
Leading the pack was MEGA, which exploded with a massive +185.26% gain, followed by QI at +28.75%, ORCA at +22.93%, PENDLE at +19.57%, and ALLO at +14.63%.
This broad-based rally in mid and low-cap altcoins suggests fresh capital rotation and renewed speculative interest in the sector. While large-cap coins like Bitcoin and Ethereum remain relatively stable, many smaller tokens are delivering significant short-term returns.
Key Highlights
MEGA dominated the list with an extraordinary 185% surgeMultiple tokens posted gains between 10% to 29%Increased trading activity indicates growing trader participation in altcoin narratives
Hwever, such sharp gains in low and mid-cap tokens often come with high volatility and risk of quick corrections. Traders are advised to exercise caution and focus on proper risk management rather than chasing momentum blindly.
Note: This is not financial advice.
#TopGainers #Altcoins #cryptomarketdump #May2026
Leading the pack was MEGA, which exploded with a massive +185.26% gain, followed by QI at +28.75%, ORCA at +22.93%, PENDLE at +19.57%, and ALLO at +14.63%.
This broad-based rally in mid and low-cap altcoins suggests fresh capital rotation and renewed speculative interest in the sector. While large-cap coins like Bitcoin and Ethereum remain relatively stable, many smaller tokens are delivering significant short-term returns.
Key Highlights
MEGA dominated the list with an extraordinary 185% surgeMultiple tokens posted gains between 10% to 29%Increased trading activity indicates growing trader participation in altcoin narratives
Hwever, such sharp gains in low and mid-cap tokens often come with high volatility and risk of quick corrections. Traders are advised to exercise caution and focus on proper risk management rather than chasing momentum blindly.
Note: This is not financial advice.
#TopGainers #Altcoins #cryptomarketdump #May2026


$XRP Price Update: What’s Fueling the Momentum?
XRP has been gaining traction in the crypto space, with its price showing steady growth. As a leading cryptocurrency designed for fast and low-cost cross-border transactions, @xrpl continues to serve as a bridge currency for financial institutions. Its partnership with global banks and financial institutions gives it a unique position in the market.
With a solid market cap and increasing trading volume, XRP remains a strong contender in the crypto world, especially as demand for blockchain-powered payment solutions rises. Investors are watching closely, anticipating future growth fueled by Ripple’s ongoing developments and regulatory progress.
For More Information Visit – cryptodisplay.io
#XRP #Ripple #cryptomarketdump #Blockchain #CrossBorderPayments
$XRP Price Update: What’s Fueling the Momentum?
XRP has been gaining traction in the crypto space, with its price showing steady growth. As a leading cryptocurrency designed for fast and low-cost cross-border transactions, @Ripple continues to serve as a bridge currency for financial institutions. Its partnership with global banks and financial institutions gives it a unique position in the market.
With a solid market cap and increasing trading volume, XRP remains a strong contender in the crypto world, especially as demand for blockchain-powered payment solutions rises. Investors are watching closely, anticipating future growth fueled by Ripple’s ongoing developments and regulatory progress.
For More Information Visit – cryptodisplay.io
#XRP #Ripple #cryptomarketdump #Blockchain #CrossBorderPayments
XRP has been gaining traction in the crypto space, with its price showing steady growth. As a leading cryptocurrency designed for fast and low-cost cross-border transactions, @Ripple continues to serve as a bridge currency for financial institutions. Its partnership with global banks and financial institutions gives it a unique position in the market.
With a solid market cap and increasing trading volume, XRP remains a strong contender in the crypto world, especially as demand for blockchain-powered payment solutions rises. Investors are watching closely, anticipating future growth fueled by Ripple’s ongoing developments and regulatory progress.
For More Information Visit – cryptodisplay.io
#XRP #Ripple #cryptomarketdump #Blockchain #CrossBorderPayments

2
1
2
2
Log in to explore more content
Join global crypto users on Binance Square
⚡️ Get latest and useful information about crypto.
💬 Trusted by the world’s largest crypto exchange.
👍 Discover real insights from verified creators.
Email / Phone number
Trending Topics
1
#HuangRisksOusterOverReportedAffairWithSubordinate
60,361 views
842 Discussing
2
#AnthropicRejectsIPODelayValuationinQuestion
517,975 views
4,234 Discussing
3
#CoreWeaveJumps10%On168%RevenueGrowth
91,174 views
1,080 Discussing
4
#ZcashFallsBelow$1000ForFirstTimeSinceSeptember
49,430 views
216 Discussing
5
#MSCIRemovalMayCurbStrategy’sBitcoinBuying
11,419 views
194 Discussing
6
#HKSFCSaysTokenizationMovingToCommercialUse
592 views
22 Discussing
7
#CanNvidiaEarningsEaseMarketConcerns?
199,907 views
1,984 Discussing
8
#SouthKoreaToLetExchangesSuspendWithdrawalsOnSuspectedHacks
203 views
12 Discussing
9
#PythAddsNYSERealTimeDataToMarketplace
5,343 views
133 Discussing
10
#SolanaCompanyReports$3.4MQ3Revenue
1,465 views
30 Discussing