
#ziliqa
ziliqa
40,987 views
69 Discussing
Hot
Latest

·
--
Bullish
ZIL/USDT: Is This the Ultimate Dip Buy or a Falling Knife? 📉🔥
If you are looking at the ZIL/USDT chart right now, you can see a massive bloodbath. Zilliqa is trading at 0.000920, down -9.80% over the last 24 hours. Looking at the broader timeframe, the numbers look even more dramatic: -45.40% in 7 days, -60.62% in 30 days, and over -86.12% down on the 1-year chart.
For aggressive crypto traders, a chart like this triggers one major question: Is this the absolute bottom and the best time to load your bags, or a trap?
Let’s break down the technical perspective based on the current setup.
📊 Current Market Snapshot
Pair: ZIL/USDT (Binance)
Current Price: 0.000920
24h Range: 0.000910 (Low) – 0.001058 (High)
24h Volume: 4.02B ZIL / 3.96M USDT
Bollinger Bands (BOLL): The price is hugging the lower band (0.000915), showing heavy oversold conditions.
Immediate Support: $0.000910 (24h Low)
#Ziliqa
{future}(ZILUSDT)
🔴 The Risks: Why You Should Be Careful
1. The "Falling Knife" Phenomenon: Buying a coin that is bleeding heavily across all timeframes (7D, 30D, 1Y) is risky. Momentum is currently favoring the sellers.
2. Trend Confirmation Missing: Moving averages (MA5, MA10) and Bollinger Bands are still angled downward. Until we see a clear higher-low structure or a break above resistance, catching falling knives can lead to immediate losses.
💡 Strategy / Verdict: How to Play It
For DCA (Dollar-Cost Averaging) Investors: If you believe in the long-term project value, buying tiny fractions at these historic lows rather than going all-in at once minimizes your risk if it drops further.
For Day Traders: Watch the 0.000910 support level closely. If it holds and forms a green reversal candle on the 15m/1h charts, a quick scalping bounce toward the middle Bollinger band ($0.000928 - 0.000940) could be on the table. Always use a tight stop-loss below the support!
Disclaimer: This article is for informational and educational purposes only and does not constitute financial advice. Crypto markets are extremely volatile always do your own research
ZIL/USDT: Is This the Ultimate Dip Buy or a Falling Knife? 📉🔥
If you are looking at the ZIL/USDT chart right now, you can see a massive bloodbath. Zilliqa is trading at 0.000920, down -9.80% over the last 24 hours. Looking at the broader timeframe, the numbers look even more dramatic: -45.40% in 7 days, -60.62% in 30 days, and over -86.12% down on the 1-year chart.
For aggressive crypto traders, a chart like this triggers one major question: Is this the absolute bottom and the best time to load your bags, or a trap?
Let’s break down the technical perspective based on the current setup.
📊 Current Market Snapshot
Pair: ZIL/USDT (Binance)
Current Price: 0.000920
24h Range: 0.000910 (Low) – 0.001058 (High)
24h Volume: 4.02B ZIL / 3.96M USDT
Bollinger Bands (BOLL): The price is hugging the lower band (0.000915), showing heavy oversold conditions.
Immediate Support: $0.000910 (24h Low)
#Ziliqa
🔴 The Risks: Why You Should Be Careful
1. The "Falling Knife" Phenomenon: Buying a coin that is bleeding heavily across all timeframes (7D, 30D, 1Y) is risky. Momentum is currently favoring the sellers.
2. Trend Confirmation Missing: Moving averages (MA5, MA10) and Bollinger Bands are still angled downward. Until we see a clear higher-low structure or a break above resistance, catching falling knives can lead to immediate losses.
💡 Strategy / Verdict: How to Play It
For DCA (Dollar-Cost Averaging) Investors: If you believe in the long-term project value, buying tiny fractions at these historic lows rather than going all-in at once minimizes your risk if it drops further.
For Day Traders: Watch the 0.000910 support level closely. If it holds and forms a green reversal candle on the 15m/1h charts, a quick scalping bounce toward the middle Bollinger band ($0.000928 - 0.000940) could be on the table. Always use a tight stop-loss below the support!
Disclaimer: This article is for informational and educational purposes only and does not constitute financial advice. Crypto markets are extremely volatile always do your own research
If you are looking at the ZIL/USDT chart right now, you can see a massive bloodbath. Zilliqa is trading at 0.000920, down -9.80% over the last 24 hours. Looking at the broader timeframe, the numbers look even more dramatic: -45.40% in 7 days, -60.62% in 30 days, and over -86.12% down on the 1-year chart.
For aggressive crypto traders, a chart like this triggers one major question: Is this the absolute bottom and the best time to load your bags, or a trap?
Let’s break down the technical perspective based on the current setup.
📊 Current Market Snapshot
Pair: ZIL/USDT (Binance)
Current Price: 0.000920
24h Range: 0.000910 (Low) – 0.001058 (High)
24h Volume: 4.02B ZIL / 3.96M USDT
Bollinger Bands (BOLL): The price is hugging the lower band (0.000915), showing heavy oversold conditions.
Immediate Support: $0.000910 (24h Low)
#Ziliqa
🔴 The Risks: Why You Should Be Careful
1. The "Falling Knife" Phenomenon: Buying a coin that is bleeding heavily across all timeframes (7D, 30D, 1Y) is risky. Momentum is currently favoring the sellers.
2. Trend Confirmation Missing: Moving averages (MA5, MA10) and Bollinger Bands are still angled downward. Until we see a clear higher-low structure or a break above resistance, catching falling knives can lead to immediate losses.
💡 Strategy / Verdict: How to Play It
For DCA (Dollar-Cost Averaging) Investors: If you believe in the long-term project value, buying tiny fractions at these historic lows rather than going all-in at once minimizes your risk if it drops further.
For Day Traders: Watch the 0.000910 support level closely. If it holds and forms a green reversal candle on the 15m/1h charts, a quick scalping bounce toward the middle Bollinger band ($0.000928 - 0.000940) could be on the table. Always use a tight stop-loss below the support!
Disclaimer: This article is for informational and educational purposes only and does not constitute financial advice. Crypto markets are extremely volatile always do your own research
398

·
--
Bullish
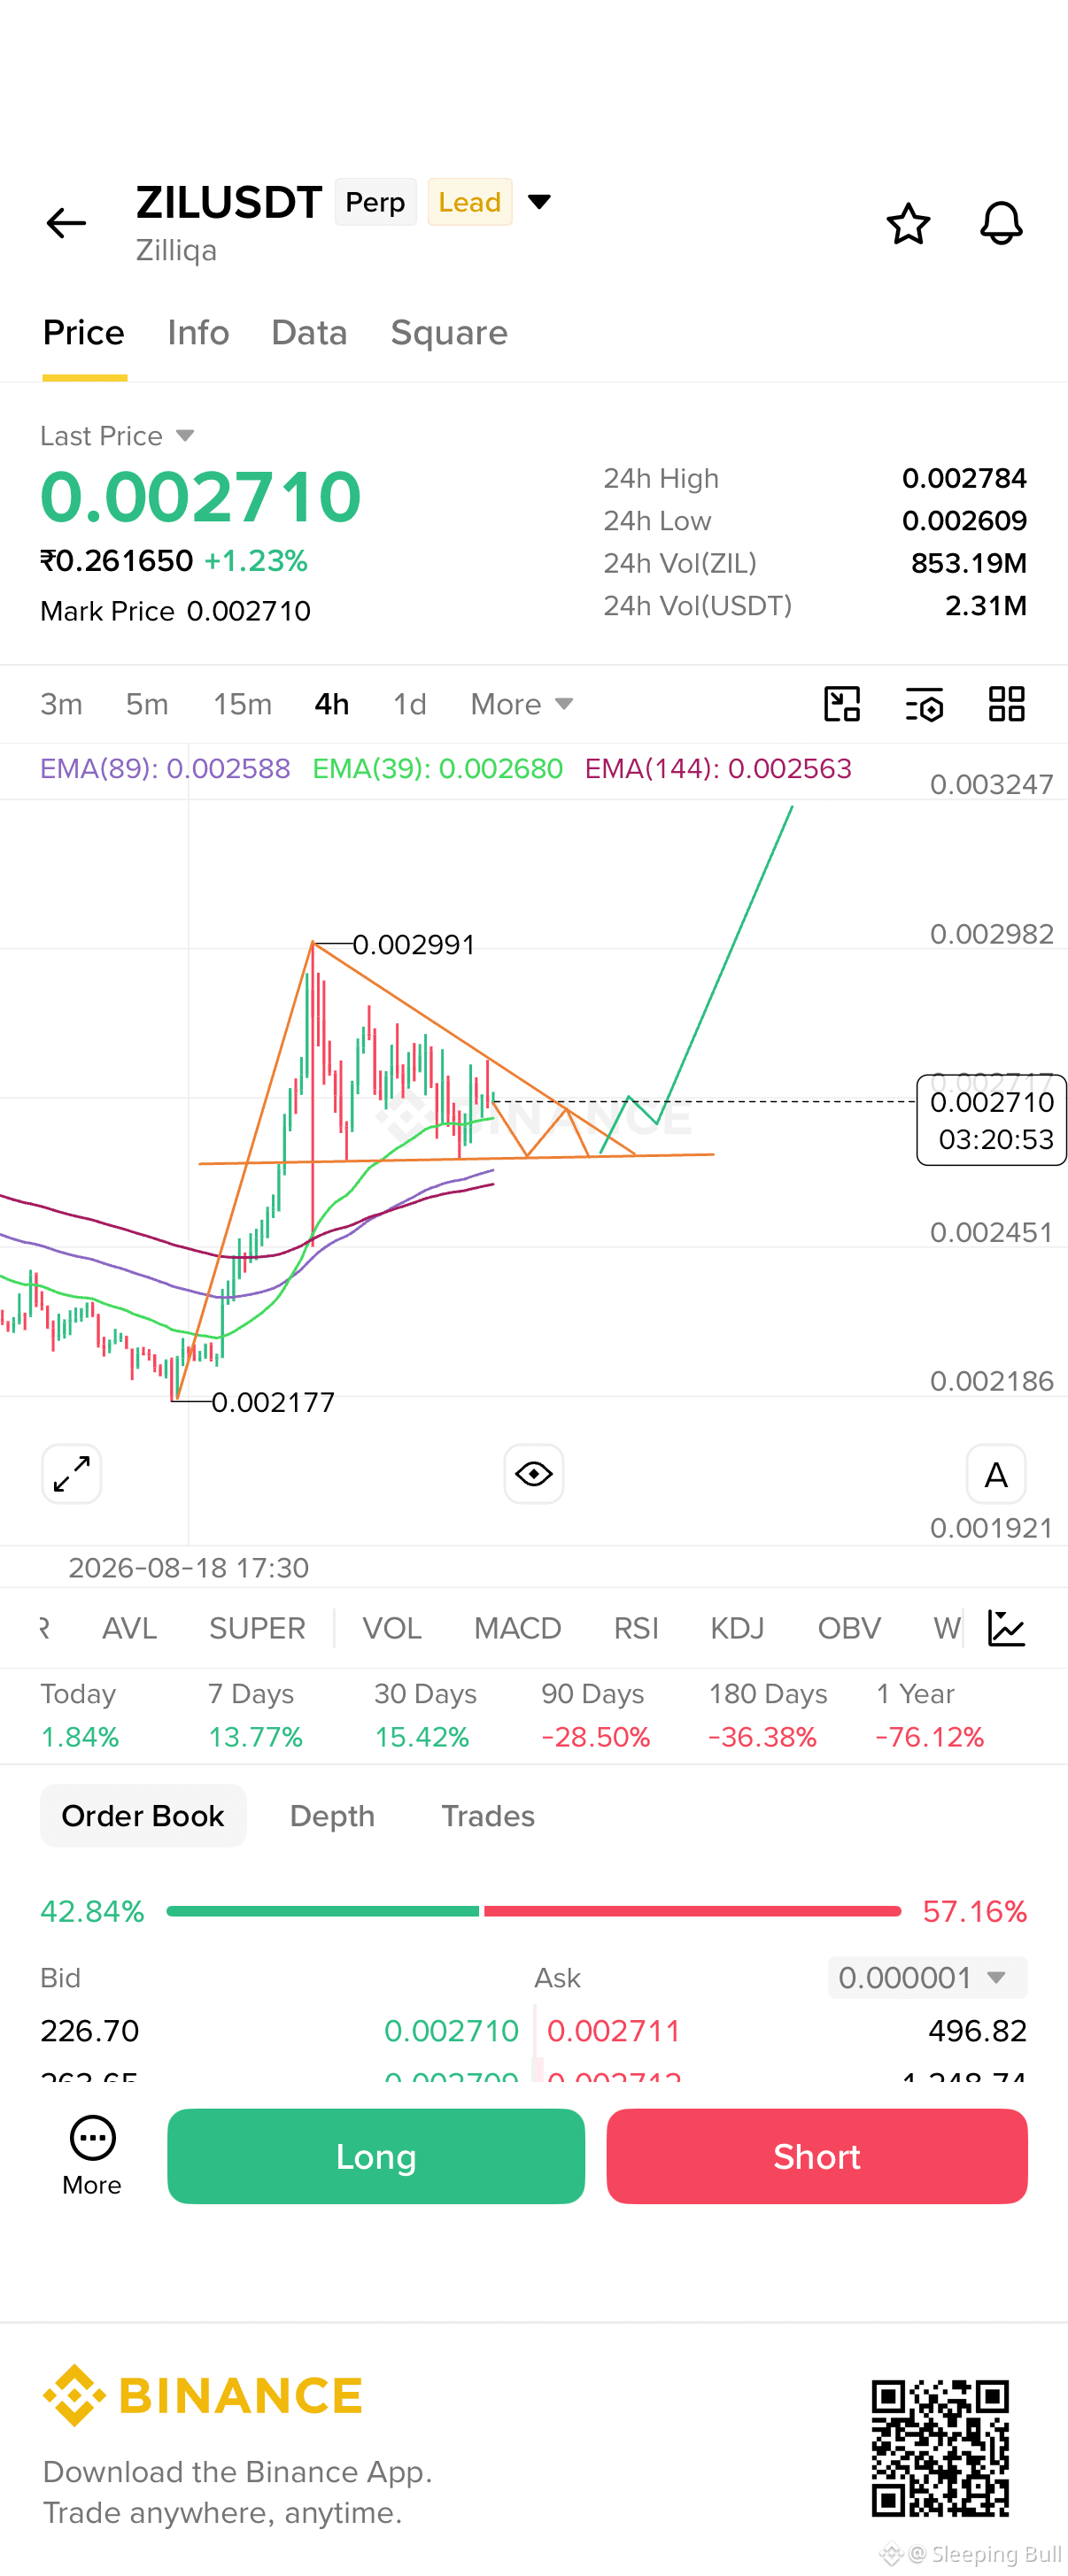
$ZIL Bullish Flag setup on 4h timeframe
You can enter now or wait for breakout and retest.
Stop loss just below the baseline.
Risk/Reward ratio- 1:4
#tradeplan #Ziliqa #Copytrading
$ZIL Bullish Flag setup on 4h timeframe
You can enter now or wait for breakout and retest.
Stop loss just below the baseline.
Risk/Reward ratio- 1:4
#tradeplan #Ziliqa #Copytrading
You can enter now or wait for breakout and retest.
Stop loss just below the baseline.
Risk/Reward ratio- 1:4
#tradeplan #Ziliqa #Copytrading
Sourced by user sharing on Binance
My Futures Portfolio
0 / 200
Minimum 10USDT
Public
7D PNL
(USDT)
0.00
7D ROI
0.00%
AUM
$0.00
Win Rate
23.07%
1
149

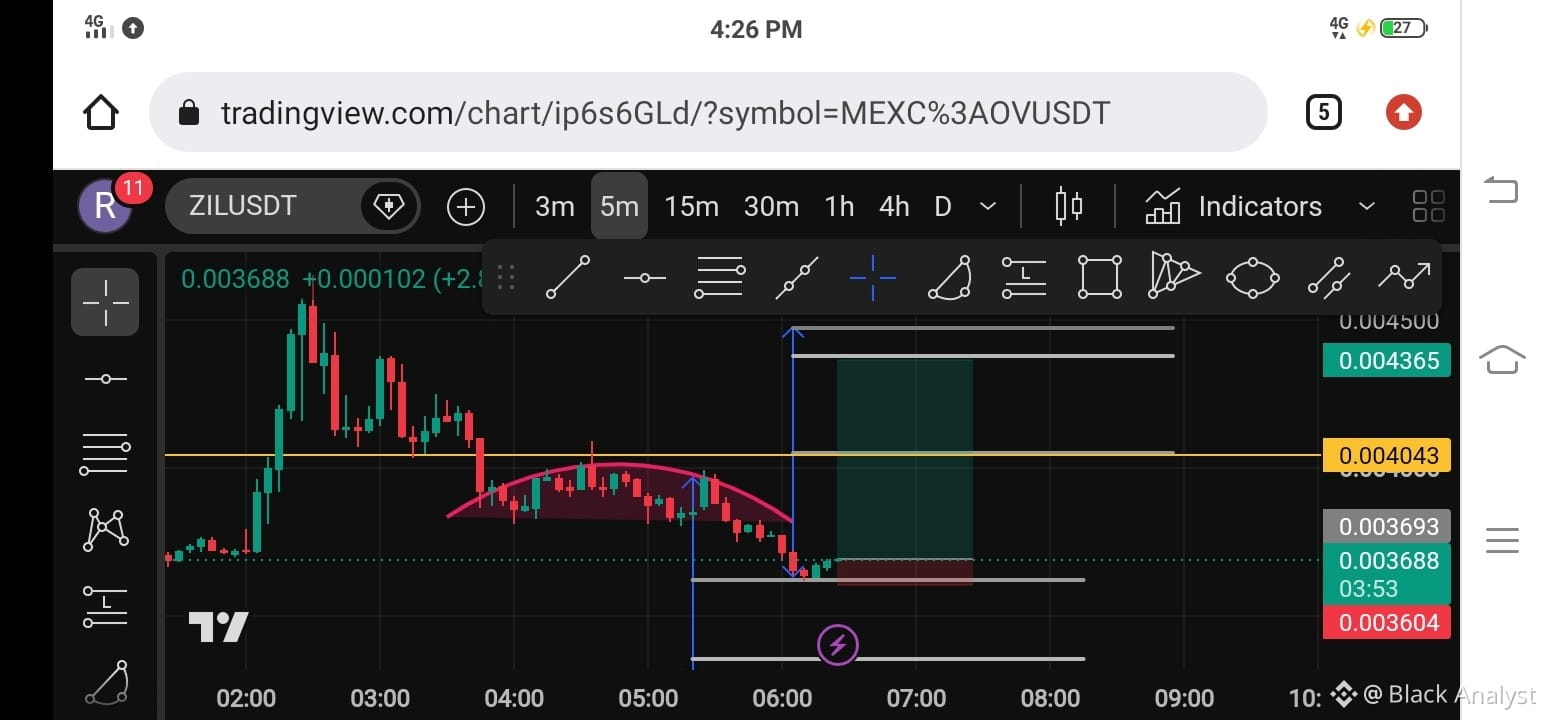
$ZIL upside move alert🚀
Book 50% of the profit at yellow line and hold remaining to target 🎯 and move SL to breakeven ....
dyor..nfa...spot view only ...
$ZIL
{spot}(ZILUSDT)
#ZIL/USDT #Ziliqa
$ZIL upside move alert🚀
Book 50% of the profit at yellow line and hold remaining to target 🎯 and move SL to breakeven ....
dyor..nfa...spot view only ...
$ZIL
#ZIL/USDT #Ziliqa
Book 50% of the profit at yellow line and hold remaining to target 🎯 and move SL to breakeven ....
dyor..nfa...spot view only ...
$ZIL
#ZIL/USDT #Ziliqa
1
1
139

·
--
📉
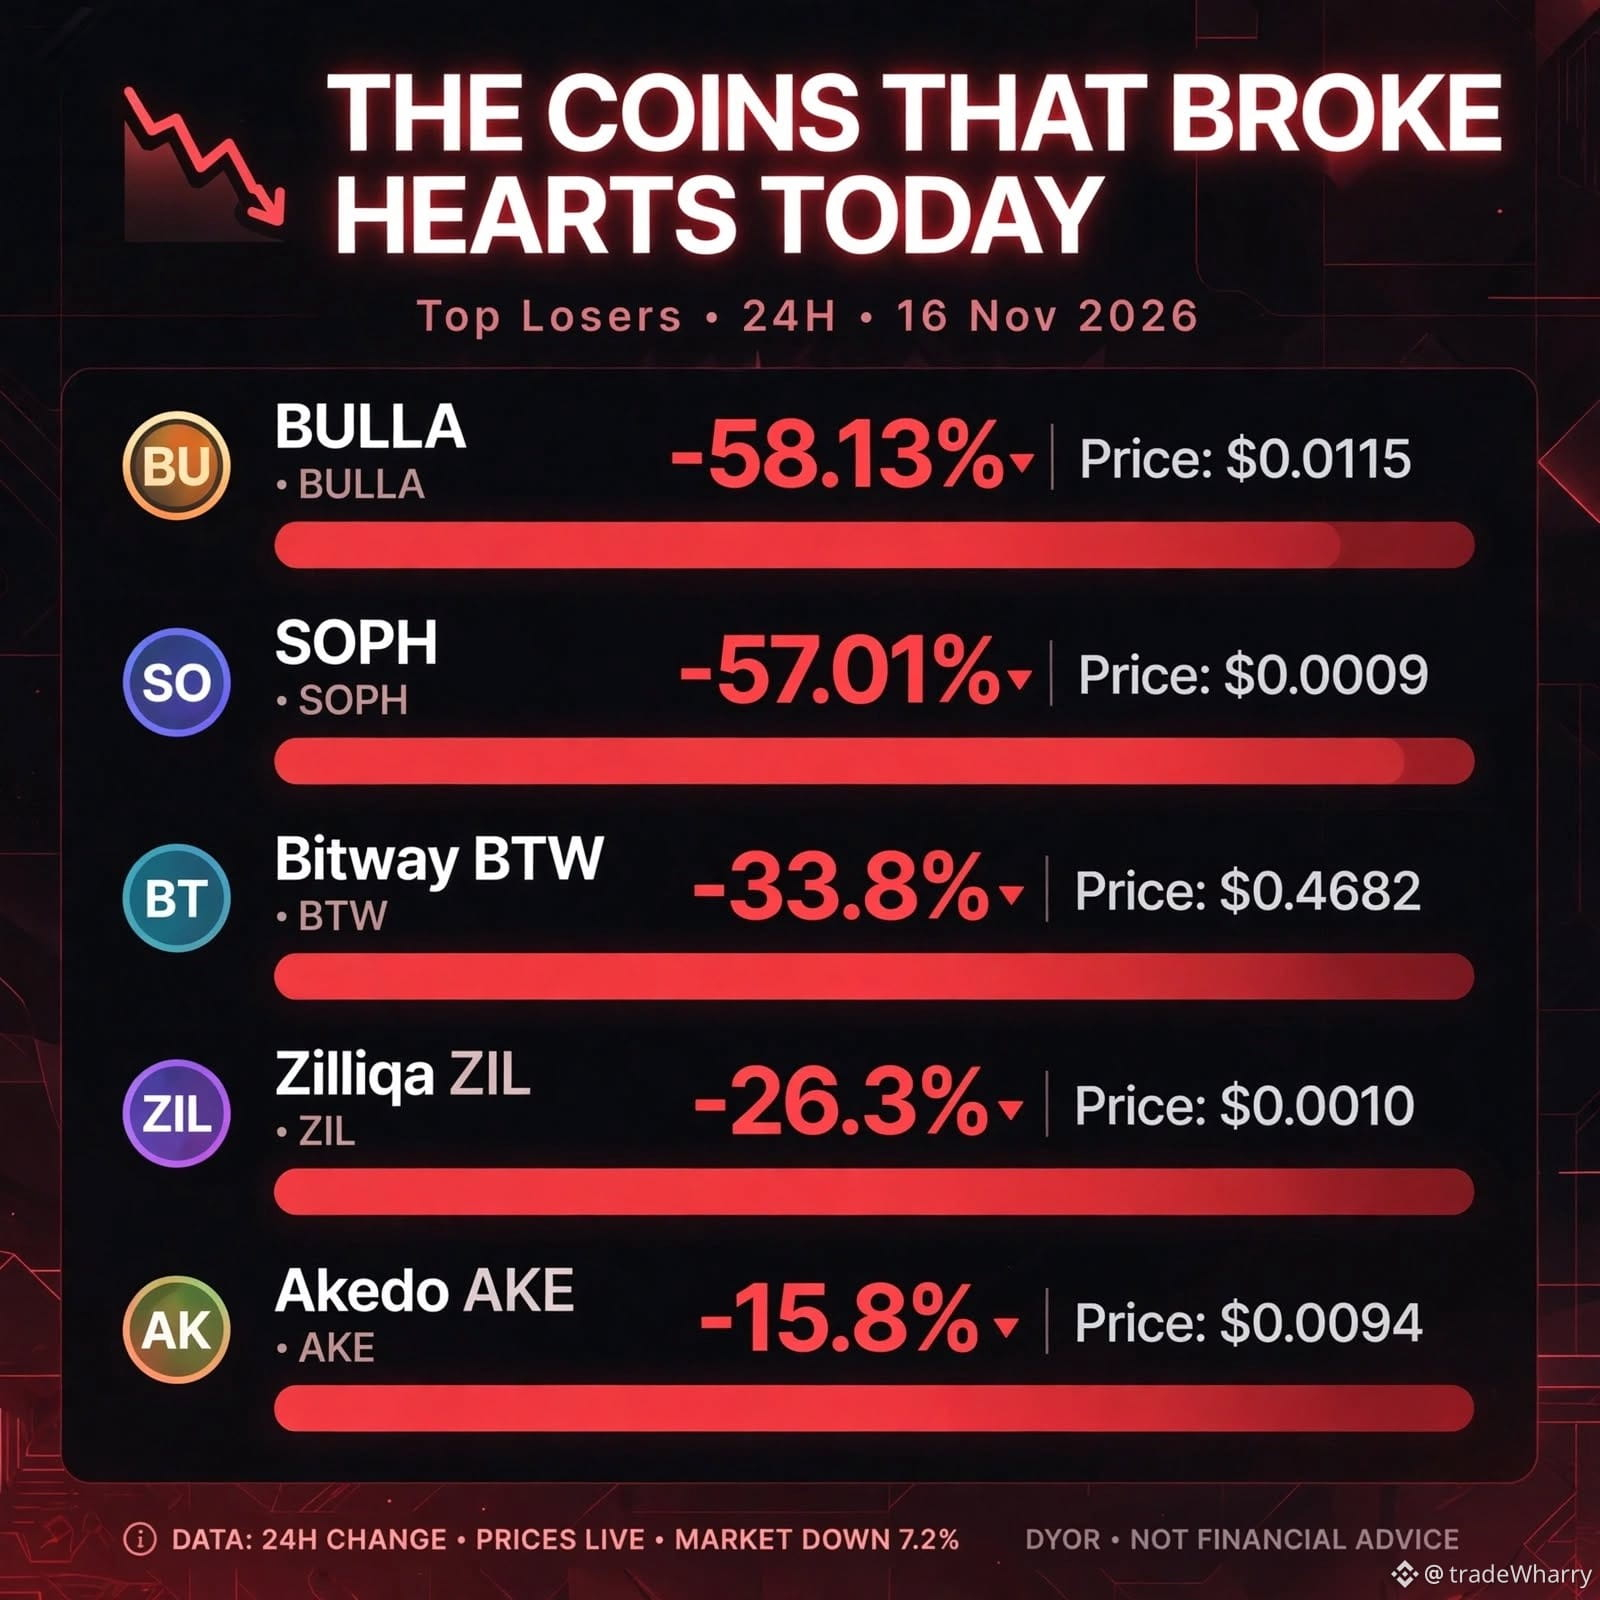
💔 THE COINS THAT BROKE HEARTS TODAY
- BULLA -58.13% | Price: $0.0115
- SOPH -57.01% | Price: $0.0009
- Bitway BTW -33.8% | Price: $0.4682
- Zilliqa ZIL -26.3% | Price: $0.0010
- Akedo AKE -15.8% | Price: $0.0094
$BULLA $SOPH $BTW #Ziliqa #AKE
#BitcoinDunyamiz #cryptouniverseofficial #USDT
📉
💔 THE COINS THAT BROKE HEARTS TODAY
- BULLA -58.13% | Price: $0.0115
- SOPH -57.01% | Price: $0.0009
- Bitway BTW -33.8% | Price: $0.4682
- Zilliqa ZIL -26.3% | Price: $0.0010
- Akedo AKE -15.8% | Price: $0.0094
$BULLA $SOPH $BTW #Ziliqa #AKE
#BitcoinDunyamiz #cryptouniverseofficial #USDT
💔 THE COINS THAT BROKE HEARTS TODAY
- BULLA -58.13% | Price: $0.0115
- SOPH -57.01% | Price: $0.0009
- Bitway BTW -33.8% | Price: $0.4682
- Zilliqa ZIL -26.3% | Price: $0.0010
- Akedo AKE -15.8% | Price: $0.0094
$BULLA $SOPH $BTW #Ziliqa #AKE
#BitcoinDunyamiz #cryptouniverseofficial #USDT
1
879

·
--
Bullish
$ZIL #Ziliqa good to buy now
why ?
last bottom here ,
buy preasure is coming
zilliqa good foundation , ultility & tech
$ZIL #Ziliqa good to buy now
why ?
last bottom here ,
buy preasure is coming
zilliqa good foundation , ultility & tech
why ?
last bottom here ,
buy preasure is coming
zilliqa good foundation , ultility & tech
3
2
328
·
--
Bullish
If you missed the previous pump then this is the right time to make positions.
Every coin is now in consolidation phase and building momentum once its break we will definitely see another move.
So what are you waiting for lets trade together and make some 💸🤑📈
Keep an eye on these coins $ZIL $CELR $MIRA
#BullRunAhead #Ziliqa #mira
{future}(ZILUSDT)
If you missed the previous pump then this is the right time to make positions.
Every coin is now in consolidation phase and building momentum once its break we will definitely see another move.
So what are you waiting for lets trade together and make some 💸🤑📈
Keep an eye on these coins $ZIL $CELR $MIRA
#BullRunAhead #Ziliqa #mira
Every coin is now in consolidation phase and building momentum once its break we will definitely see another move.
So what are you waiting for lets trade together and make some 💸🤑📈
Keep an eye on these coins $ZIL $CELR $MIRA
#BullRunAhead #Ziliqa #mira

My Futures Portfolio
0 / 200
Minimum 10USDT
Public
7D PNL
(USDT)
0.00
7D ROI
0.00%
AUM
$0.00
Win Rate
23.07%
1
431



·
--
Bullish
@Zilliqa is slowly but surely making its presence known, now at number 182 with a market cap of just over $207 million. Having almost 20 billion tokens released out of a total of 21 billion, it's well-set up for long-term growth.
Its fully diluted market cap is at approximately $220 million, representing the value of the token when more supply is released. Standout is the high trading volume of $12 million, indicating healthy trade and good liquidity on the exchange.
Since it was introduced in early 2018, ZIL has experienced significant milestones, such as its all-time high of $0.256 earlier in 2021. The path of the token indicates resilience and potential for future prospects.
At Binance, investors can trade with $ZIL securely, supported by an exchange optimized for high-speed and secure cryptocurrency trading.#Ziliqa
@Zilliqa is slowly but surely making its presence known, now at number 182 with a market cap of just over $207 million. Having almost 20 billion tokens released out of a total of 21 billion, it's well-set up for long-term growth.
Its fully diluted market cap is at approximately $220 million, representing the value of the token when more supply is released. Standout is the high trading volume of $12 million, indicating healthy trade and good liquidity on the exchange.
Since it was introduced in early 2018, ZIL has experienced significant milestones, such as its all-time high of $0.256 earlier in 2021. The path of the token indicates resilience and potential for future prospects.
At Binance, investors can trade with $ZIL securely, supported by an exchange optimized for high-speed and secure cryptocurrency trading.#Ziliqa
Its fully diluted market cap is at approximately $220 million, representing the value of the token when more supply is released. Standout is the high trading volume of $12 million, indicating healthy trade and good liquidity on the exchange.
Since it was introduced in early 2018, ZIL has experienced significant milestones, such as its all-time high of $0.256 earlier in 2021. The path of the token indicates resilience and potential for future prospects.
At Binance, investors can trade with $ZIL securely, supported by an exchange optimized for high-speed and secure cryptocurrency trading.#Ziliqa
2
317

·
--
Bullish
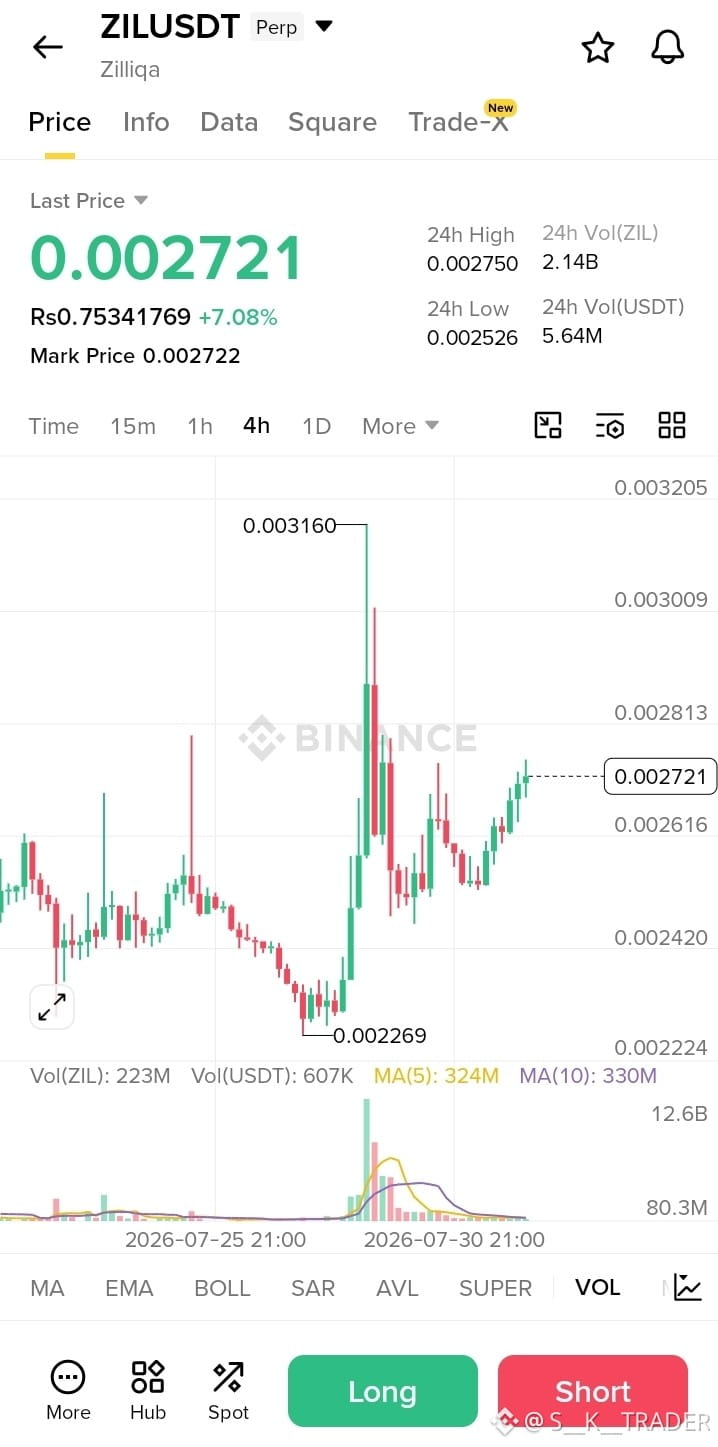
🚀 $ZIL/USDT – Long Setup (20x Leverage Max) 🚀
📌 Trade Plan
Entry Zone: 0.00268 – 0.00272
Stop Loss: 0.00258
Targets:TP1: 0.00285
TP2: 0.00300
📊 Setup Insight
Buyers are stepping in as $ZIL holds above 0.00268. A clean long entry here could trigger momentum toward 0.00285–0.00300, with risk capped at 0.00258.
💡 Debate Point
Is this the start of a relief rally, or will sellers defend resistance again?#Crypto #Ziliqa #LongSetup #LeverageTrading #BreakoutPlay
$ZIL
{future}(ZILUSDT)
🚀 $ZIL /USDT – Long Setup (20x Leverage Max) 🚀
📌 Trade Plan
Entry Zone: 0.00268 – 0.00272
Stop Loss: 0.00258
Targets:TP1: 0.00285
TP2: 0.00300
📊 Setup Insight
Buyers are stepping in as $ZIL holds above 0.00268. A clean long entry here could trigger momentum toward 0.00285–0.00300, with risk capped at 0.00258.
💡 Debate Point
Is this the start of a relief rally, or will sellers defend resistance again?#Crypto #Ziliqa #LongSetup #LeverageTrading #BreakoutPlay
$ZIL
📌 Trade Plan
Entry Zone: 0.00268 – 0.00272
Stop Loss: 0.00258
Targets:TP1: 0.00285
TP2: 0.00300
📊 Setup Insight
Buyers are stepping in as $ZIL holds above 0.00268. A clean long entry here could trigger momentum toward 0.00285–0.00300, with risk capped at 0.00258.
💡 Debate Point
Is this the start of a relief rally, or will sellers defend resistance again?#Crypto #Ziliqa #LongSetup #LeverageTrading #BreakoutPlay
$ZIL
78
Log in to explore more content
Join global crypto users on Binance Square
⚡️ Get latest and useful information about crypto.
💬 Trusted by the world’s largest crypto exchange.
👍 Discover real insights from verified creators.
Email / Phone number
Trending Topics
1
#NvidiaBeatsEstimatesWith$130BQ4Outlook
6,748 views
114 Discussing
2
#AnthropicIPOPriceCouldExceed$80
12,499 views
108 Discussing
3
#CanNvidia’sDataCenterGrowthContinue?
34,969 views
514 Discussing
4
#CanadaAndUSLaunchOperationNiagaraAgainstApprovalPhishing
15 views
4 Discussing
5
#BankOfEnglandUnveilsClearingHousePathwayCoveringDLTFirms
1,062 views
21 Discussing
6
#DBSAndCirclePartnerToExpandAsianInstitutionsUSDCAccess
2,481 views
43 Discussing
7
#LedgerHardwareImplantReportsExtendToDubai
6,693 views
163 Discussing
8
#NvidiaBoardNotConsideringHuang’sReturnasCEO
197,748 views
1,442 Discussing
9
#KOSPIFalls2.59%ToLowestCloseSinceFebruary
56,091 views
636 Discussing
10
#AnthropicClearedToListOnNasdaqAsANT
49,419 views
512 Discussing