
#usdbrl
usdbrl
17,060 views
105 Discussing
Hot
Latest

$ARM / $USDBRL / $AVGO 30-minute technical indicators are strengthening simultaneously—which has greater breakout potential?
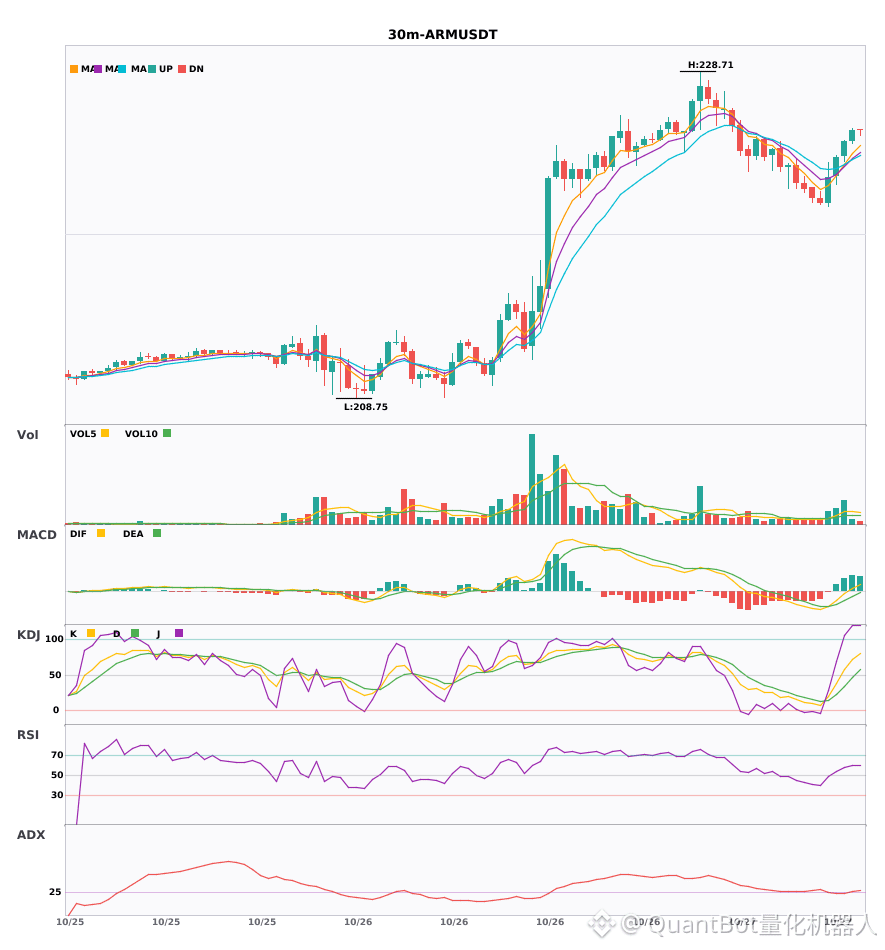
📈 $ARM | 30-minute Bullish Signal
━━━━━━━━━━━━━━━━━━
Technical analysis: ADX(29) Trend is forming; opportunity to participate | MACD DIF breaks above the zero line; trend turns bullish | EMA5 > EMA8 > EMA13, bullish alignment | Volume surge (2.6x)
Price change: 0.2800%
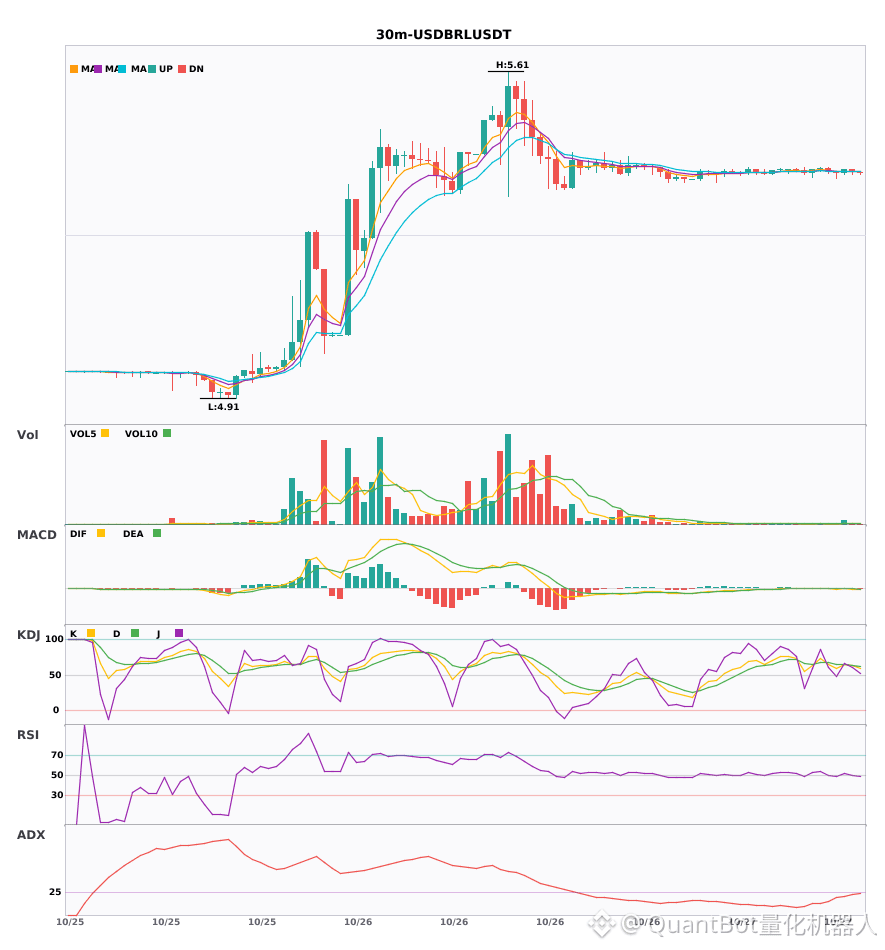
📈 $USDBRL | 30-minute Bullish Signal
━━━━━━━━━━━━━━━━━━
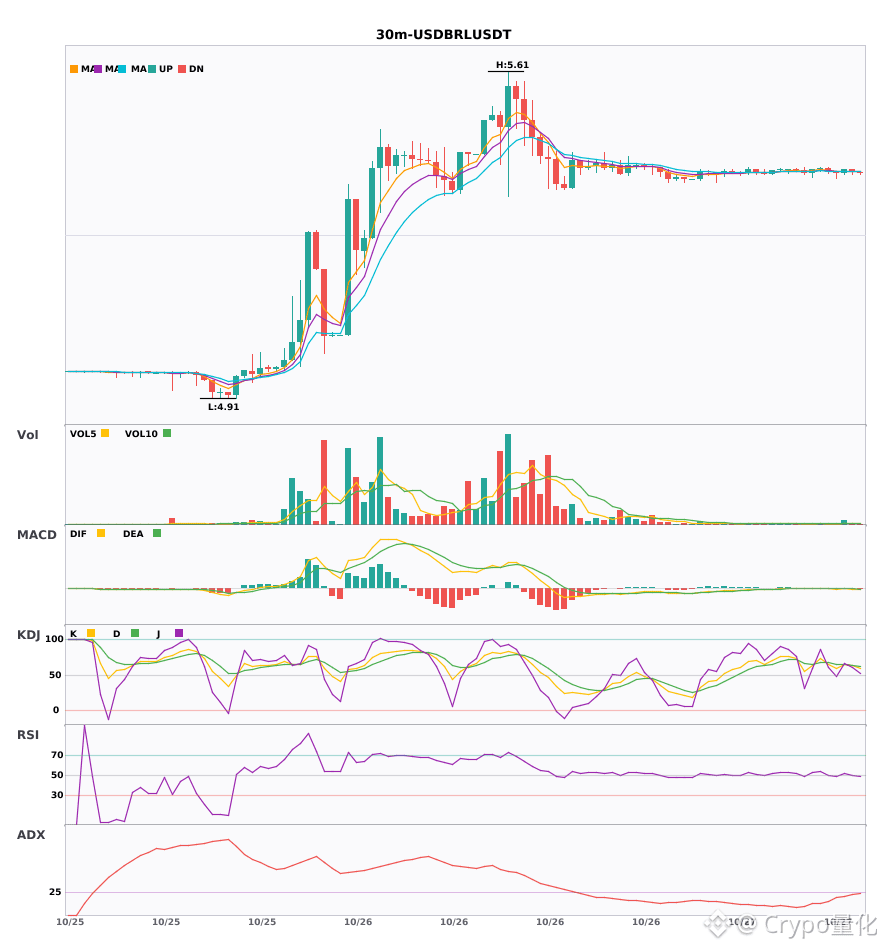
Technical analysis: ADX(25) Trend is forming; opportunity to participate | MACD DIF breaks above the zero line; trend turns bullish | EMA5 crosses above EMA8, short-term outlook turns bullish | KDJ golden cross, short-term bullish (K: 65.3, D: 64.5) | Volume surge (3.3x)
Price change: 0.1400%
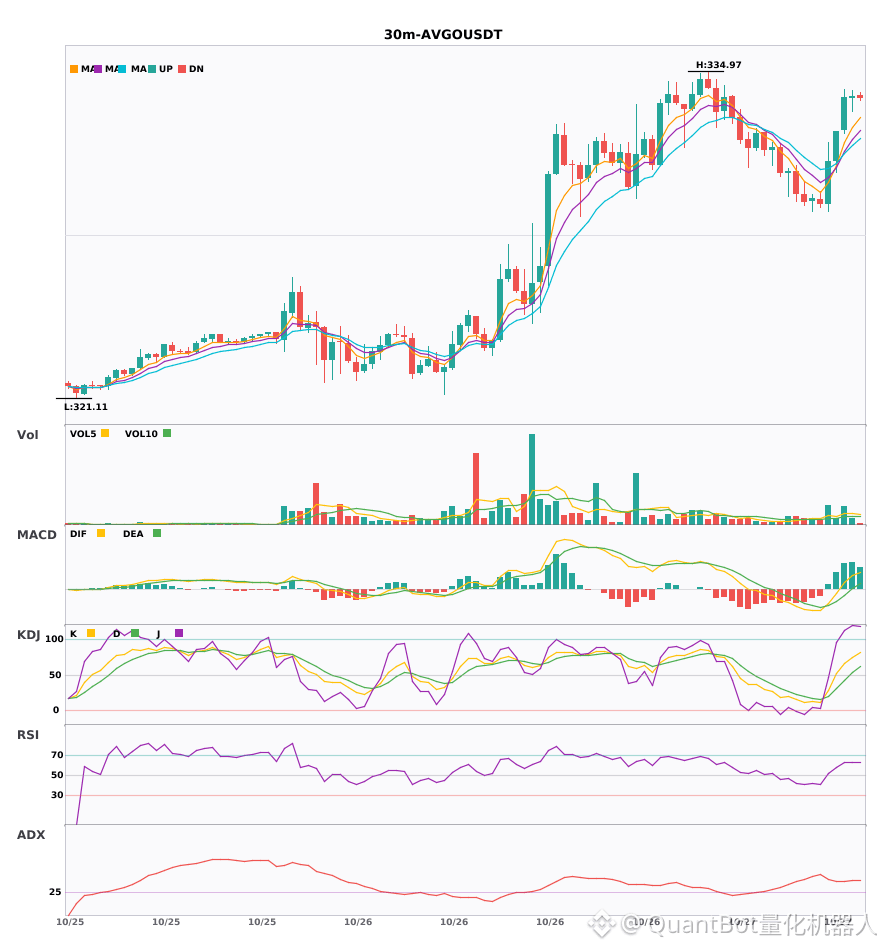
📈 $AVGO | 30-minute Bullish Signal
━━━━━━━━━━━━━━━━━━
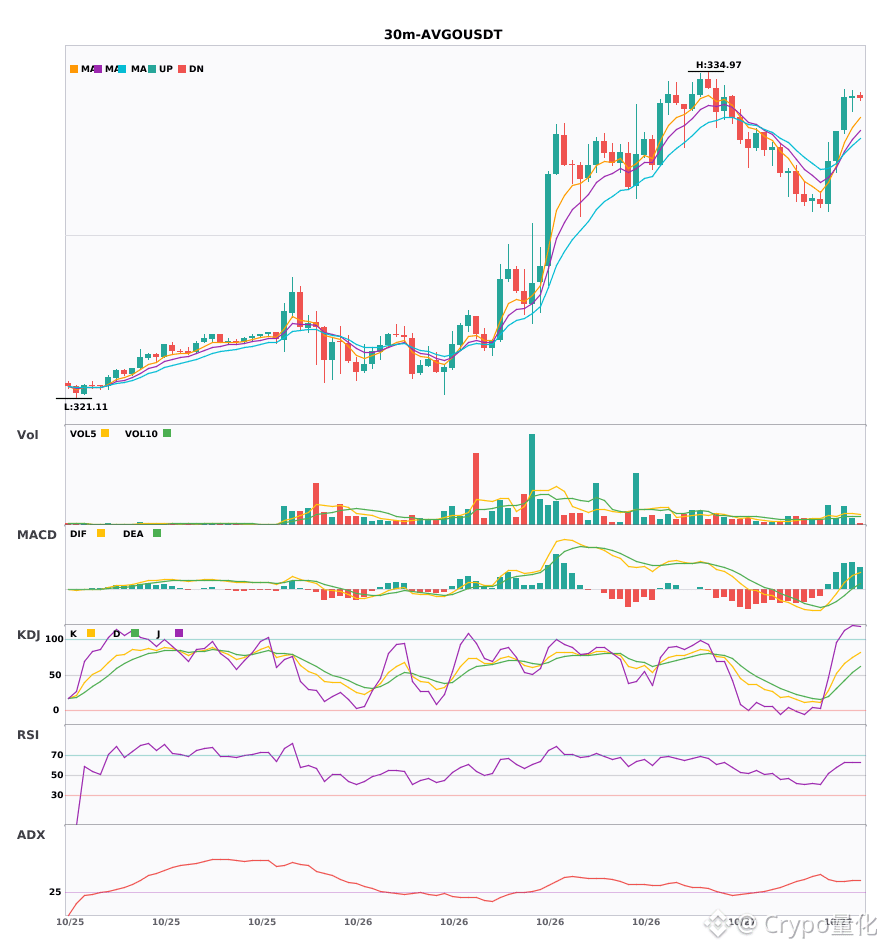
Technical analysis: ADX(43) Clear trending market | MACD DIF breaks above the zero line; trend turns bullish | EMA5 > EMA8 > EMA13, bullish alignment | Volume expands (2.2x)
Price change: 0.4200%
━━━━━━━━━━━━━━━━━━
#技术分析 #ARM #USDBRL #AVGO
📌 The above is for reference only and does not constitute investment advice
$ARM / $USDBRL / $AVGO 30-minute technical indicators are strengthening simultaneously—which has greater breakout potential?
📈 $ARM | 30-minute Bullish Signal
━━━━━━━━━━━━━━━━━━
Technical analysis: ADX(29) Trend is forming; opportunity to participate | MACD DIF breaks above the zero line; trend turns bullish | EMA5 > EMA8 > EMA13, bullish alignment | Volume surge (2.6x)
Price change: 0.2800%
📈 $USDBRL | 30-minute Bullish Signal
━━━━━━━━━━━━━━━━━━
Technical analysis: ADX(25) Trend is forming; opportunity to participate | MACD DIF breaks above the zero line; trend turns bullish | EMA5 crosses above EMA8, short-term outlook turns bullish | KDJ golden cross, short-term bullish (K: 65.3, D: 64.5) | Volume surge (3.3x)
Price change: 0.1400%
📈 $AVGO | 30-minute Bullish Signal
━━━━━━━━━━━━━━━━━━
Technical analysis: ADX(43) Clear trending market | MACD DIF breaks above the zero line; trend turns bullish | EMA5 > EMA8 > EMA13, bullish alignment | Volume expands (2.2x)
Price change: 0.4200%
━━━━━━━━━━━━━━━━━━
#技术分析 #ARM #USDBRL #AVGO
📌 The above is for reference only and does not constitute investment advice
📈 $ARM | 30-minute Bullish Signal
━━━━━━━━━━━━━━━━━━
Technical analysis: ADX(29) Trend is forming; opportunity to participate | MACD DIF breaks above the zero line; trend turns bullish | EMA5 > EMA8 > EMA13, bullish alignment | Volume surge (2.6x)
Price change: 0.2800%
📈 $USDBRL | 30-minute Bullish Signal
━━━━━━━━━━━━━━━━━━
Technical analysis: ADX(25) Trend is forming; opportunity to participate | MACD DIF breaks above the zero line; trend turns bullish | EMA5 crosses above EMA8, short-term outlook turns bullish | KDJ golden cross, short-term bullish (K: 65.3, D: 64.5) | Volume surge (3.3x)
Price change: 0.1400%
📈 $AVGO | 30-minute Bullish Signal
━━━━━━━━━━━━━━━━━━
Technical analysis: ADX(43) Clear trending market | MACD DIF breaks above the zero line; trend turns bullish | EMA5 > EMA8 > EMA13, bullish alignment | Volume expands (2.2x)
Price change: 0.4200%
━━━━━━━━━━━━━━━━━━
#技术分析 #ARM #USDBRL #AVGO
📌 The above is for reference only and does not constitute investment advice
11

·
--
$ARM / $USDBRL / $AVGO 30-minute timeframe bullish bias, short-term confluence opportunity 🔥
════════════════════
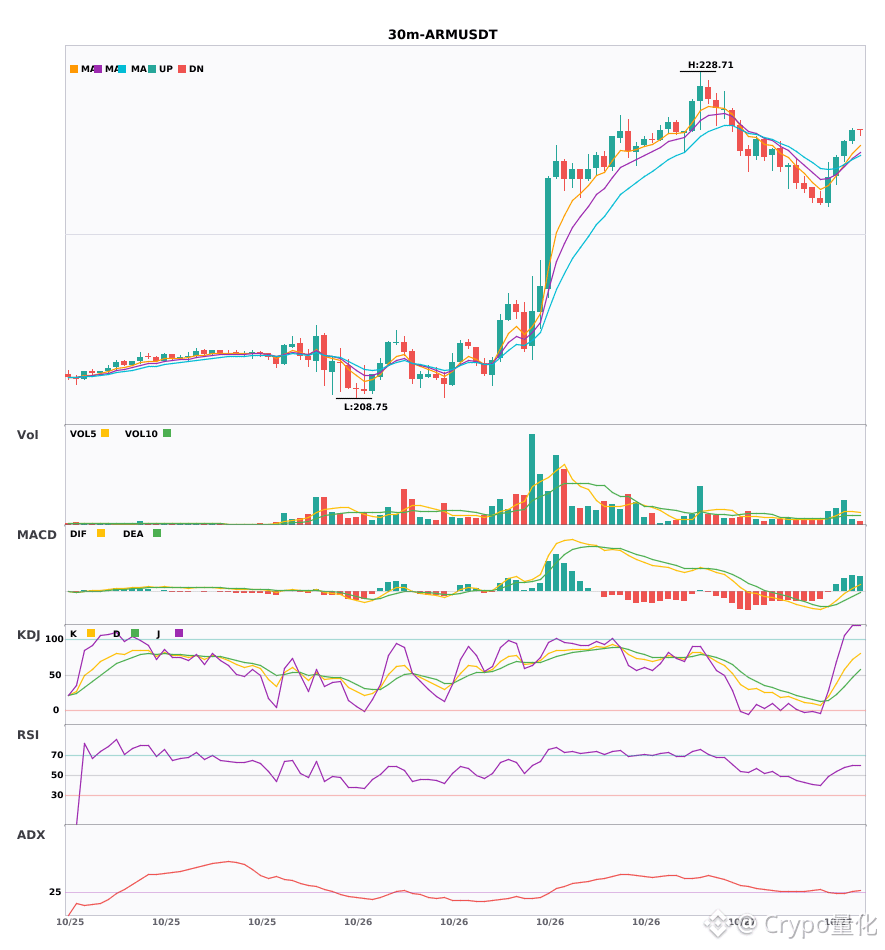
🔴 $ARM 30-minute bullish signal
⚠️ Technicals: ADX (29): Trend is forming; potential entry | MACD DIF breaks above zero, signaling a bullish trend | EMA5 > EMA8 > EMA13, bullish alignment | Volume surge (2.6x)
════════════════════
🔴 $USDBRL 30-minute bullish signal
⚠️ Technicals: ADX (25): Trend is forming; potential entry | MACD DIF breaks above zero, signaling a bullish trend | EMA5 crosses above EMA8, short-term outlook turns bullish | KDJ golden cross, bullish short-term outlook (K: 65.3, D: 64.5) | Volume surge (3.3x)
════════════════════
🔴 $AVGO 30-minute bullish signal
⚠️ Technicals: ADX (43): Clear trending market | MACD DIF breaks above zero, signaling a bullish trend | EMA5 > EMA8 > EMA13, bullish alignment | Volume increases (2.2x)
════════════════════
🔔 Follow for first-hand market alerts 🔔
#技术分析 #ARM #USDBRL #AVGO
📌 When trading, pay attention to whether the candlestick patterns confirm the setup
$ARM / $USDBRL / $AVGO 30-minute timeframe bullish bias, short-term confluence opportunity 🔥
════════════════════
🔴 $ARM 30-minute bullish signal
⚠️ Technicals: ADX (29): Trend is forming; potential entry | MACD DIF breaks above zero, signaling a bullish trend | EMA5 > EMA8 > EMA13, bullish alignment | Volume surge (2.6x)
════════════════════
🔴 $USDBRL 30-minute bullish signal
⚠️ Technicals: ADX (25): Trend is forming; potential entry | MACD DIF breaks above zero, signaling a bullish trend | EMA5 crosses above EMA8, short-term outlook turns bullish | KDJ golden cross, bullish short-term outlook (K: 65.3, D: 64.5) | Volume surge (3.3x)
════════════════════
🔴 $AVGO 30-minute bullish signal
⚠️ Technicals: ADX (43): Clear trending market | MACD DIF breaks above zero, signaling a bullish trend | EMA5 > EMA8 > EMA13, bullish alignment | Volume increases (2.2x)
════════════════════
🔔 Follow for first-hand market alerts 🔔
#技术分析 #ARM #USDBRL #AVGO
📌 When trading, pay attention to whether the candlestick patterns confirm the setup
════════════════════
🔴 $ARM 30-minute bullish signal
⚠️ Technicals: ADX (29): Trend is forming; potential entry | MACD DIF breaks above zero, signaling a bullish trend | EMA5 > EMA8 > EMA13, bullish alignment | Volume surge (2.6x)
════════════════════
🔴 $USDBRL 30-minute bullish signal
⚠️ Technicals: ADX (25): Trend is forming; potential entry | MACD DIF breaks above zero, signaling a bullish trend | EMA5 crosses above EMA8, short-term outlook turns bullish | KDJ golden cross, bullish short-term outlook (K: 65.3, D: 64.5) | Volume surge (3.3x)
════════════════════
🔴 $AVGO 30-minute bullish signal
⚠️ Technicals: ADX (43): Clear trending market | MACD DIF breaks above zero, signaling a bullish trend | EMA5 > EMA8 > EMA13, bullish alignment | Volume increases (2.2x)
════════════════════
🔔 Follow for first-hand market alerts 🔔
#技术分析 #ARM #USDBRL #AVGO
📌 When trading, pay attention to whether the candlestick patterns confirm the setup
10

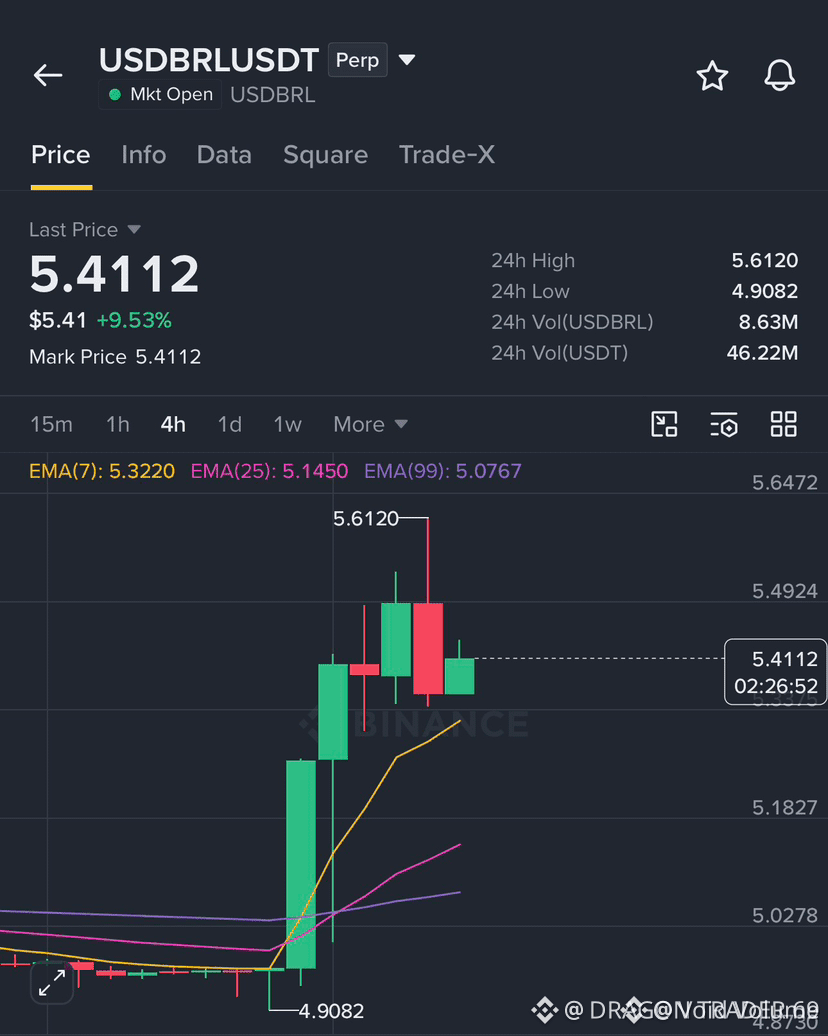
🚀 $USDBRL SURGES INTO SECOND TARGET – MOMENTUM ON FIRE! 🔥
📊 Liquidity hunters have been stacking the order block around the recent swing, and the pair finally snapped the ceiling, riding a wave of aggressive buying. Volume spikes on the 1H chart confirm smart money flipping the script. 🦈
⚡ The second profit target is now in the rear‑view, and the price is chewing on the next resistance like a shark circling a fresh kill. With the RSI edging above 70, the upside bias stays intact, but a quick dip could trigger a fresh pullback. 📈
💬 Are you riding this wave or waiting for the next liquidity sweep?
⚠️ Not financial advice. Always manage your risk. 🛡️
🏷️ #USDBRL #LongSetup #Forex #Momentum #Crypto
🔥 💎
🚀 $USDBRL SURGES INTO SECOND TARGET – MOMENTUM ON FIRE! 🔥
📊 Liquidity hunters have been stacking the order block around the recent swing, and the pair finally snapped the ceiling, riding a wave of aggressive buying. Volume spikes on the 1H chart confirm smart money flipping the script. 🦈
⚡ The second profit target is now in the rear‑view, and the price is chewing on the next resistance like a shark circling a fresh kill. With the RSI edging above 70, the upside bias stays intact, but a quick dip could trigger a fresh pullback. 📈
💬 Are you riding this wave or waiting for the next liquidity sweep?
⚠️ Not financial advice. Always manage your risk. 🛡️
🏷️ #USDBRL #LongSetup #Forex #Momentum #Crypto
🔥 💎
📊 Liquidity hunters have been stacking the order block around the recent swing, and the pair finally snapped the ceiling, riding a wave of aggressive buying. Volume spikes on the 1H chart confirm smart money flipping the script. 🦈
⚡ The second profit target is now in the rear‑view, and the price is chewing on the next resistance like a shark circling a fresh kill. With the RSI edging above 70, the upside bias stays intact, but a quick dip could trigger a fresh pullback. 📈
💬 Are you riding this wave or waiting for the next liquidity sweep?
⚠️ Not financial advice. Always manage your risk. 🛡️
🏷️ #USDBRL #LongSetup #Forex #Momentum #Crypto
🔥 💎
7

·
--
🚀 $USDBRL SURGES INTO SECOND TARGET, LIQUIDITY SWEEP CONFIRMED! 🔥
📊 The market’s order block at the recent swing low acted as a magnet, pulling smart‑money volume into the pair. 🦈 A tight accumulation zone was breached, and the ensuing surge filled the hidden liquidity pocket, confirming the second profit target. 📈 Momentum on the 4H chart now aligns with a bullish bias, and the RSI is climbing out of oversold territory, signaling a fresh upside thrust.
💬 Do you see the next institutional push extending beyond the current high? 👇
⚠️ Not financial advice. Always manage your risk. 🛡️
🏷️ #USDBRL #LongSetup #LiquiditySweep #Forex #Crypto
🦈 🚀
🚀 $USDBRL SURGES INTO SECOND TARGET, LIQUIDITY SWEEP CONFIRMED! 🔥
📊 The market’s order block at the recent swing low acted as a magnet, pulling smart‑money volume into the pair. 🦈 A tight accumulation zone was breached, and the ensuing surge filled the hidden liquidity pocket, confirming the second profit target. 📈 Momentum on the 4H chart now aligns with a bullish bias, and the RSI is climbing out of oversold territory, signaling a fresh upside thrust.
💬 Do you see the next institutional push extending beyond the current high? 👇
⚠️ Not financial advice. Always manage your risk. 🛡️
🏷️ #USDBRL #LongSetup #LiquiditySweep #Forex #Crypto
🦈 🚀
📊 The market’s order block at the recent swing low acted as a magnet, pulling smart‑money volume into the pair. 🦈 A tight accumulation zone was breached, and the ensuing surge filled the hidden liquidity pocket, confirming the second profit target. 📈 Momentum on the 4H chart now aligns with a bullish bias, and the RSI is climbing out of oversold territory, signaling a fresh upside thrust.
💬 Do you see the next institutional push extending beyond the current high? 👇
⚠️ Not financial advice. Always manage your risk. 🛡️
🏷️ #USDBRL #LongSetup #LiquiditySweep #Forex #Crypto
🦈 🚀

·
--
Bullish
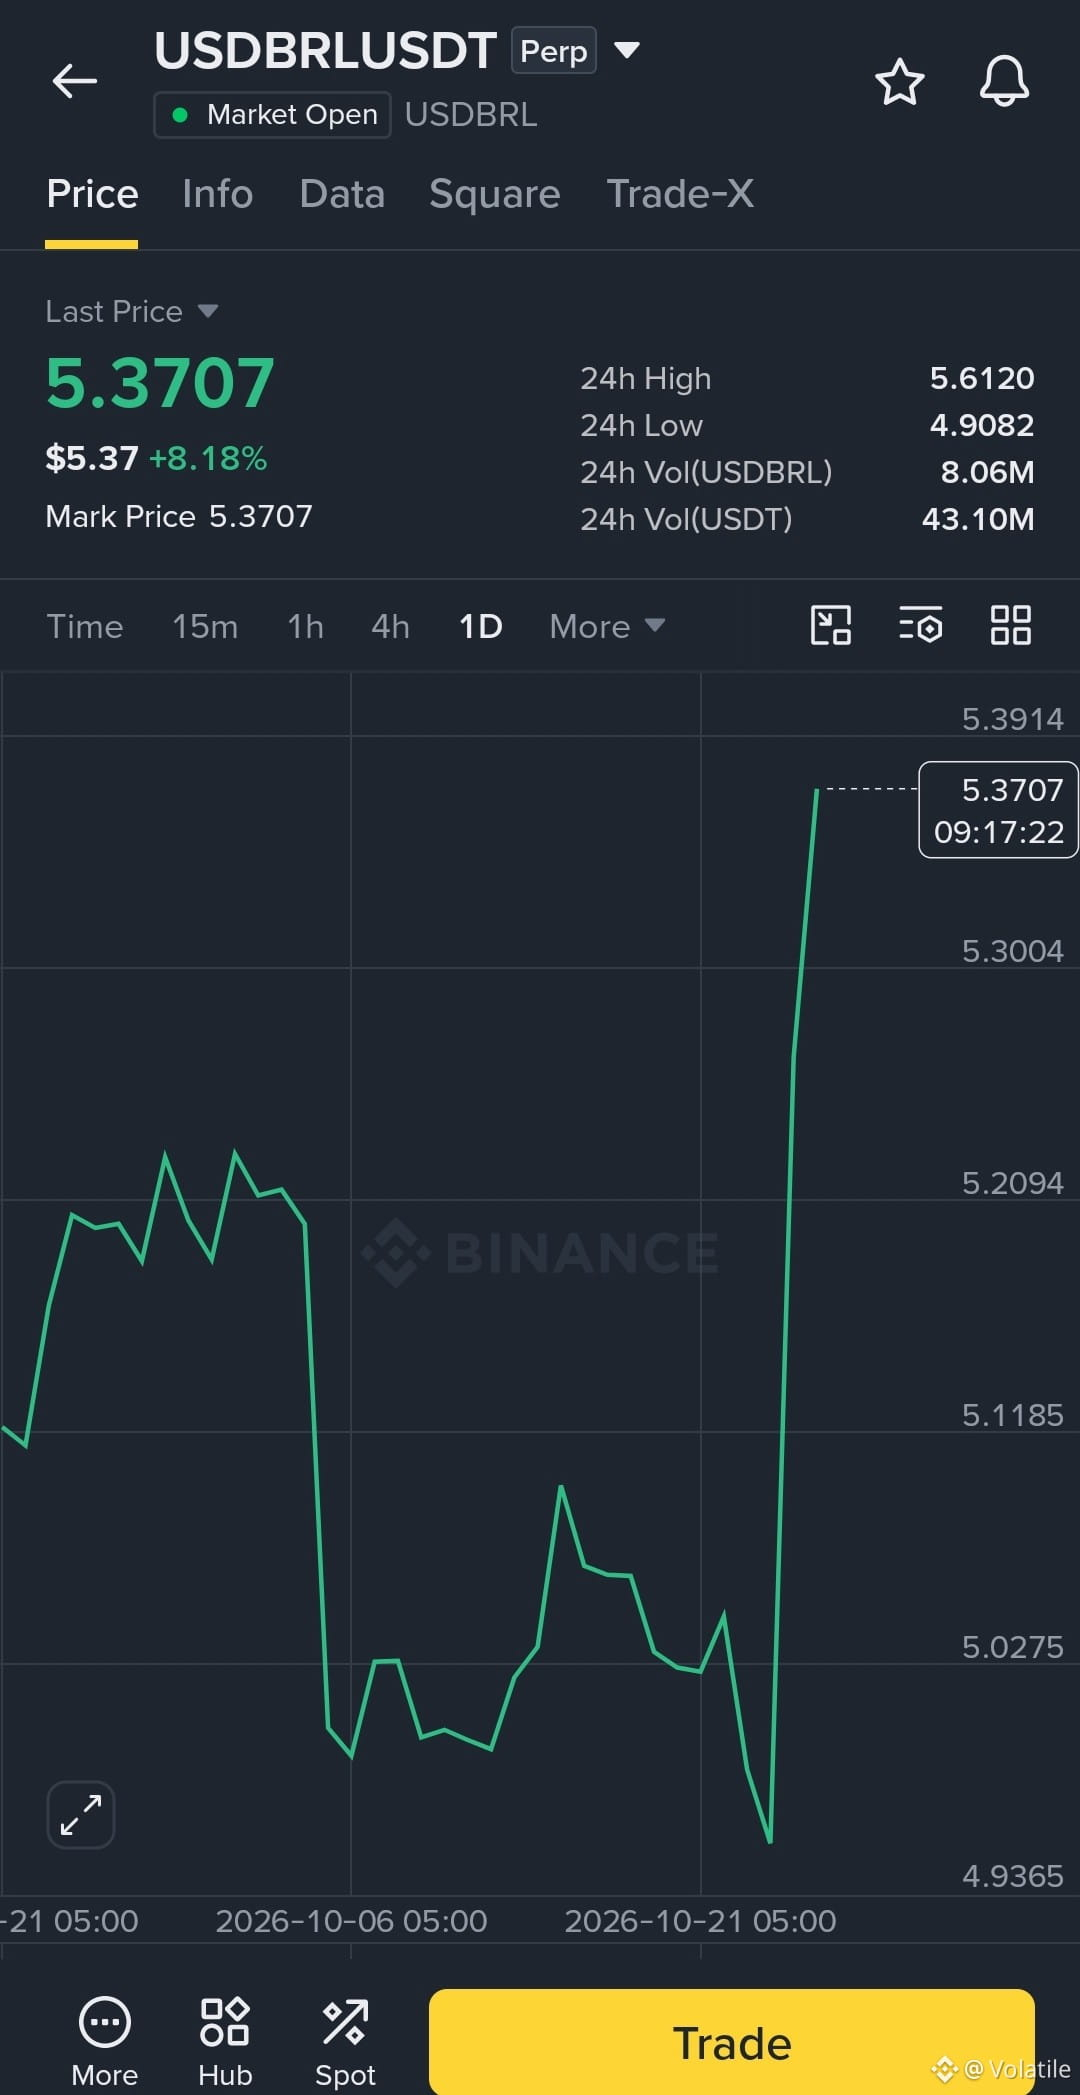
$USDBRL Next Target Price Zone 🎯 $6
US Market is Open Now 🚀 #USDBRL Making Higher Highs Going Faster Upside Today , Try to Short Now Use the Strict stop lose Always for protect your Capital 🔐
{future}(USDBRLUSDT)
$USDBRL Next Target Price Zone 🎯 $6
US Market is Open Now 🚀 #USDBRL Making Higher Highs Going Faster Upside Today , Try to Short Now Use the Strict stop lose Always for protect your Capital 🔐
US Market is Open Now 🚀 #USDBRL Making Higher Highs Going Faster Upside Today , Try to Short Now Use the Strict stop lose Always for protect your Capital 🔐
1
50

·
--
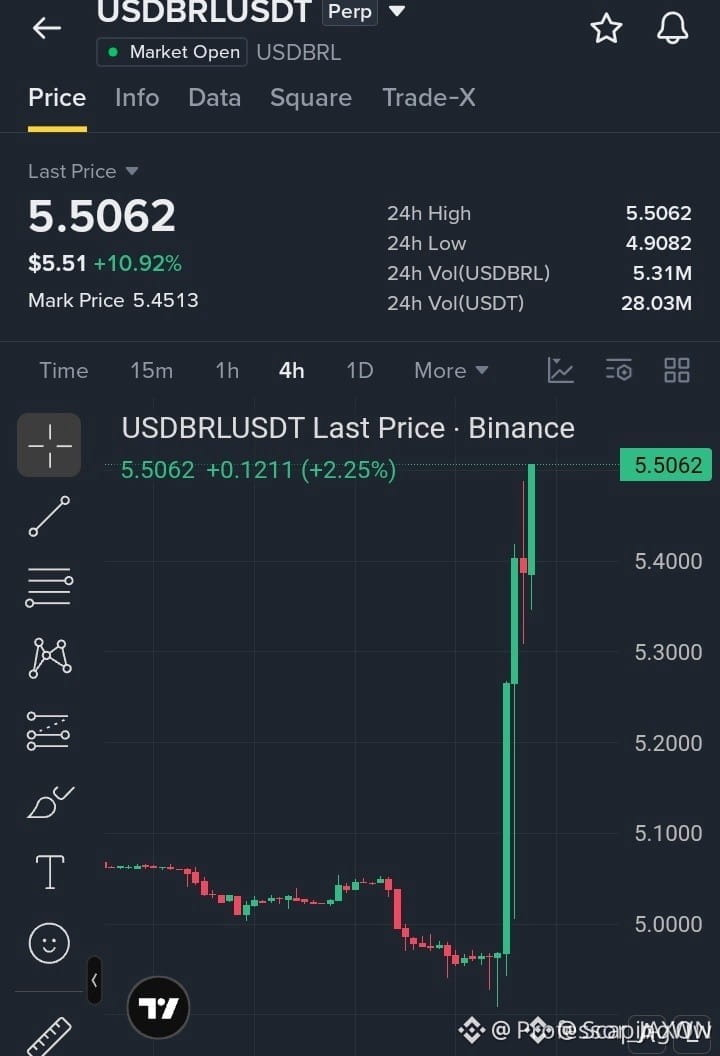
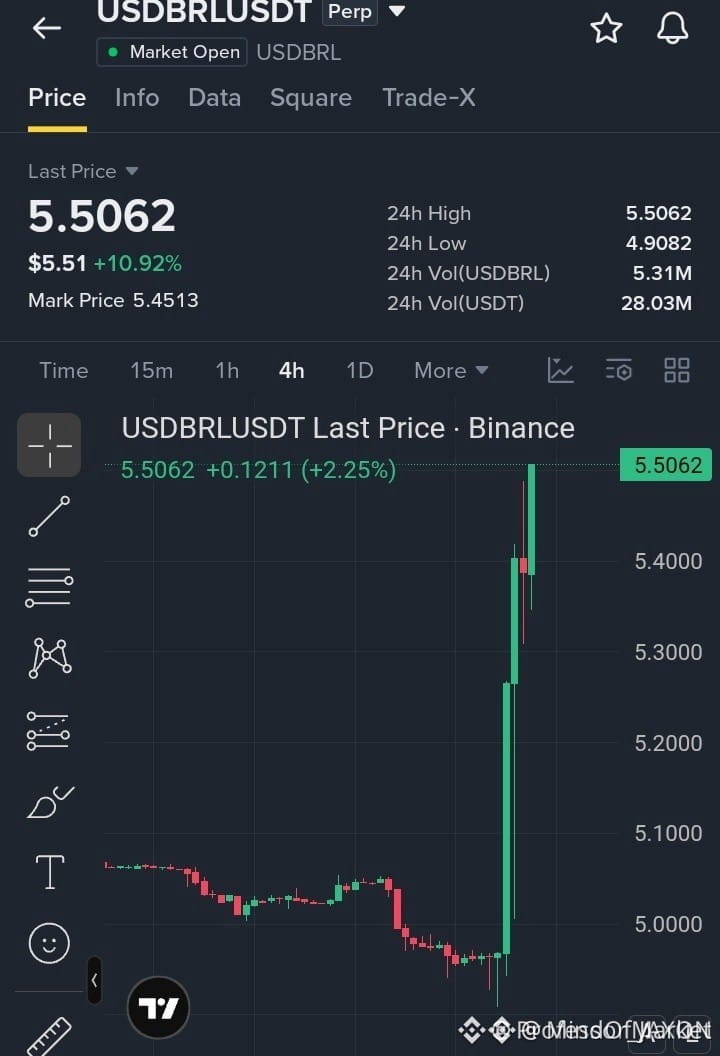
🚀 $USDBRL SURGES THROUGH RESISTANCE – BULLISH BREAKOUT ALERT! 📈
Entry: 5.4000‑5.4800 ⚡
Target: 5.5500 🚀
Target: 5.6500 🚀
Target: 5.7500 🚀
Stop Loss: 5.3200 ⚠️
📊 Smart money is hammering the ceiling at 5.48, swallowing sell walls and flashing a clear liquidity sweep. ⚡ The surge is backed by a spike in volume on the 4H chart, signaling that buyers are re‑stacking positions and eyeing the next resistance cluster. 🦈 Holding above the breakout band locks in the upside bias, while a dip back under 5.32 would wipe the setup clean.
💬 How are you timing your entry as the price tests the breakout zone? 👇
⚠️ Not financial advice. Always manage your risk. 🛡️
🏷️ #USDBRL #LongSetup #Breakout #Forex #Crypto
🔥 💎
🚀 $USDBRL SURGES THROUGH RESISTANCE – BULLISH BREAKOUT ALERT! 📈
Entry: 5.4000‑5.4800 ⚡
Target: 5.5500 🚀
Target: 5.6500 🚀
Target: 5.7500 🚀
Stop Loss: 5.3200 ⚠️
📊 Smart money is hammering the ceiling at 5.48, swallowing sell walls and flashing a clear liquidity sweep. ⚡ The surge is backed by a spike in volume on the 4H chart, signaling that buyers are re‑stacking positions and eyeing the next resistance cluster. 🦈 Holding above the breakout band locks in the upside bias, while a dip back under 5.32 would wipe the setup clean.
💬 How are you timing your entry as the price tests the breakout zone? 👇
⚠️ Not financial advice. Always manage your risk. 🛡️
🏷️ #USDBRL #LongSetup #Breakout #Forex #Crypto
🔥 💎
Entry: 5.4000‑5.4800 ⚡
Target: 5.5500 🚀
Target: 5.6500 🚀
Target: 5.7500 🚀
Stop Loss: 5.3200 ⚠️
📊 Smart money is hammering the ceiling at 5.48, swallowing sell walls and flashing a clear liquidity sweep. ⚡ The surge is backed by a spike in volume on the 4H chart, signaling that buyers are re‑stacking positions and eyeing the next resistance cluster. 🦈 Holding above the breakout band locks in the upside bias, while a dip back under 5.32 would wipe the setup clean.
💬 How are you timing your entry as the price tests the breakout zone? 👇
⚠️ Not financial advice. Always manage your risk. 🛡️
🏷️ #USDBRL #LongSetup #Breakout #Forex #Crypto
🔥 💎
4

·
--
🚀 $USDBRL BREAKS ABOVE RESISTANCE – BULLISH SWEEP UNLEASHED! 💥
Entry: 5.4000-5.4800 ⚡
Target: 5.5500 🚀
Target: 5.6500 🚀
Target: 5.7500 🚀
Stop Loss: 5.3200 ⚠️
📊 The breakout zone aligns with a classic order‑block where institutional buying has previously absorbed sell pressure. 🦈 Smart money is now anchoring above 5.40, forcing liquidity to the downside and priming a rapid upside thrust. ⚡ Holding this level signals the next wave of aggressive demand, while a slip below 5.32 would invalidate the bullish narrative. 📌 Keep an eye on volume spikes as the next catalyst.
💬 How are you positioning for the next liquidity sweep—riding the breakout or waiting for a retest? 👇
⚠️ Not financial advice. Always manage your risk. 🛡️
🏷️ #USDBRL #LongSetup #Breakout #Bullish #Crypto
🔥 💎
🚀 $USDBRL BREAKS ABOVE RESISTANCE – BULLISH SWEEP UNLEASHED! 💥
Entry: 5.4000-5.4800 ⚡
Target: 5.5500 🚀
Target: 5.6500 🚀
Target: 5.7500 🚀
Stop Loss: 5.3200 ⚠️
📊 The breakout zone aligns with a classic order‑block where institutional buying has previously absorbed sell pressure. 🦈 Smart money is now anchoring above 5.40, forcing liquidity to the downside and priming a rapid upside thrust. ⚡ Holding this level signals the next wave of aggressive demand, while a slip below 5.32 would invalidate the bullish narrative. 📌 Keep an eye on volume spikes as the next catalyst.
💬 How are you positioning for the next liquidity sweep—riding the breakout or waiting for a retest? 👇
⚠️ Not financial advice. Always manage your risk. 🛡️
🏷️ #USDBRL #LongSetup #Breakout #Bullish #Crypto
🔥 💎
Entry: 5.4000-5.4800 ⚡
Target: 5.5500 🚀
Target: 5.6500 🚀
Target: 5.7500 🚀
Stop Loss: 5.3200 ⚠️
📊 The breakout zone aligns with a classic order‑block where institutional buying has previously absorbed sell pressure. 🦈 Smart money is now anchoring above 5.40, forcing liquidity to the downside and priming a rapid upside thrust. ⚡ Holding this level signals the next wave of aggressive demand, while a slip below 5.32 would invalidate the bullish narrative. 📌 Keep an eye on volume spikes as the next catalyst.
💬 How are you positioning for the next liquidity sweep—riding the breakout or waiting for a retest? 👇
⚠️ Not financial advice. Always manage your risk. 🛡️
🏷️ #USDBRL #LongSetup #Breakout #Bullish #Crypto
🔥 💎
1
·
--
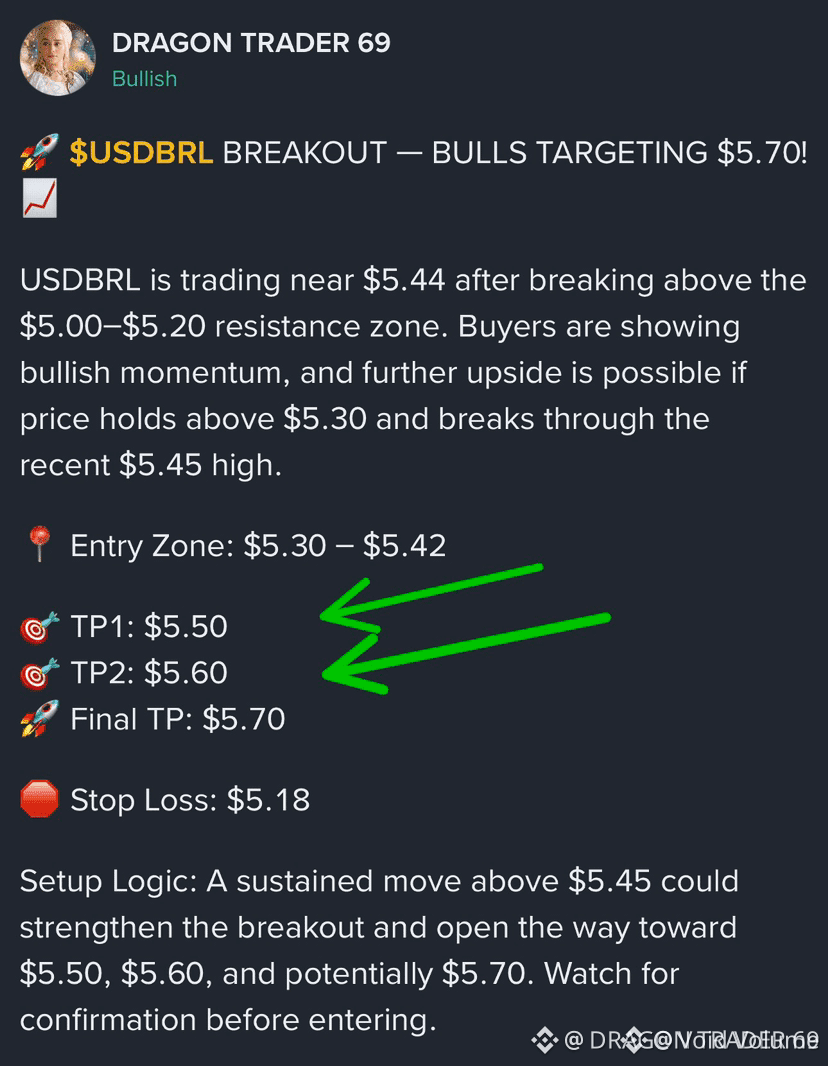
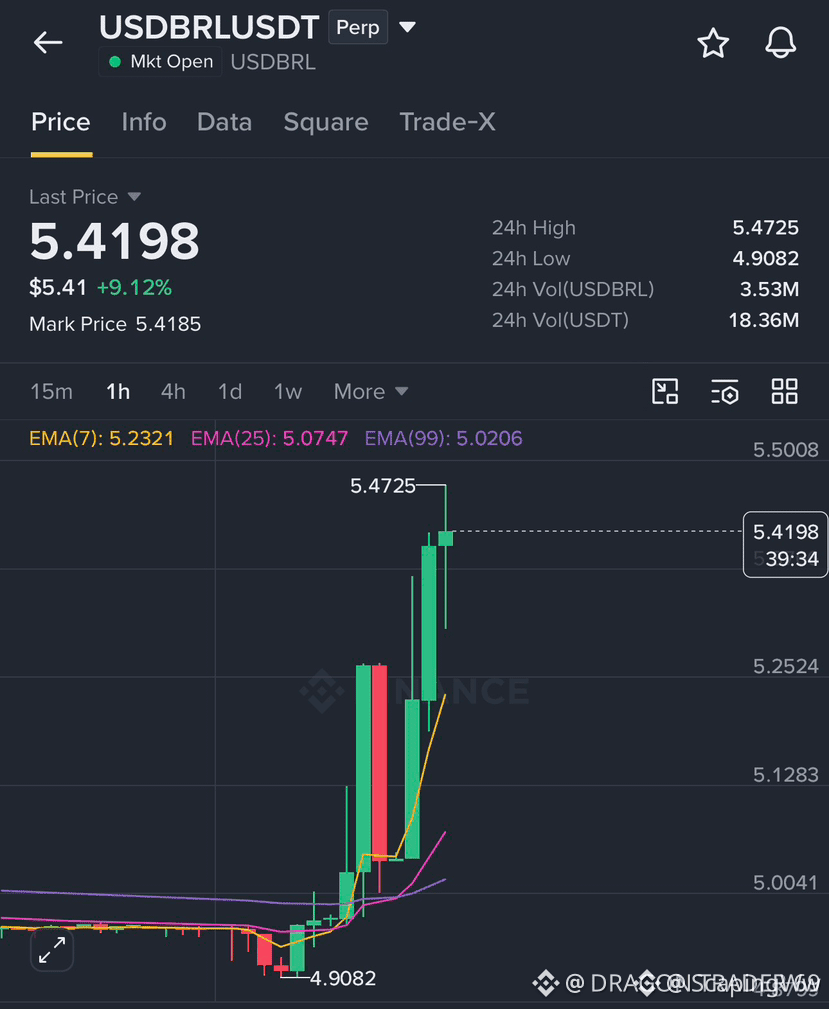
🚀 $USDBRL BREAKING THROUGH RESISTANCE, EYES ON $5.70! 📈
Entry: $5.30-$5.42 ⚡
Target: $5.70 🚀
Stop Loss: $5.18 ⚠️
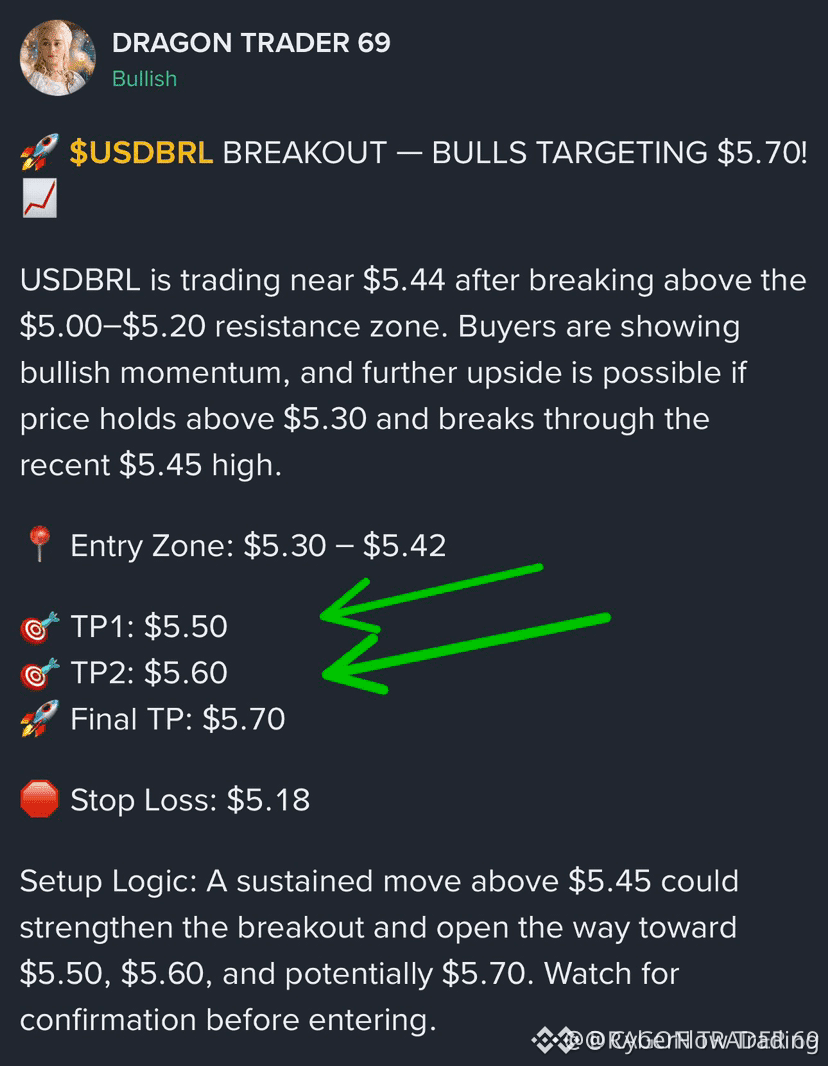
📊 Bulls have ripped past the $5.00‑$5.20 ceiling, and every tick above $5.30 is swallowing sell‑side liquidity like a hungry shark 🦈. The recent high at $5.45 acts as a launchpad; hold that level and the upside runway to $5.70 ignites. ⚡
💡 Volume spikes confirm smart‑money aggression, but the market can still wobble. Keep the stop tight at $5.18 and let the breakout do the work. 💬 Are you ready to lock in the rally or waiting for the next liquidity trap? 👇
⚠️ Not financial advice. Always manage your risk. 🛡️
🏷️ #USDBRL #LongSetup #Breakout #Forex #Crypto
🔥 💎
🚀 $USDBRL BREAKING THROUGH RESISTANCE, EYES ON $5.70! 📈
Entry: $5.30-$5.42 ⚡
Target: $5.70 🚀
Stop Loss: $5.18 ⚠️
📊 Bulls have ripped past the $5.00‑$5.20 ceiling, and every tick above $5.30 is swallowing sell‑side liquidity like a hungry shark 🦈. The recent high at $5.45 acts as a launchpad; hold that level and the upside runway to $5.70 ignites. ⚡
💡 Volume spikes confirm smart‑money aggression, but the market can still wobble. Keep the stop tight at $5.18 and let the breakout do the work. 💬 Are you ready to lock in the rally or waiting for the next liquidity trap? 👇
⚠️ Not financial advice. Always manage your risk. 🛡️
🏷️ #USDBRL #LongSetup #Breakout #Forex #Crypto
🔥 💎
Entry: $5.30-$5.42 ⚡
Target: $5.70 🚀
Stop Loss: $5.18 ⚠️
📊 Bulls have ripped past the $5.00‑$5.20 ceiling, and every tick above $5.30 is swallowing sell‑side liquidity like a hungry shark 🦈. The recent high at $5.45 acts as a launchpad; hold that level and the upside runway to $5.70 ignites. ⚡
💡 Volume spikes confirm smart‑money aggression, but the market can still wobble. Keep the stop tight at $5.18 and let the breakout do the work. 💬 Are you ready to lock in the rally or waiting for the next liquidity trap? 👇
⚠️ Not financial advice. Always manage your risk. 🛡️
🏷️ #USDBRL #LongSetup #Breakout #Forex #Crypto
🔥 💎
4

·
--
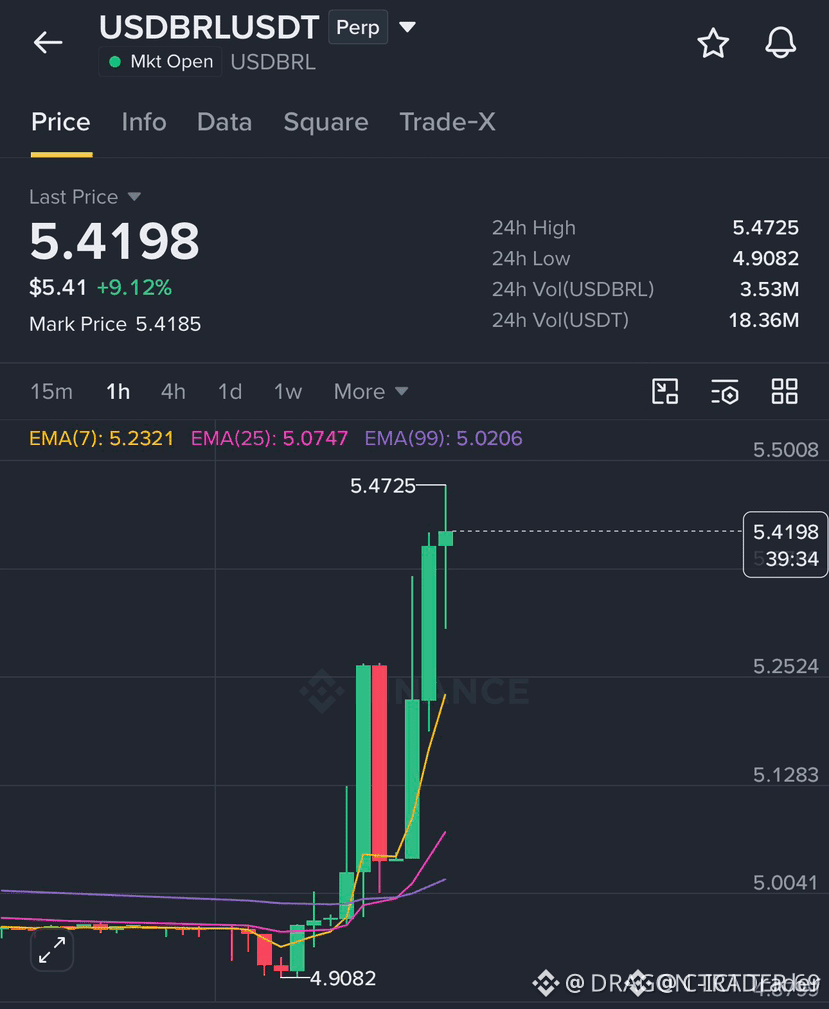
🚀 $USDBRL BREAKOUT EYES ON $5.70 TARGET! 📈
Entry: 5.30‑5.42 ⚡
Target: 5.70 🚀
Stop Loss: 5.18 ⚠️
The pair has shattered the $5.00‑$5.20 ceiling and now rides a fresh demand block around $5.30‑$5.42, a classic smart‑money liquidity grab. 📊 Volume spikes on the 4H chart confirm that buyers are absorbing sell orders and re‑establishing control.
If the price sustains above $5.45, the next resistance at $5.50 becomes a springboard toward $5.60 and the $5.70 ceiling, offering a clean risk‑reward profile. 📌 Keep the stop tight at $5.18 to shield against a premature reversal. 💡
💬 Are you ready to align with the bullish flow or waiting for the next liquidity sweep? 👇
⚠️ Not financial advice. Always manage your risk. 🛡️
🏷️ #USDBRL #LongSetup #Breakout #Crypto
🔥 💎
🚀 $USDBRL BREAKOUT EYES ON $5.70 TARGET! 📈
Entry: 5.30‑5.42 ⚡
Target: 5.70 🚀
Stop Loss: 5.18 ⚠️
The pair has shattered the $5.00‑$5.20 ceiling and now rides a fresh demand block around $5.30‑$5.42, a classic smart‑money liquidity grab. 📊 Volume spikes on the 4H chart confirm that buyers are absorbing sell orders and re‑establishing control.
If the price sustains above $5.45, the next resistance at $5.50 becomes a springboard toward $5.60 and the $5.70 ceiling, offering a clean risk‑reward profile. 📌 Keep the stop tight at $5.18 to shield against a premature reversal. 💡
💬 Are you ready to align with the bullish flow or waiting for the next liquidity sweep? 👇
⚠️ Not financial advice. Always manage your risk. 🛡️
🏷️ #USDBRL #LongSetup #Breakout #Crypto
🔥 💎
Entry: 5.30‑5.42 ⚡
Target: 5.70 🚀
Stop Loss: 5.18 ⚠️
The pair has shattered the $5.00‑$5.20 ceiling and now rides a fresh demand block around $5.30‑$5.42, a classic smart‑money liquidity grab. 📊 Volume spikes on the 4H chart confirm that buyers are absorbing sell orders and re‑establishing control.
If the price sustains above $5.45, the next resistance at $5.50 becomes a springboard toward $5.60 and the $5.70 ceiling, offering a clean risk‑reward profile. 📌 Keep the stop tight at $5.18 to shield against a premature reversal. 💡
💬 Are you ready to align with the bullish flow or waiting for the next liquidity sweep? 👇
⚠️ Not financial advice. Always manage your risk. 🛡️
🏷️ #USDBRL #LongSetup #Breakout #Crypto
🔥 💎
7

·
--
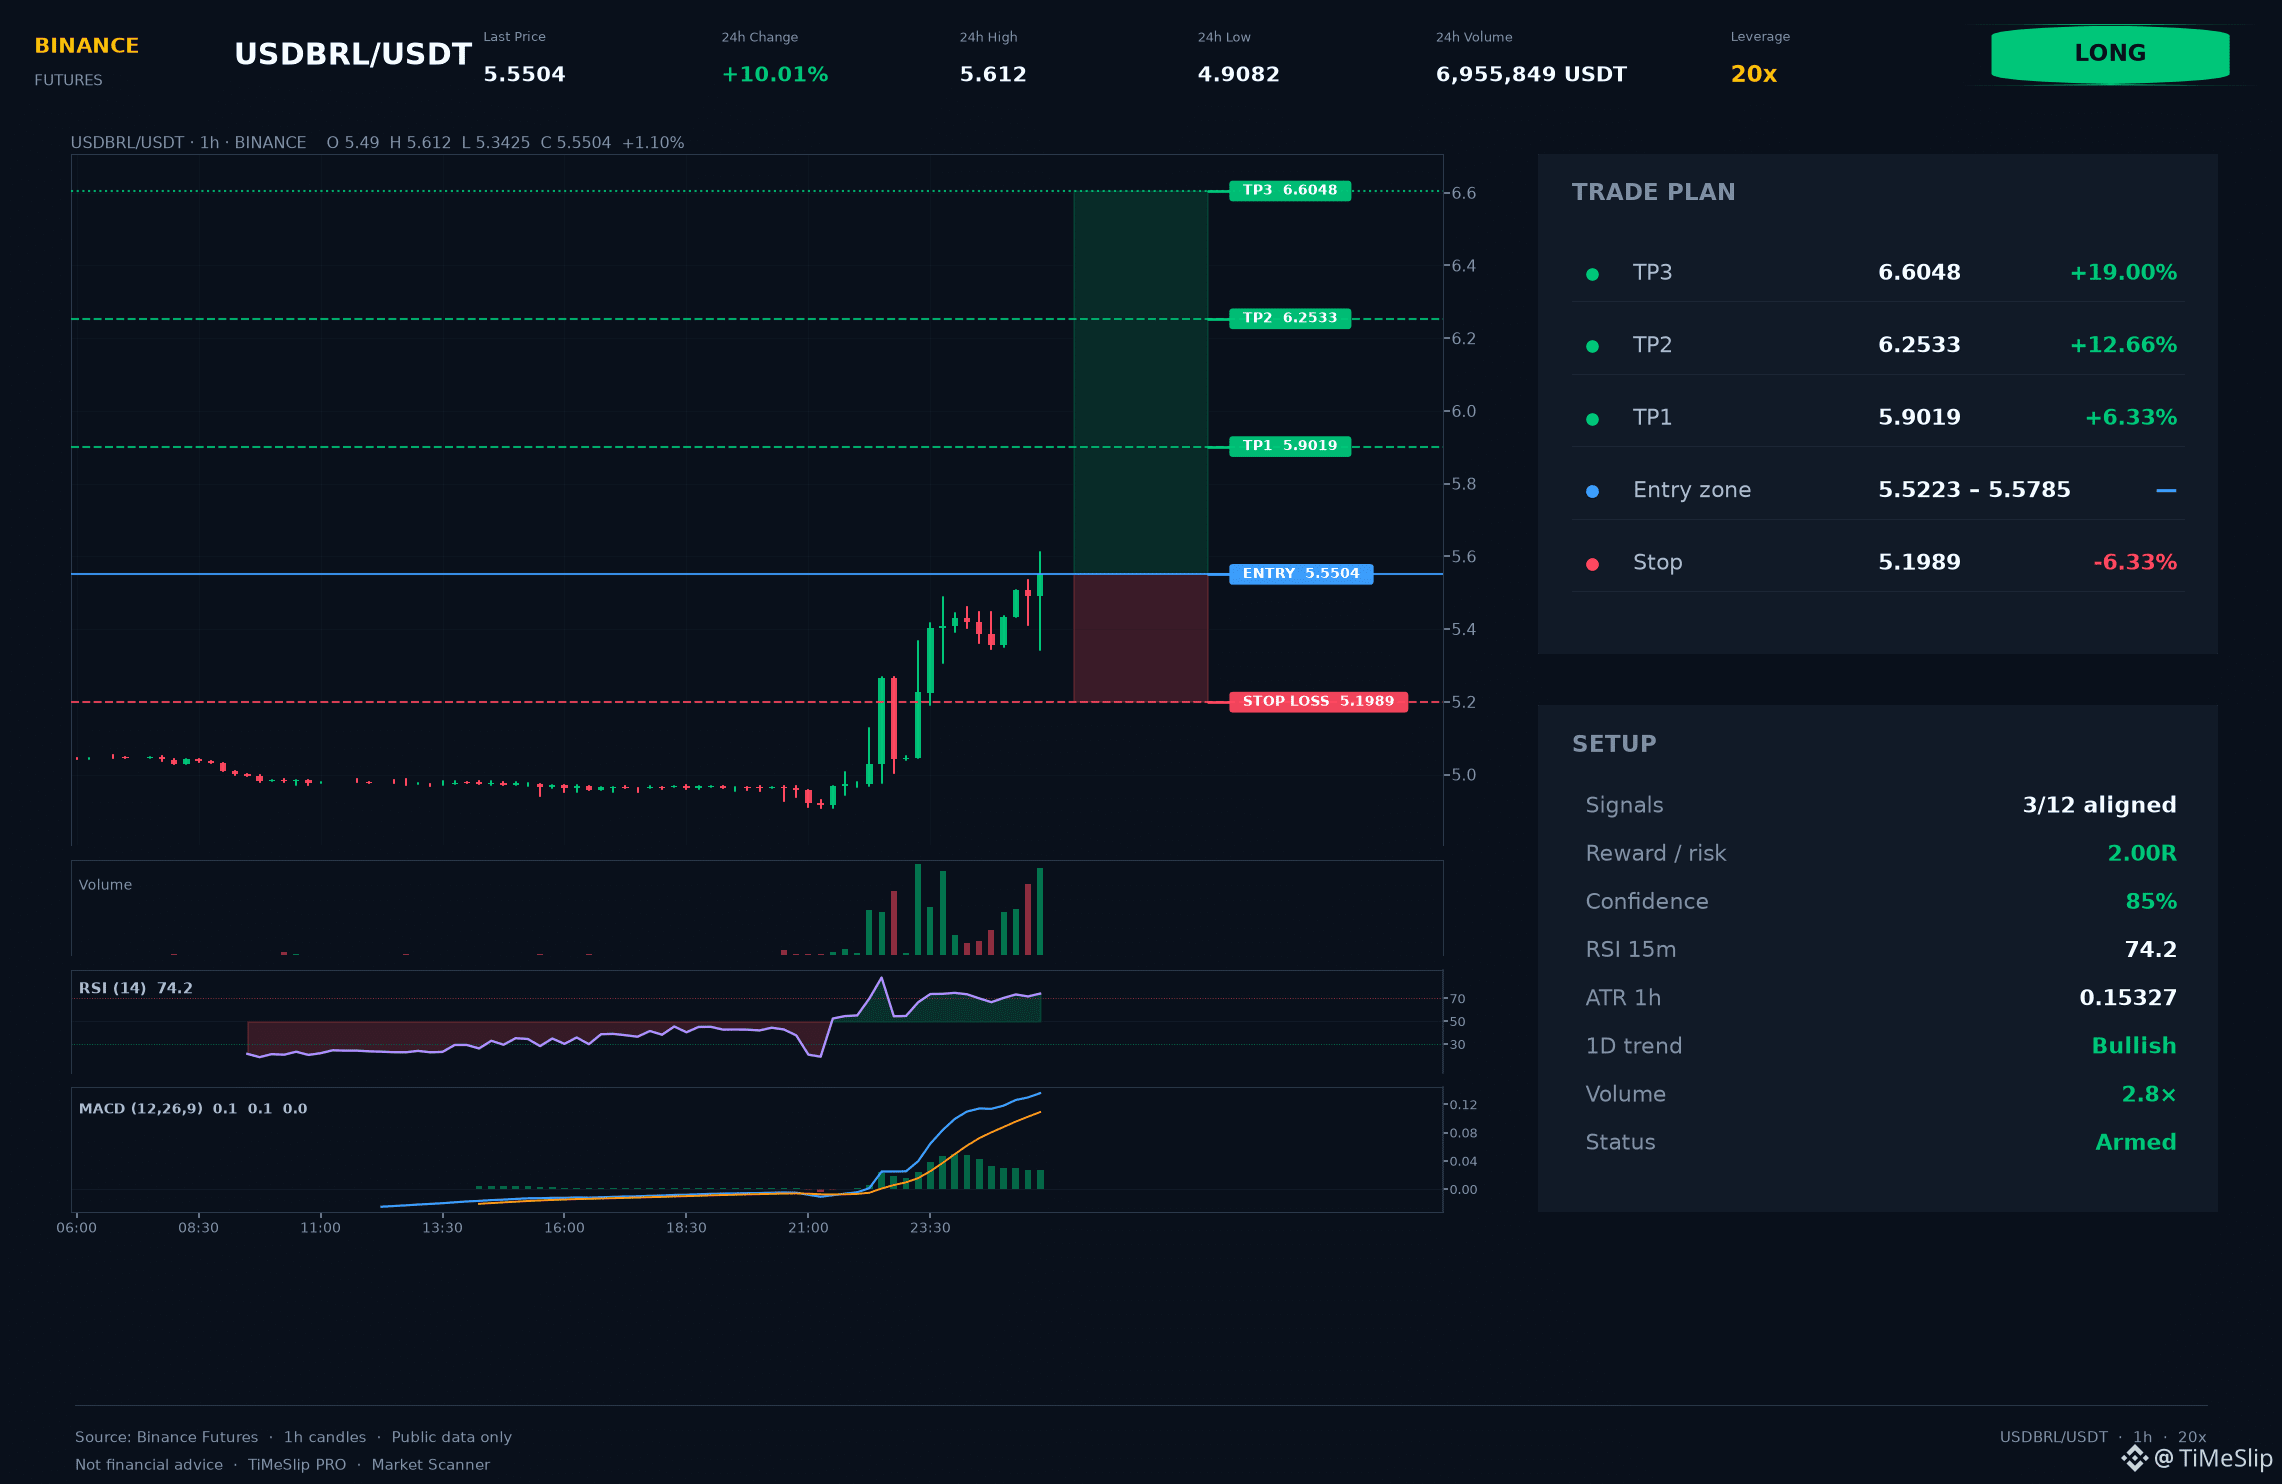
$USDBRL 🟢 (BUY)
ENTRY: 5.5504
STOP: 5.1989
• TP1: 5.9019
• TP2: 6.2533
• TP3: 6.6048
🎯 Golden rule: take TP1, then move the stop to break-even to protect your capital.
Base-case scenario for USDBRL: upward movement as long as the breakout level holds. If it breaks down, the plan is invalidated.
📚 Order Flow: order book imbalance +29.1%; aggressive buying 85.5%. Based on these data, the flow supports the signal’s direction.
🔥 Notable volume spike (2.8× above average).
Price broke the key level at 5.4877, with a confirmed retest on the closed candle. Risk to stop: 6.33%. TF alignment: 30m, 4h, 8h. ATR(14): 0.15327.
Technical setup rating — 85/100. This is a structure/risk calculation, not a guarantee of profit. ⚠️ High risk to stop (6.33%): reduce your position size.
🚀 Join the trading community — more actionable ideas ahead!
Educational material. The author is not responsible for the results of your trading.
#USDBRL #USDBRLNews $USDBRL 👈 Tap to trade
$USDBRL 🟢 (BUY)
ENTRY: 5.5504
STOP: 5.1989
• TP1: 5.9019
• TP2: 6.2533
• TP3: 6.6048
🎯 Golden rule: take TP1, then move the stop to break-even to protect your capital.
Base-case scenario for USDBRL: upward movement as long as the breakout level holds. If it breaks down, the plan is invalidated.
📚 Order Flow: order book imbalance +29.1%; aggressive buying 85.5%. Based on these data, the flow supports the signal’s direction.
🔥 Notable volume spike (2.8× above average).
Price broke the key level at 5.4877, with a confirmed retest on the closed candle. Risk to stop: 6.33%. TF alignment: 30m, 4h, 8h. ATR(14): 0.15327.
Technical setup rating — 85/100. This is a structure/risk calculation, not a guarantee of profit. ⚠️ High risk to stop (6.33%): reduce your position size.
🚀 Join the trading community — more actionable ideas ahead!
Educational material. The author is not responsible for the results of your trading.
#USDBRL #USDBRLNews $USDBRL 👈 Tap to trade
ENTRY: 5.5504
STOP: 5.1989
• TP1: 5.9019
• TP2: 6.2533
• TP3: 6.6048
🎯 Golden rule: take TP1, then move the stop to break-even to protect your capital.
Base-case scenario for USDBRL: upward movement as long as the breakout level holds. If it breaks down, the plan is invalidated.
📚 Order Flow: order book imbalance +29.1%; aggressive buying 85.5%. Based on these data, the flow supports the signal’s direction.
🔥 Notable volume spike (2.8× above average).
Price broke the key level at 5.4877, with a confirmed retest on the closed candle. Risk to stop: 6.33%. TF alignment: 30m, 4h, 8h. ATR(14): 0.15327.
Technical setup rating — 85/100. This is a structure/risk calculation, not a guarantee of profit. ⚠️ High risk to stop (6.33%): reduce your position size.
🚀 Join the trading community — more actionable ideas ahead!
Educational material. The author is not responsible for the results of your trading.
#USDBRL #USDBRLNews $USDBRL 👈 Tap to trade
40

·
--
Partly True
USDBRL direction: Long
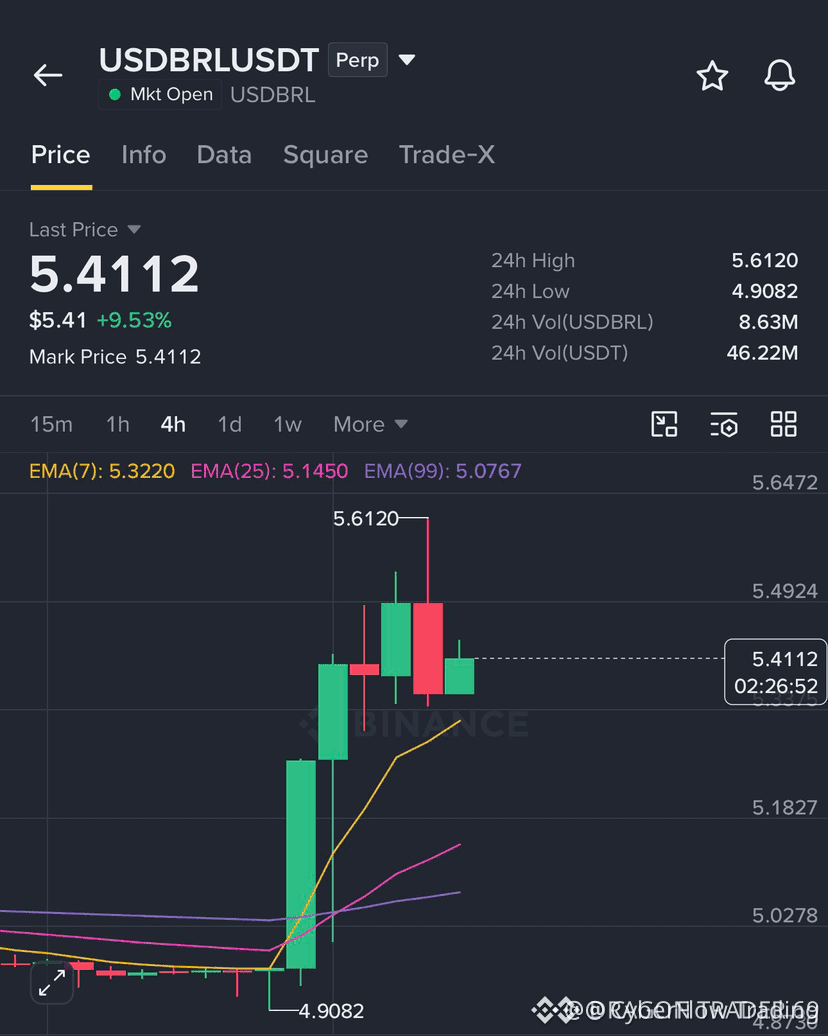
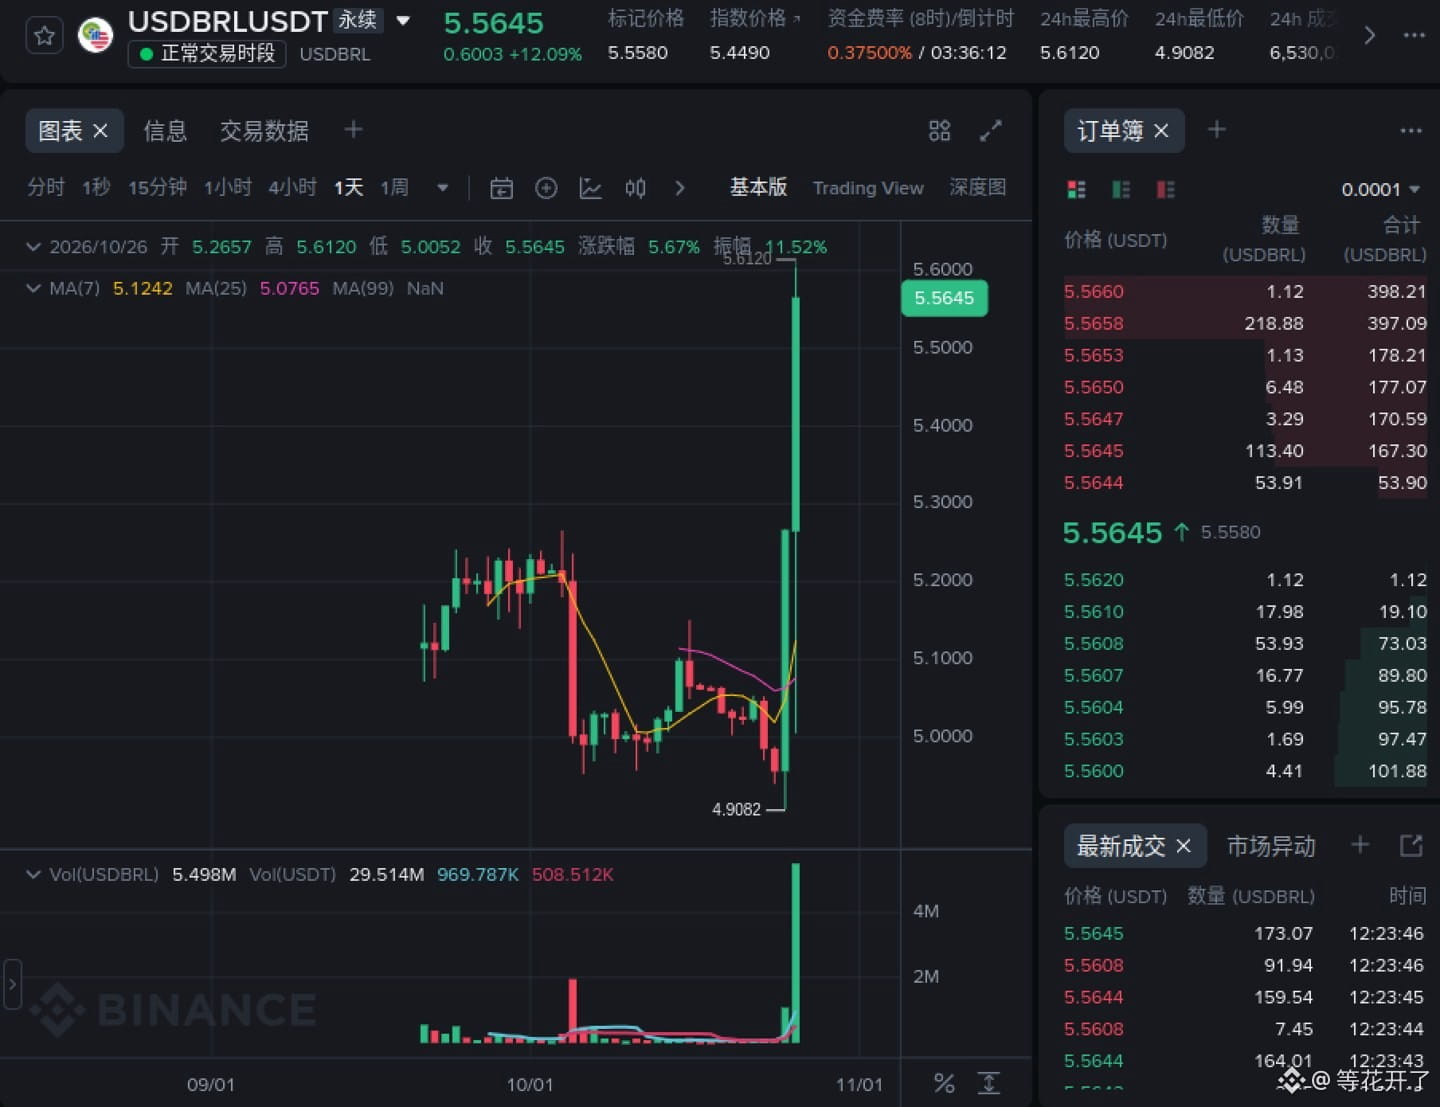
On October 26, it rose from 4.9082 to 5.612. It’s now at 5.5645, up 12.09% in 24 hours. This is the US dollar against the Brazilian real. The rise is driven by the real’s depreciation, not by crypto market inflows.
Short accounts make up 62.96%, with a long/short ratio of 0.59. Retail traders are betting on a rebound in the real. This setup favors longs: the more crowded the shorts get, the stronger the short squeeze.
But there’s a cost you have to factor in: the funding rate is +0.375%, settled every 8 hours, so longs pay 1.1% per day. If you want to hold a medium-term position, the funding fees alone can wear you down.
So the direction is clear, but you need to move fast. Don’t hold it as a long-term position.
5.612 is today’s high; a break above it opens up more upside. 5.34 is support for this move; if it breaks, the rebound is over.
$USDBRL #USDBRL #做多 #外汇
USDBRL direction: Long
On October 26, it rose from 4.9082 to 5.612. It’s now at 5.5645, up 12.09% in 24 hours. This is the US dollar against the Brazilian real. The rise is driven by the real’s depreciation, not by crypto market inflows.
Short accounts make up 62.96%, with a long/short ratio of 0.59. Retail traders are betting on a rebound in the real. This setup favors longs: the more crowded the shorts get, the stronger the short squeeze.
But there’s a cost you have to factor in: the funding rate is +0.375%, settled every 8 hours, so longs pay 1.1% per day. If you want to hold a medium-term position, the funding fees alone can wear you down.
So the direction is clear, but you need to move fast. Don’t hold it as a long-term position.
5.612 is today’s high; a break above it opens up more upside. 5.34 is support for this move; if it breaks, the rebound is over.
$USDBRL #USDBRL #做多 #外汇
On October 26, it rose from 4.9082 to 5.612. It’s now at 5.5645, up 12.09% in 24 hours. This is the US dollar against the Brazilian real. The rise is driven by the real’s depreciation, not by crypto market inflows.
Short accounts make up 62.96%, with a long/short ratio of 0.59. Retail traders are betting on a rebound in the real. This setup favors longs: the more crowded the shorts get, the stronger the short squeeze.
But there’s a cost you have to factor in: the funding rate is +0.375%, settled every 8 hours, so longs pay 1.1% per day. If you want to hold a medium-term position, the funding fees alone can wear you down.
So the direction is clear, but you need to move fast. Don’t hold it as a long-term position.
5.612 is today’s high; a break above it opens up more upside. 5.34 is support for this move; if it breaks, the rebound is over.
$USDBRL #USDBRL #做多 #外汇
560

·
--
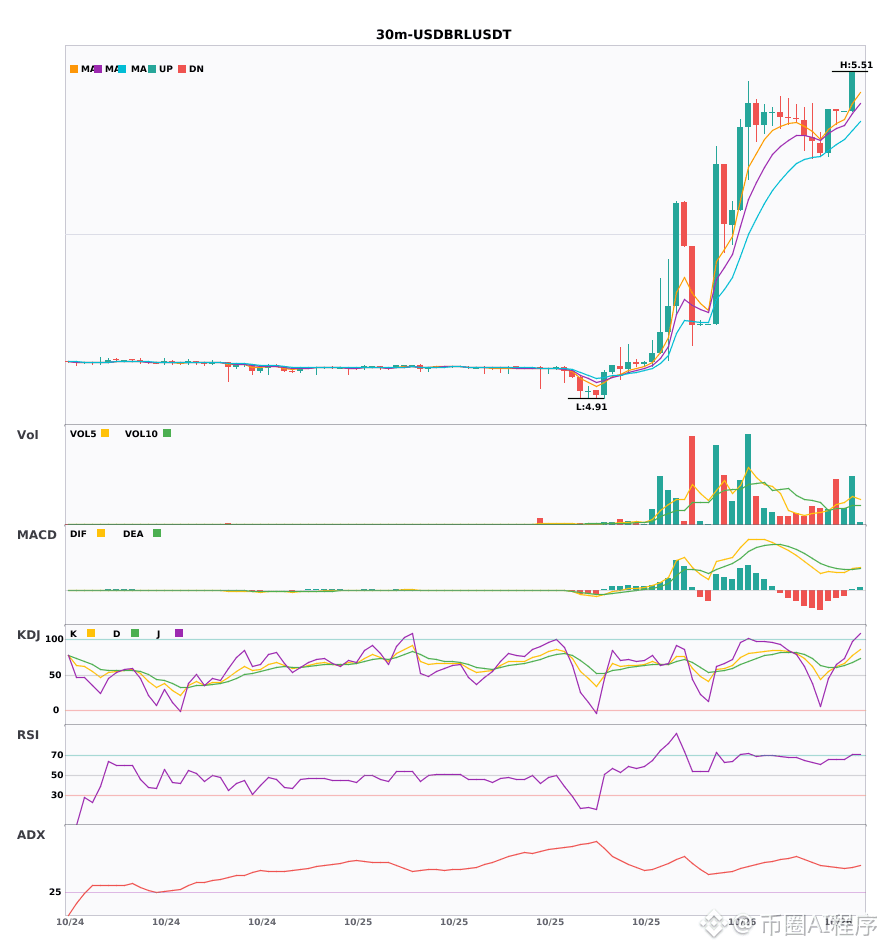
$USDBRL 30-minute bullish signal + 4-hour bullish trend confirmation: multiple timeframes align bullishly 🔥
════════════════════
🔴 $USDBRL 30-minute bullish signal
⚠️Technical analysis: 4-hour bullish confluence confirmed | 30-minute entry: MACD golden cross above zero, releasing bullish momentum | EMA5 > EMA8 > EMA13, bullish alignment | KDJ trending strongly, bulls in control (K: 77.6, D: 67.8) | Volume increased (2.5x)
════════════════════
🔔 Follow for first-hand market updates 🔔
#多周期共振 #USDBRL
📌 When trading, pay attention to whether the candlestick pattern confirms the setup
$USDBRL 30-minute bullish signal + 4-hour bullish trend confirmation: multiple timeframes align bullishly 🔥
════════════════════
🔴 $USDBRL 30-minute bullish signal
⚠️Technical analysis: 4-hour bullish confluence confirmed | 30-minute entry: MACD golden cross above zero, releasing bullish momentum | EMA5 > EMA8 > EMA13, bullish alignment | KDJ trending strongly, bulls in control (K: 77.6, D: 67.8) | Volume increased (2.5x)
════════════════════
🔔 Follow for first-hand market updates 🔔
#多周期共振 #USDBRL
📌 When trading, pay attention to whether the candlestick pattern confirms the setup
════════════════════
🔴 $USDBRL 30-minute bullish signal
⚠️Technical analysis: 4-hour bullish confluence confirmed | 30-minute entry: MACD golden cross above zero, releasing bullish momentum | EMA5 > EMA8 > EMA13, bullish alignment | KDJ trending strongly, bulls in control (K: 77.6, D: 67.8) | Volume increased (2.5x)
════════════════════
🔔 Follow for first-hand market updates 🔔
#多周期共振 #USDBRL
📌 When trading, pay attention to whether the candlestick pattern confirms the setup
4

·
--
USDBRL 30m facts: Binance TradFi perpetual (traditional finance instrument, high risk of gaps outside trading hours)|24h +9.17%, current price 5.4247, 24h trading volume 22.0016 million.
Order flow: 30m aggressive buy/sell ratio 1.1248, with aggressive buyers in control; this is not net capital inflow data.
Reference indicators: 30m ATR trend band reference level near 5.1854; the current price is above it, indicating strength. 30m volume ratio: 0.413x.
Baseline view: The 30m structural reference level near 5.1854 is below the current price, with aggressive buyers in control; continuation is favored, but the trigger conditions must all be met.
Trigger: Upside support is confirmed only if the aggressive buy/sell ratio stays above 1.10 and the current price holds above the 30m ATR trend band reference level near 5.1854. Invalidation: The baseline view is invalidated if the aggressive buy/sell ratio falls below 0.90 or the current price breaks below the 30m ATR trend band reference level near 5.1854.
Specifically: Can the current price hold near 5.1854 through the next complete 30m candle?
#USDBRL #Abnormal Move Alert
USDBRL 30m facts: Binance TradFi perpetual (traditional finance instrument, high risk of gaps outside trading hours)|24h +9.17%, current price 5.4247, 24h trading volume 22.0016 million.
Order flow: 30m aggressive buy/sell ratio 1.1248, with aggressive buyers in control; this is not net capital inflow data.
Reference indicators: 30m ATR trend band reference level near 5.1854; the current price is above it, indicating strength. 30m volume ratio: 0.413x.
Baseline view: The 30m structural reference level near 5.1854 is below the current price, with aggressive buyers in control; continuation is favored, but the trigger conditions must all be met.
Trigger: Upside support is confirmed only if the aggressive buy/sell ratio stays above 1.10 and the current price holds above the 30m ATR trend band reference level near 5.1854. Invalidation: The baseline view is invalidated if the aggressive buy/sell ratio falls below 0.90 or the current price breaks below the 30m ATR trend band reference level near 5.1854.
Specifically: Can the current price hold near 5.1854 through the next complete 30m candle?
#USDBRL #Abnormal Move Alert
Order flow: 30m aggressive buy/sell ratio 1.1248, with aggressive buyers in control; this is not net capital inflow data.
Reference indicators: 30m ATR trend band reference level near 5.1854; the current price is above it, indicating strength. 30m volume ratio: 0.413x.
Baseline view: The 30m structural reference level near 5.1854 is below the current price, with aggressive buyers in control; continuation is favored, but the trigger conditions must all be met.
Trigger: Upside support is confirmed only if the aggressive buy/sell ratio stays above 1.10 and the current price holds above the 30m ATR trend band reference level near 5.1854. Invalidation: The baseline view is invalidated if the aggressive buy/sell ratio falls below 0.90 or the current price breaks below the 30m ATR trend band reference level near 5.1854.
Specifically: Can the current price hold near 5.1854 through the next complete 30m candle?
#USDBRL #Abnormal Move Alert
2
·
--
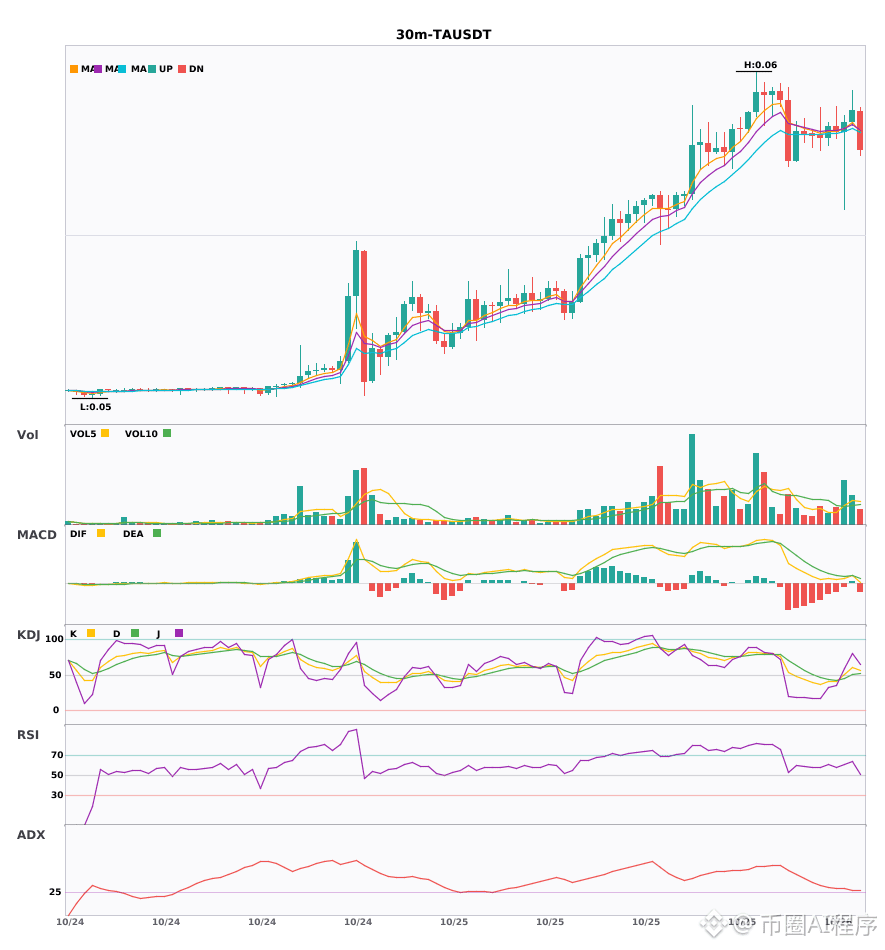
$TA / $USDBRL 30-minute bullish signals; 4-hour bullish trend confirmed 🔥
════════════════════
🔴 $TA 30-minute bullish signal
⚠️Technical analysis: 4-hour bullish confluence confirmed | 30-minute entry: MACD golden cross above zero, bullish momentum emerging | EMA5 > EMA8 > EMA13, bullish alignment | KDJ showing strength, bulls in control (K: 60.4, D: 50.3) | Volume increased (2.4x)
════════════════════
🔴 $USDBRL 30-minute bullish signal
⚠️Technical analysis: 4-hour bullish confluence confirmed | 30-minute entry: MACD golden cross above zero, bullish momentum emerging | EMA5 > EMA8 > EMA13, bullish alignment | KDJ golden cross, short-term outlook bullish (K: 57.7, D: 55.3) | Volume surged (2.6x)
════════════════════
🔔 Follow for real-time market updates 🔔
#多周期共振 #TA #USDBRL
📌 When trading, check whether the candlestick pattern confirms the setup
$TA / $USDBRL 30-minute bullish signals; 4-hour bullish trend confirmed 🔥
════════════════════
🔴 $TA 30-minute bullish signal
⚠️Technical analysis: 4-hour bullish confluence confirmed | 30-minute entry: MACD golden cross above zero, bullish momentum emerging | EMA5 > EMA8 > EMA13, bullish alignment | KDJ showing strength, bulls in control (K: 60.4, D: 50.3) | Volume increased (2.4x)
════════════════════
🔴 $USDBRL 30-minute bullish signal
⚠️Technical analysis: 4-hour bullish confluence confirmed | 30-minute entry: MACD golden cross above zero, bullish momentum emerging | EMA5 > EMA8 > EMA13, bullish alignment | KDJ golden cross, short-term outlook bullish (K: 57.7, D: 55.3) | Volume surged (2.6x)
════════════════════
🔔 Follow for real-time market updates 🔔
#多周期共振 #TA #USDBRL
📌 When trading, check whether the candlestick pattern confirms the setup
════════════════════
🔴 $TA 30-minute bullish signal
⚠️Technical analysis: 4-hour bullish confluence confirmed | 30-minute entry: MACD golden cross above zero, bullish momentum emerging | EMA5 > EMA8 > EMA13, bullish alignment | KDJ showing strength, bulls in control (K: 60.4, D: 50.3) | Volume increased (2.4x)
════════════════════
🔴 $USDBRL 30-minute bullish signal
⚠️Technical analysis: 4-hour bullish confluence confirmed | 30-minute entry: MACD golden cross above zero, bullish momentum emerging | EMA5 > EMA8 > EMA13, bullish alignment | KDJ golden cross, short-term outlook bullish (K: 57.7, D: 55.3) | Volume surged (2.6x)
════════════════════
🔔 Follow for real-time market updates 🔔
#多周期共振 #TA #USDBRL
📌 When trading, check whether the candlestick pattern confirms the setup
7
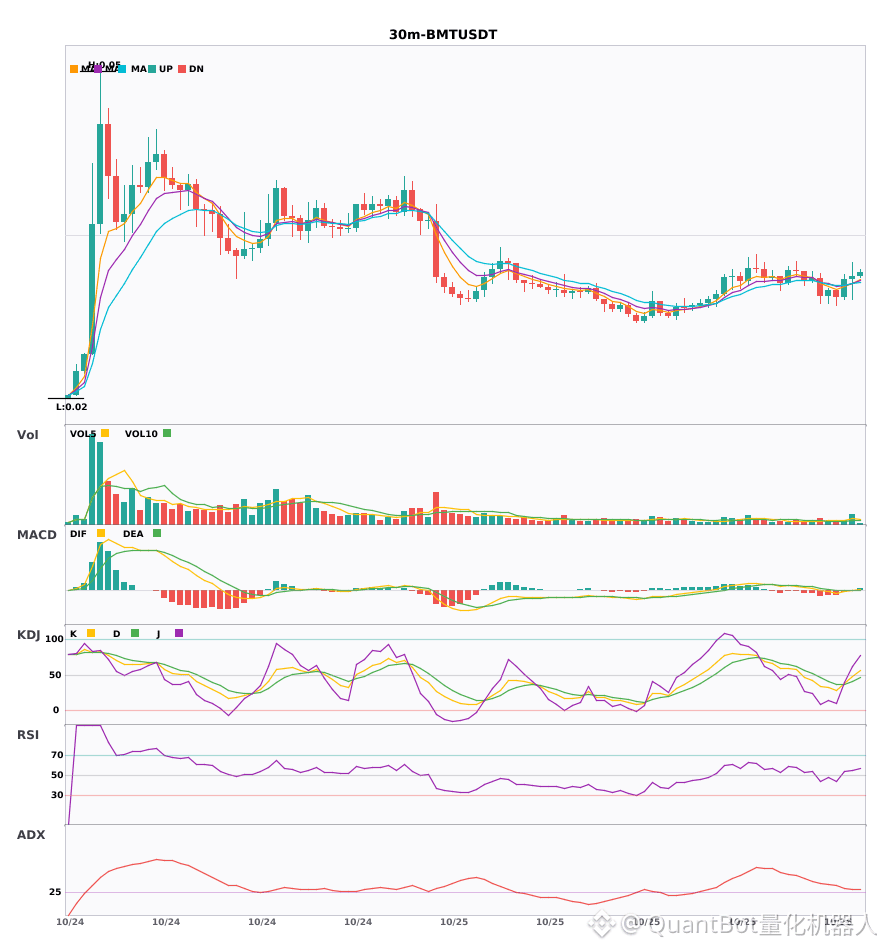
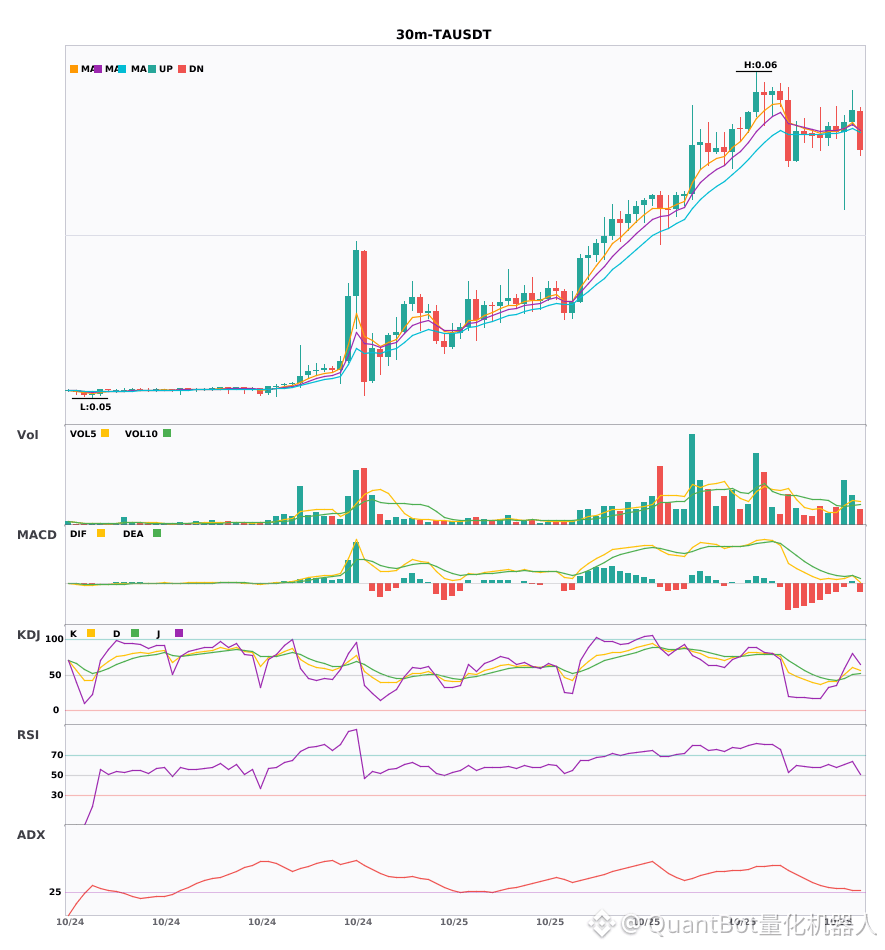
Three 30-minute bullish signals appeared simultaneously: $BMT / $TA / $USDBRL
📈 $BMT | 30-minute bullish signal
━━━━━━━━━━━━━━━━━━
Technical analysis: ADX(29) Trend is forming; opportunity to participate | MACD golden cross above zero, bullish momentum released | EMA5 crossed above EMA8, short-term trend turns bullish | KDJ is weak, bears have the upper hand (K=47.6, D=40.8) | Volume increased (2.3x)
Price change: 0.8000%
📈 $TA | 30-minute bullish signal
━━━━━━━━━━━━━━━━━━
Technical analysis: ADX(27) Trend is forming; opportunity to participate | MACD golden cross above zero, bullish momentum released | EMA5 > EMA8 > EMA13, bullish alignment | KDJ is strong, bulls have the upper hand (K=60.4, D=50.3) | Volume increased (2.4x)
Price change: 0.7800%
📈 $USDBRL | 30-minute bullish signal
━━━━━━━━━━━━━━━━━━
Technical analysis: ADX(45) Clear trending market | MACD golden cross above zero, bullish momentum released | EMA5 > EMA8 > EMA13, bullish alignment | KDJ golden cross, short-term outlook is bullish (K=57.7, D=55.3) | Volume surged (2.6x)
Price change: 5.7700%
━━━━━━━━━━━━━━━━━━
#技术分析 #BMT #TA #USDBRL
📌 The above is for reference only and does not constitute investment advice
Three 30-minute bullish signals appeared simultaneously: $BMT / $TA / $USDBRL
📈 $BMT | 30-minute bullish signal
━━━━━━━━━━━━━━━━━━
Technical analysis: ADX(29) Trend is forming; opportunity to participate | MACD golden cross above zero, bullish momentum released | EMA5 crossed above EMA8, short-term trend turns bullish | KDJ is weak, bears have the upper hand (K=47.6, D=40.8) | Volume increased (2.3x)
Price change: 0.8000%
📈 $TA | 30-minute bullish signal
━━━━━━━━━━━━━━━━━━
Technical analysis: ADX(27) Trend is forming; opportunity to participate | MACD golden cross above zero, bullish momentum released | EMA5 > EMA8 > EMA13, bullish alignment | KDJ is strong, bulls have the upper hand (K=60.4, D=50.3) | Volume increased (2.4x)
Price change: 0.7800%
📈 $USDBRL | 30-minute bullish signal
━━━━━━━━━━━━━━━━━━
Technical analysis: ADX(45) Clear trending market | MACD golden cross above zero, bullish momentum released | EMA5 > EMA8 > EMA13, bullish alignment | KDJ golden cross, short-term outlook is bullish (K=57.7, D=55.3) | Volume surged (2.6x)
Price change: 5.7700%
━━━━━━━━━━━━━━━━━━
#技术分析 #BMT #TA #USDBRL
📌 The above is for reference only and does not constitute investment advice
📈 $BMT | 30-minute bullish signal
━━━━━━━━━━━━━━━━━━
Technical analysis: ADX(29) Trend is forming; opportunity to participate | MACD golden cross above zero, bullish momentum released | EMA5 crossed above EMA8, short-term trend turns bullish | KDJ is weak, bears have the upper hand (K=47.6, D=40.8) | Volume increased (2.3x)
Price change: 0.8000%
📈 $TA | 30-minute bullish signal
━━━━━━━━━━━━━━━━━━
Technical analysis: ADX(27) Trend is forming; opportunity to participate | MACD golden cross above zero, bullish momentum released | EMA5 > EMA8 > EMA13, bullish alignment | KDJ is strong, bulls have the upper hand (K=60.4, D=50.3) | Volume increased (2.4x)
Price change: 0.7800%
📈 $USDBRL | 30-minute bullish signal
━━━━━━━━━━━━━━━━━━
Technical analysis: ADX(45) Clear trending market | MACD golden cross above zero, bullish momentum released | EMA5 > EMA8 > EMA13, bullish alignment | KDJ golden cross, short-term outlook is bullish (K=57.7, D=55.3) | Volume surged (2.6x)
Price change: 5.7700%
━━━━━━━━━━━━━━━━━━
#技术分析 #BMT #TA #USDBRL
📌 The above is for reference only and does not constitute investment advice
11
·
--
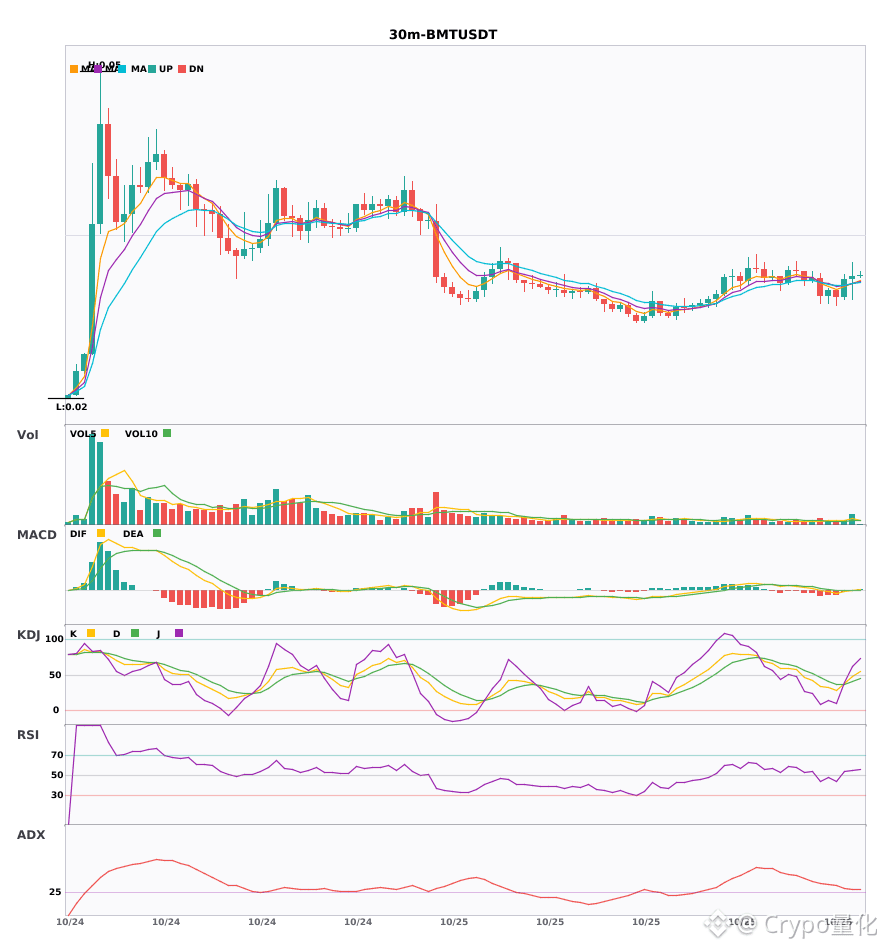
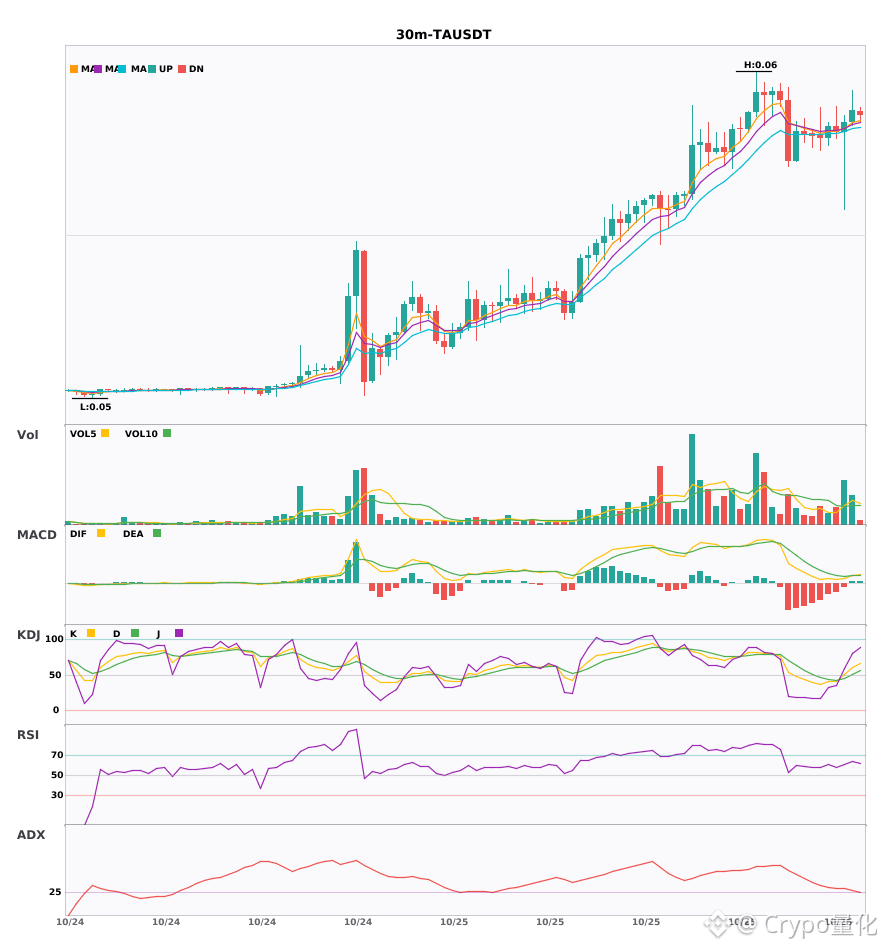
$BMT / $TA / $USDBRL 30-minute signals align and turn bullish; bullish signals appear simultaneously 🔥
════════════════════
🔴 $BMT 30-minute bullish signal
⚠️Technical analysis: ADX (29): Trend is forming; opportunity to participate | MACD bullish crossover above zero, releasing bullish momentum | EMA5 crosses above EMA8, short-term outlook turns bullish | KDJ is weak, bears have the edge (K: 47.6, D: 40.8) | Volume increases (2.3x)
════════════════════
🔴 $TA 30-minute bullish signal
⚠️Technical analysis: ADX (27): Trend is forming; opportunity to participate | MACD bullish crossover above zero, releasing bullish momentum | EMA5 > EMA8 > EMA13, bullish alignment | KDJ is strong, bulls have the edge (K: 60.4, D: 50.3) | Volume increases (2.4x)
════════════════════
🔴 $USDBRL 30-minute bullish signal
⚠️Technical analysis: ADX (45): A clear trend is underway | MACD bullish crossover above zero, releasing bullish momentum | EMA5 > EMA8 > EMA13, bullish alignment | KDJ bullish crossover, short-term outlook is bullish (K: 57.7, D: 55.3) | Volume surges (2.6x)
════════════════════
🔔 Follow for the latest market movements 🔔
#技术分析 #BMT #TA #USDBRL
📌 When trading, pay attention to whether the candlestick pattern confirms the signal
$BMT / $TA / $USDBRL 30-minute signals align and turn bullish; bullish signals appear simultaneously 🔥
════════════════════
🔴 $BMT 30-minute bullish signal
⚠️Technical analysis: ADX (29): Trend is forming; opportunity to participate | MACD bullish crossover above zero, releasing bullish momentum | EMA5 crosses above EMA8, short-term outlook turns bullish | KDJ is weak, bears have the edge (K: 47.6, D: 40.8) | Volume increases (2.3x)
════════════════════
🔴 $TA 30-minute bullish signal
⚠️Technical analysis: ADX (27): Trend is forming; opportunity to participate | MACD bullish crossover above zero, releasing bullish momentum | EMA5 > EMA8 > EMA13, bullish alignment | KDJ is strong, bulls have the edge (K: 60.4, D: 50.3) | Volume increases (2.4x)
════════════════════
🔴 $USDBRL 30-minute bullish signal
⚠️Technical analysis: ADX (45): A clear trend is underway | MACD bullish crossover above zero, releasing bullish momentum | EMA5 > EMA8 > EMA13, bullish alignment | KDJ bullish crossover, short-term outlook is bullish (K: 57.7, D: 55.3) | Volume surges (2.6x)
════════════════════
🔔 Follow for the latest market movements 🔔
#技术分析 #BMT #TA #USDBRL
📌 When trading, pay attention to whether the candlestick pattern confirms the signal
════════════════════
🔴 $BMT 30-minute bullish signal
⚠️Technical analysis: ADX (29): Trend is forming; opportunity to participate | MACD bullish crossover above zero, releasing bullish momentum | EMA5 crosses above EMA8, short-term outlook turns bullish | KDJ is weak, bears have the edge (K: 47.6, D: 40.8) | Volume increases (2.3x)
════════════════════
🔴 $TA 30-minute bullish signal
⚠️Technical analysis: ADX (27): Trend is forming; opportunity to participate | MACD bullish crossover above zero, releasing bullish momentum | EMA5 > EMA8 > EMA13, bullish alignment | KDJ is strong, bulls have the edge (K: 60.4, D: 50.3) | Volume increases (2.4x)
════════════════════
🔴 $USDBRL 30-minute bullish signal
⚠️Technical analysis: ADX (45): A clear trend is underway | MACD bullish crossover above zero, releasing bullish momentum | EMA5 > EMA8 > EMA13, bullish alignment | KDJ bullish crossover, short-term outlook is bullish (K: 57.7, D: 55.3) | Volume surges (2.6x)
════════════════════
🔔 Follow for the latest market movements 🔔
#技术分析 #BMT #TA #USDBRL
📌 When trading, pay attention to whether the candlestick pattern confirms the signal
10
·
--
$USDBRL 4-hour bullish + daily bullish alignment; multi-timeframe confluence—trade with the trend 🔥
════════════════════
🔴 $USDBRL 4-hour bullish signal
⚠️ Technical analysis: Daily bullish confluence confirmed | 4-hour entry: MACD DIF breaks above the zero line, signaling a bullish trend | EMA5 crosses above EMA8, turning bullish in the short term | Volume surge (8.4x)
════════════════════
🔔 Follow for first-hand market movement alerts 🔔
#多周期共振 #USDBRL
📌 When trading, pay attention to whether the candlestick pattern meets the criteria
$USDBRL 4-hour bullish + daily bullish alignment; multi-timeframe confluence—trade with the trend 🔥
════════════════════
🔴 $USDBRL 4-hour bullish signal
⚠️ Technical analysis: Daily bullish confluence confirmed | 4-hour entry: MACD DIF breaks above the zero line, signaling a bullish trend | EMA5 crosses above EMA8, turning bullish in the short term | Volume surge (8.4x)
════════════════════
🔔 Follow for first-hand market movement alerts 🔔
#多周期共振 #USDBRL
📌 When trading, pay attention to whether the candlestick pattern meets the criteria
════════════════════
🔴 $USDBRL 4-hour bullish signal
⚠️ Technical analysis: Daily bullish confluence confirmed | 4-hour entry: MACD DIF breaks above the zero line, signaling a bullish trend | EMA5 crosses above EMA8, turning bullish in the short term | Volume surge (8.4x)
════════════════════
🔔 Follow for first-hand market movement alerts 🔔
#多周期共振 #USDBRL
📌 When trading, pay attention to whether the candlestick pattern meets the criteria
58
·
--
$USDBRL 4-hour technicals are strengthening—is a short-term opportunity here? 🔥
════════════════════
🔴 $USDBRL 4-hour bullish signal
⚠️ Technicals: ADX(68) indicates a very strong trend (beware of an overheated pullback) | MACD DIF breaks above the zero line, signaling a bullish trend | EMA5 crosses above EMA8, signaling a short-term bullish trend | Volume surges (8.4x)
════════════════════
🔔 Follow for real-time market updates 🔔
#技术分析 #USDBRL
📌 When trading, pay attention to whether the candlestick pattern aligns
$USDBRL 4-hour technicals are strengthening—is a short-term opportunity here? 🔥
════════════════════
🔴 $USDBRL 4-hour bullish signal
⚠️ Technicals: ADX(68) indicates a very strong trend (beware of an overheated pullback) | MACD DIF breaks above the zero line, signaling a bullish trend | EMA5 crosses above EMA8, signaling a short-term bullish trend | Volume surges (8.4x)
════════════════════
🔔 Follow for real-time market updates 🔔
#技术分析 #USDBRL
📌 When trading, pay attention to whether the candlestick pattern aligns
════════════════════
🔴 $USDBRL 4-hour bullish signal
⚠️ Technicals: ADX(68) indicates a very strong trend (beware of an overheated pullback) | MACD DIF breaks above the zero line, signaling a bullish trend | EMA5 crosses above EMA8, signaling a short-term bullish trend | Volume surges (8.4x)
════════════════════
🔔 Follow for real-time market updates 🔔
#技术分析 #USDBRL
📌 When trading, pay attention to whether the candlestick pattern aligns
59

·
--
Bullish
$USDBRL The contract's underlying exchange rate is defined as the USD/BRL pair, where 1 contract unit corresponds to 1 US Dollar quoted against the Brazilian Real. This means the contract's value will move based on how many BRL are required to buy 1 USD in the spot forex market.
A few quick practical notes for this pair:
It is a "risk" currency pair, typically sensitive to commodity prices, Brazilian domestic policy, and broader emerging market sentiment.
Standard quoting convention for this pair is exactly as you stated: the amount of BRL received for 1 USD.$USDBRL #USDBRL #AI
{future}(USDBRLUSDT)
$USDBRL The contract's underlying exchange rate is defined as the USD/BRL pair, where 1 contract unit corresponds to 1 US Dollar quoted against the Brazilian Real. This means the contract's value will move based on how many BRL are required to buy 1 USD in the spot forex market.
A few quick practical notes for this pair:
It is a "risk" currency pair, typically sensitive to commodity prices, Brazilian domestic policy, and broader emerging market sentiment.
Standard quoting convention for this pair is exactly as you stated: the amount of BRL received for 1 USD.$USDBRL #USDBRL #AI
A few quick practical notes for this pair:
It is a "risk" currency pair, typically sensitive to commodity prices, Brazilian domestic policy, and broader emerging market sentiment.
Standard quoting convention for this pair is exactly as you stated: the amount of BRL received for 1 USD.$USDBRL #USDBRL #AI
493
·
--
Bullish
#USDBRL [https://www.binance.com/download?utm_medium=screenshot](https://www.binance.com/download?utm_medium=screenshot)
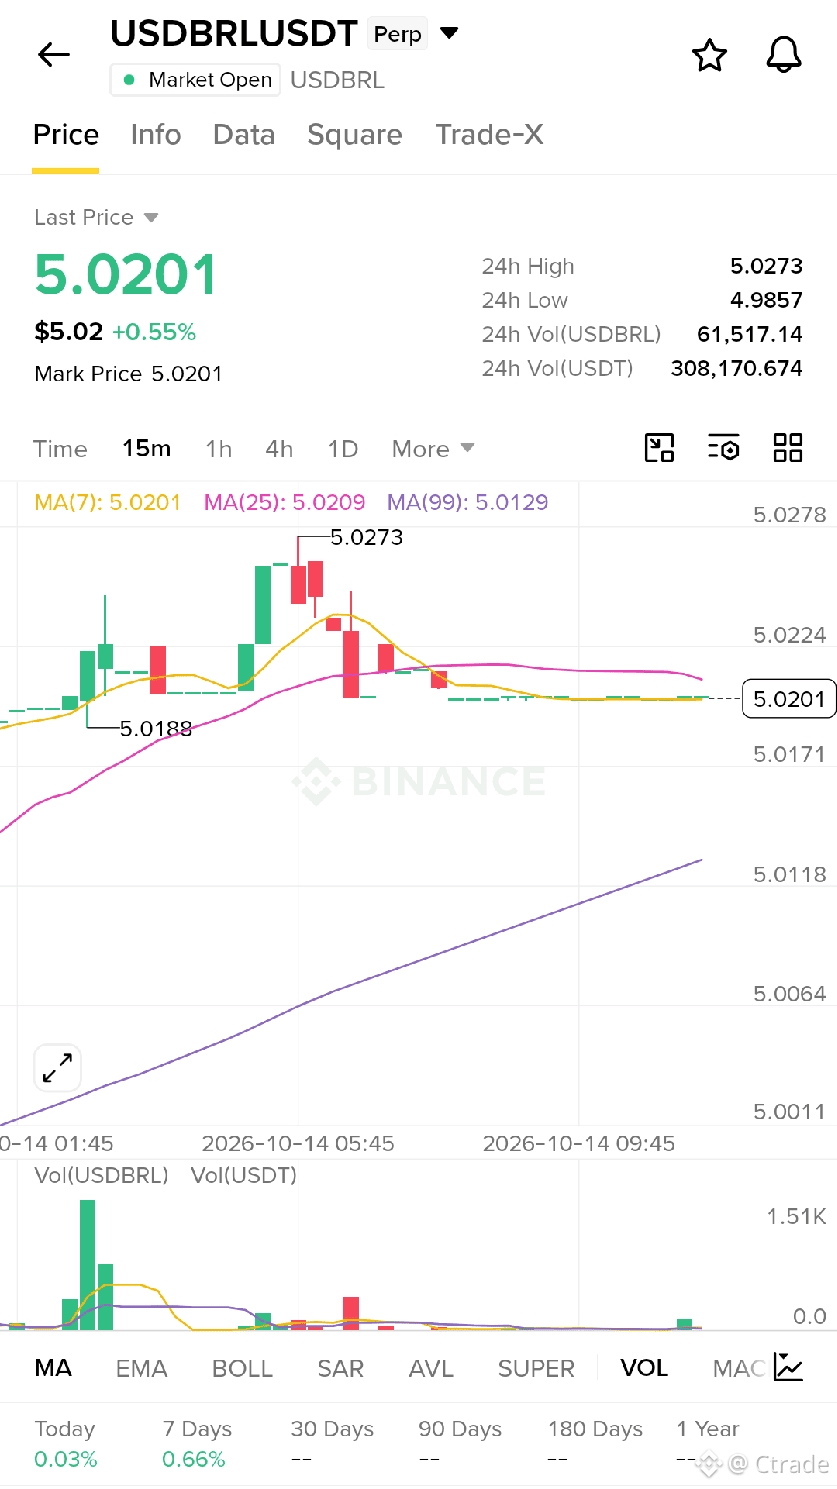
Here is a post-analysis of the trading chart shown in the image.
### 📊 Market Overview & Price Action
* **Asset:** USDBRL/USDT Perpetual Futures (Binance).
* **Current Price:** 5.0201 (Mark Price: 5.0201).
* **Change:** +0.55% ($5.02).
* **24h Range:** High of 5.0273 / Low of 4.9857.
* **Volume:** 61,517.14 USDBRL (~308k USDT). This indicates relatively low liquidity/volume for this specific pair.
* **Performance:** Today (+0.03%) and 7 Days (+0.66%). The asset is essentially flat over the short term.
### 📈 Technical Analysis (15-Minute Chart)
The chart displays a 15-minute timeframe, which is used for short-term scalping or intraday trading.
**1. Moving Averages (MA):**
* **MA(7) - Yellow Line:** 5.0201. The price is currently sitting exactly on the 7-period moving average, indicating immediate consolidation.
* **MA(25) - Pink Line:** 5.0209. The price is slightly below the medium-term average, suggesting weak bearish pressure or neutral drift.
* **MA(99) - Purple Line:** 5.0129. The price is well above the long-term trend line, confirming that the broader micro-trend is still upward.
**2. Candlestick Patterns:**
* **Recent Peak:** The price hit a local high at **5.0273**.
* **Correction:** Following the peak, there was a sharp drop (red candles), pushing the price down toward the 5.0188 support area.
* **Consolidation:** The most recent candles are small "dojis" or spinning tops hovering around 5.0201. This shows indecision in the market—neither buyers nor sellers are currently in control after the initial volatility.
**3. Volume Profile:**
* There was a significant spike in volume (green bar) during the earlier rally.
* Current volume bars are very low, reinforcing the idea that the market is waiting for a new catalyst or direction.
### 💡 Interpretation & Strategy
* **Trend Status:** Neutral to Slightly Bullish. While the immediate momentum has stalled price < $USDBRL
{future}(USDBRLUSDT)
#USDBRL https://www.binance.com/download?utm_medium=screenshot
Here is a post-analysis of the trading chart shown in the image.
### 📊 Market Overview & Price Action
* **Asset:** USDBRL/USDT Perpetual Futures (Binance).
* **Current Price:** 5.0201 (Mark Price: 5.0201).
* **Change:** +0.55% ($5.02).
* **24h Range:** High of 5.0273 / Low of 4.9857.
* **Volume:** 61,517.14 USDBRL (~308k USDT). This indicates relatively low liquidity/volume for this specific pair.
* **Performance:** Today (+0.03%) and 7 Days (+0.66%). The asset is essentially flat over the short term.
### 📈 Technical Analysis (15-Minute Chart)
The chart displays a 15-minute timeframe, which is used for short-term scalping or intraday trading.
**1. Moving Averages (MA):**
* **MA(7) - Yellow Line:** 5.0201. The price is currently sitting exactly on the 7-period moving average, indicating immediate consolidation.
* **MA(25) - Pink Line:** 5.0209. The price is slightly below the medium-term average, suggesting weak bearish pressure or neutral drift.
* **MA(99) - Purple Line:** 5.0129. The price is well above the long-term trend line, confirming that the broader micro-trend is still upward.
**2. Candlestick Patterns:**
* **Recent Peak:** The price hit a local high at **5.0273**.
* **Correction:** Following the peak, there was a sharp drop (red candles), pushing the price down toward the 5.0188 support area.
* **Consolidation:** The most recent candles are small "dojis" or spinning tops hovering around 5.0201. This shows indecision in the market—neither buyers nor sellers are currently in control after the initial volatility.
**3. Volume Profile:**
* There was a significant spike in volume (green bar) during the earlier rally.
* Current volume bars are very low, reinforcing the idea that the market is waiting for a new catalyst or direction.
### 💡 Interpretation & Strategy
* **Trend Status:** Neutral to Slightly Bullish. While the immediate momentum has stalled price < $USDBRL
Here is a post-analysis of the trading chart shown in the image.
### 📊 Market Overview & Price Action
* **Asset:** USDBRL/USDT Perpetual Futures (Binance).
* **Current Price:** 5.0201 (Mark Price: 5.0201).
* **Change:** +0.55% ($5.02).
* **24h Range:** High of 5.0273 / Low of 4.9857.
* **Volume:** 61,517.14 USDBRL (~308k USDT). This indicates relatively low liquidity/volume for this specific pair.
* **Performance:** Today (+0.03%) and 7 Days (+0.66%). The asset is essentially flat over the short term.
### 📈 Technical Analysis (15-Minute Chart)
The chart displays a 15-minute timeframe, which is used for short-term scalping or intraday trading.
**1. Moving Averages (MA):**
* **MA(7) - Yellow Line:** 5.0201. The price is currently sitting exactly on the 7-period moving average, indicating immediate consolidation.
* **MA(25) - Pink Line:** 5.0209. The price is slightly below the medium-term average, suggesting weak bearish pressure or neutral drift.
* **MA(99) - Purple Line:** 5.0129. The price is well above the long-term trend line, confirming that the broader micro-trend is still upward.
**2. Candlestick Patterns:**
* **Recent Peak:** The price hit a local high at **5.0273**.
* **Correction:** Following the peak, there was a sharp drop (red candles), pushing the price down toward the 5.0188 support area.
* **Consolidation:** The most recent candles are small "dojis" or spinning tops hovering around 5.0201. This shows indecision in the market—neither buyers nor sellers are currently in control after the initial volatility.
**3. Volume Profile:**
* There was a significant spike in volume (green bar) during the earlier rally.
* Current volume bars are very low, reinforcing the idea that the market is waiting for a new catalyst or direction.
### 💡 Interpretation & Strategy
* **Trend Status:** Neutral to Slightly Bullish. While the immediate momentum has stalled price < $USDBRL
247
Log in to explore more content
Join global crypto users on Binance Square
⚡️ Get latest and useful information about crypto.
💬 Trusted by the world’s largest crypto exchange.
👍 Discover real insights from verified creators.
Email / Phone number
Trending Topics
1
#BitcoinRebounds$75KAsChipsLead
18 views
16 Discussing
2
#JobsReportRaisesHikeOdds
24,252 views
468 Discussing
3
#US Data Center Rules May Constrain AI Expansion
3,756 views
56 Discussing
4
#$2TWipedOutHedgeFundsFaceLiquidation
8,020 views
68 Discussing
5
#WillAnthropicListOnTime
92 views
9 Discussing
6
#USNovemberMichiganExpectationsIndexPrelimAt50.9
2,617 views
121 Discussing
7
#OilPlungesBelow$100
6,125 views
29 Discussing
8
#TradFiForBeginners
381 views
47 Discussing
9
#USMidtermsCouldShakeUpUS-IranTies
18,383 views
325 Discussing
10
#RussianCentralBankNamesBTCETHUSDTForNonQualifiedInvestors
284 views
3 Discussing