
#twt.
twt.
52,023 views
44 Discussing
Hot
Latest

$TWT is showing a short-term bullish recovery. As of September 1, 2026, TWT is around $0.52, with the 24-hour range near $0.46–$0.52 and market cap around $216M.
🟢 Current price: ~$0.52
📈 24h momentum: Positive, with strong buying activity
🎯 Resistance: ~$0.53, then ~$0.60
🛡️ Support: ~$0.46–$0.48
🔥 Trend: Bullish above $0.48; a clean breakout above $0.53 could strengthen the move.
⚠️ Risk: A drop below $0.46 could bring renewed selling pressure.
Overall: TWT looks cautiously bullish in the short term, but traders should watch the $0.53 breakout level and Bitcoin’s broader market direction. Trust Wallet’s continued ecosystem development remains an important fundamental factor.
#TWT #TWTUSDT #TWT/USDT #TWT. #SaylorHintsStrategyBitcoinBuy
🟢 Current price: ~$0.52
📈 24h momentum: Positive, with strong buying activity
🎯 Resistance: ~$0.53, then ~$0.60
🛡️ Support: ~$0.46–$0.48
🔥 Trend: Bullish above $0.48; a clean breakout above $0.53 could strengthen the move.
⚠️ Risk: A drop below $0.46 could bring renewed selling pressure.
Overall: TWT looks cautiously bullish in the short term, but traders should watch the $0.53 breakout level and Bitcoin’s broader market direction. Trust Wallet’s continued ecosystem development remains an important fundamental factor.
#TWT #TWTUSDT #TWT/USDT #TWT. #SaylorHintsStrategyBitcoinBuy
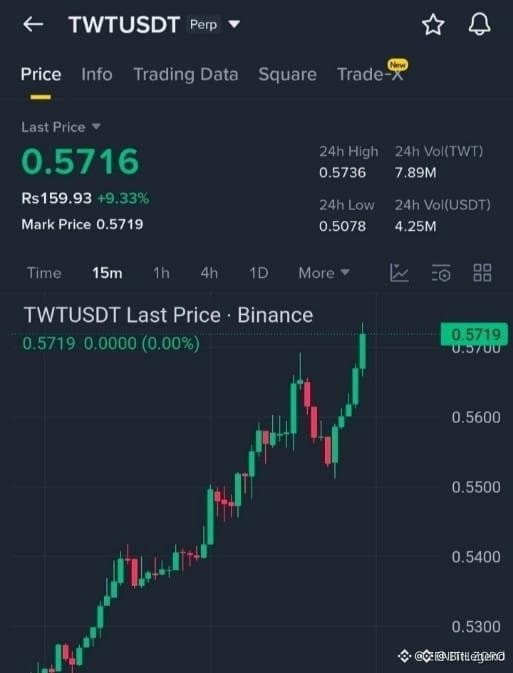

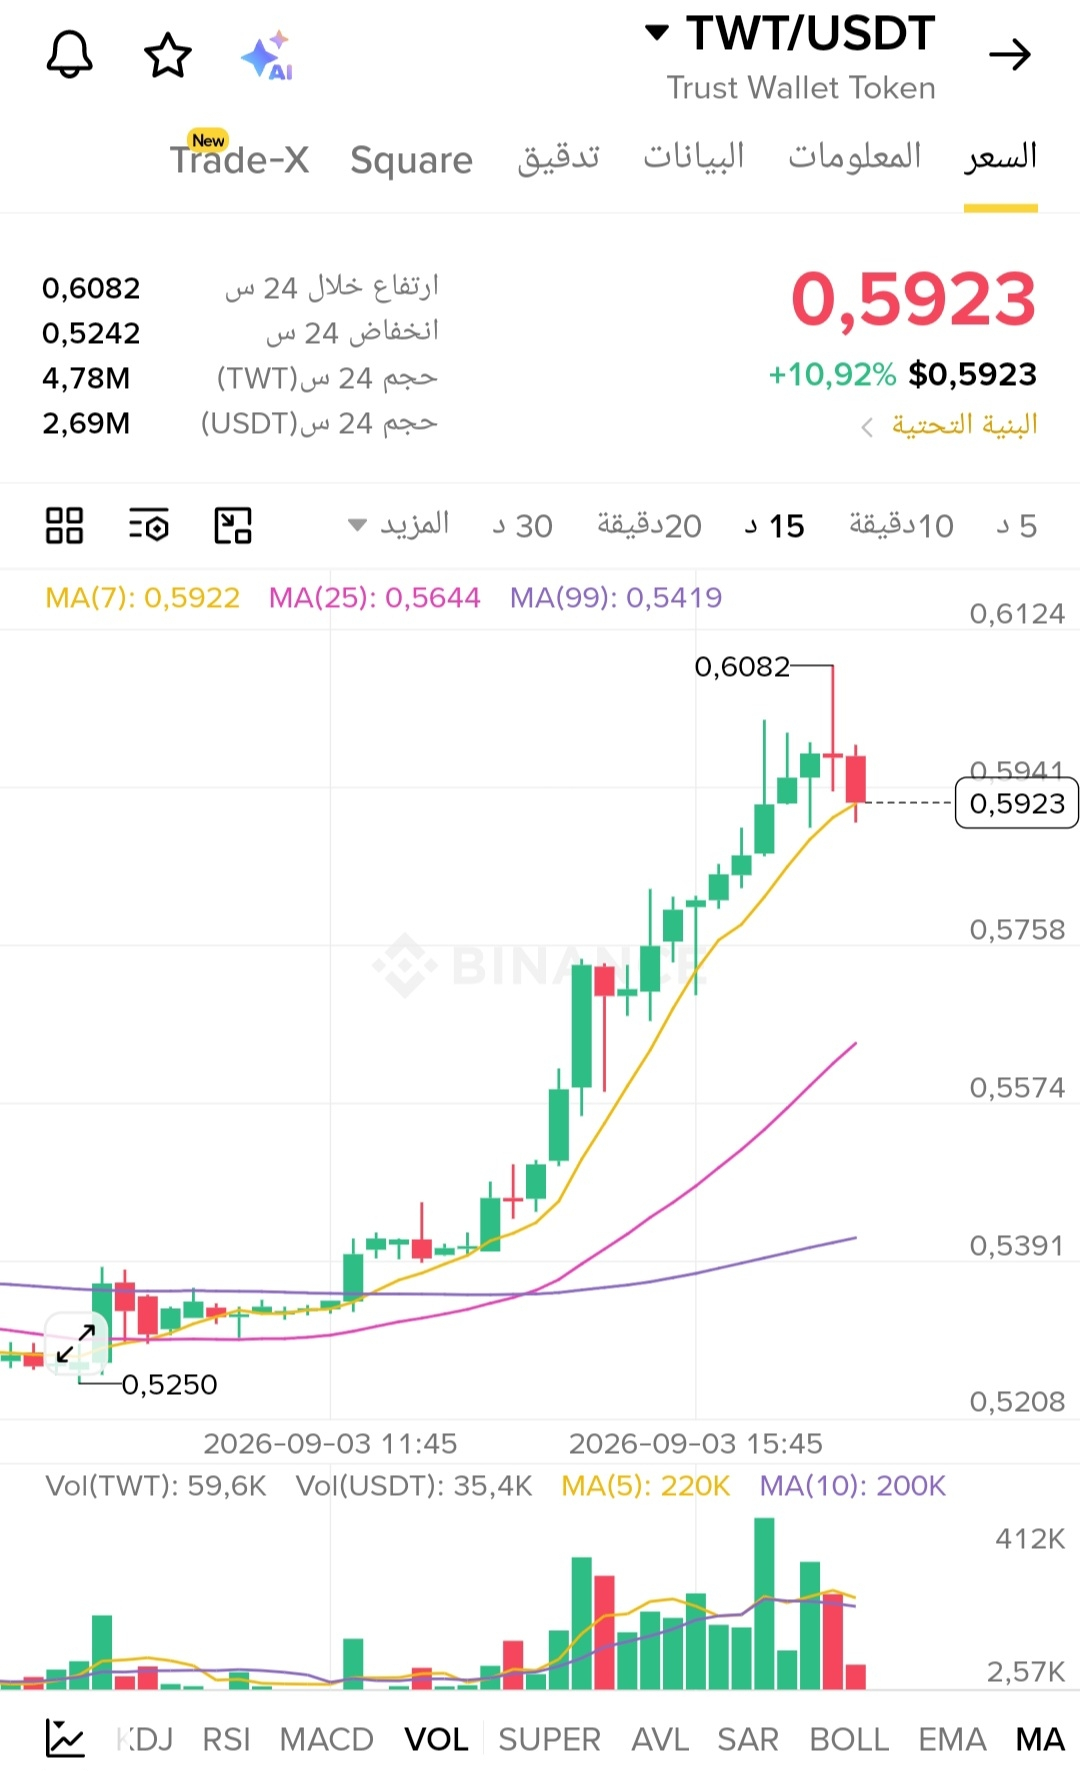
Don't miss the opportunity
Long
$TWT
Entry 0.575 - 0.590
Stop Loss (SL): 0.545
-Target 0.640
-Target 0.680
-Target 0.670
$TWT
#TWT.
#TWTUSDT
#TWT/USDT
#TWT
#TwinsTulip
$TWT
Long
$TWT
Entry 0.575 - 0.590
Stop Loss (SL): 0.545
-Target 0.640
-Target 0.680
-Target 0.670
$TWT
#TWT.
#TWTUSDT
#TWT/USDT
#TWT
#TwinsTulip
$TWT

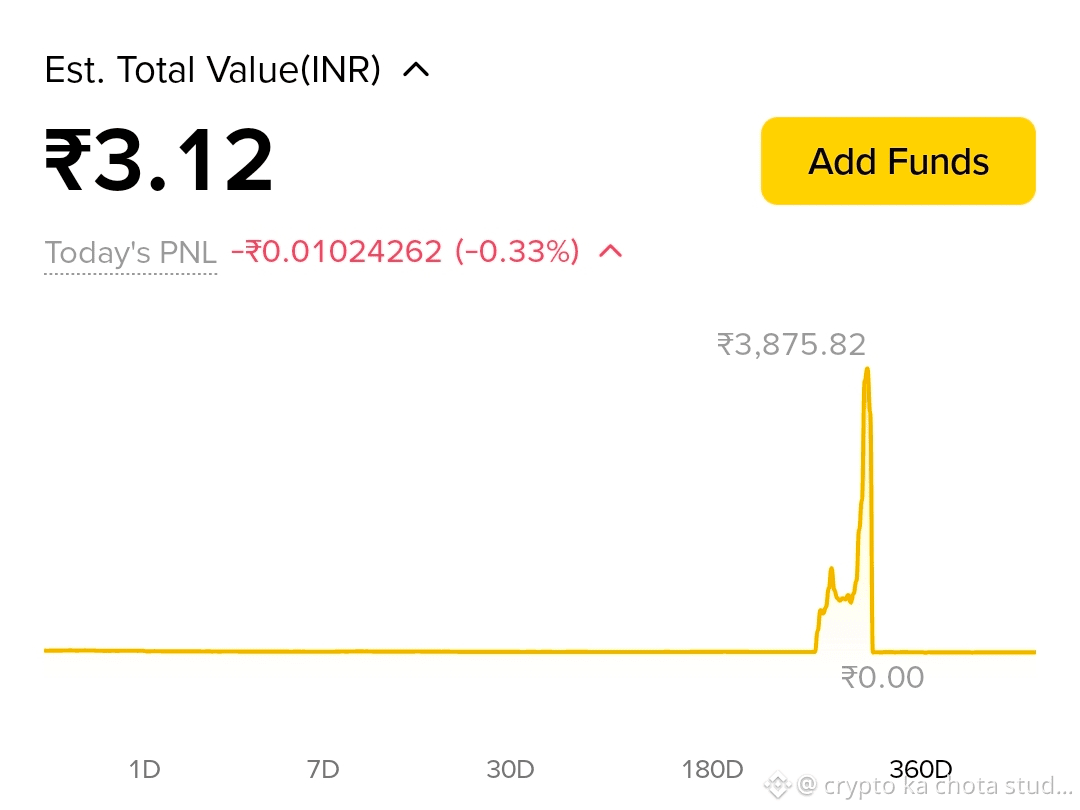
Day 3: ₹3.12 left.
Kal ₹3.16 tha, aaj ₹3.12. -0.33% PNL.
Log bolte hain chhod de, me bolta hu dekhta hu kaha tak jaata hai.
Loss chhupata nahi, dikhata hu. #TWT. #cryptoloss
Kal ₹3.16 tha, aaj ₹3.12. -0.33% PNL.
Log bolte hain chhod de, me bolta hu dekhta hu kaha tak jaata hai.
Loss chhupata nahi, dikhata hu. #TWT. #cryptoloss

#TWT.
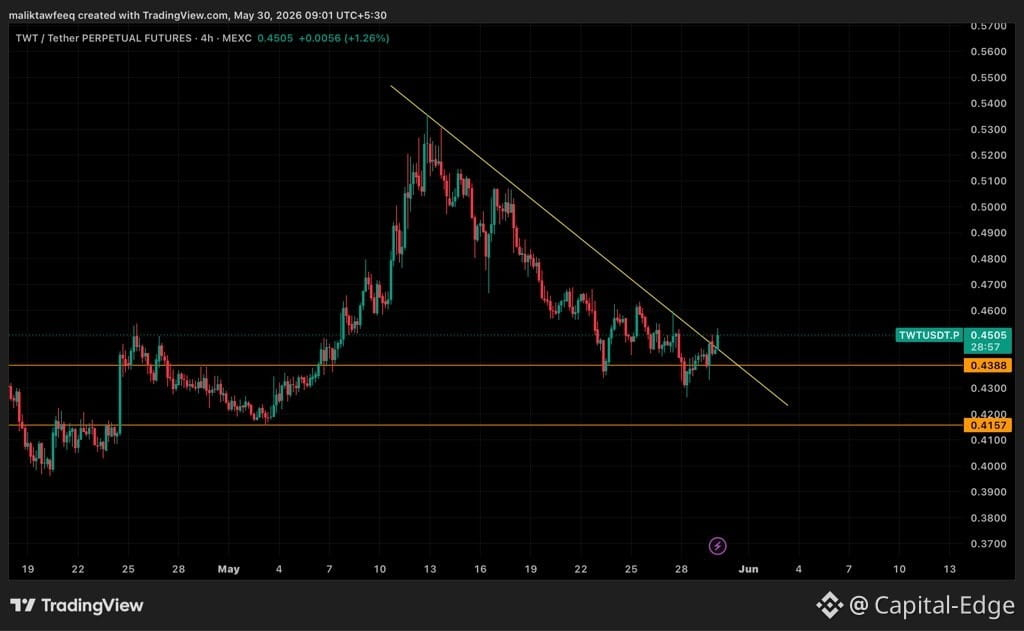
*TWT 4H Chart: Trust Wallet Token Breaks Downtrend, $0.4505 Flip Key For $0.53 Target*
TWT is trading at $0.4505, up 1.26% on the 4H chart. Price just broke above the yellow descending trendline from May 13 high. That’s the first bullish signal after 2 weeks of lower highs.
*What The Chart Shows:*
*1. Trendline Break = Structure Shift*
The yellow line connected every lower high from $0.53 → $0.48 → $0.46. TWT just tagged it at $0.4505 and is holding above. A 4H candle close above this line flips structure from bearish to bullish. Until then it’s just a fakeout zone.
*2. Support Flip At $0.4388*
The orange line at $0.4388 was resistance during the dump. Price bounced from $0.4157 demand, reclaimed $0.4388, and now it’s acting as support. If buyers defend this level, the trendline break gets confirmed. Lose it and we retest $0.4157 again.
*3. Next Targets If Breakout Holds*
- *Immediate resistance*: $0.4600 psychological level
- *Main target*: $0.4800-$0.4900 zone where sellers stepped in May 22-24
- *Breakout confirmation*: Daily close above $0.5000 + retest of yellow line
- *Bullish projection*: Back to May 13 high at $0.5300 if $0.48 flips
*Pro Insight: Volume Needed*
Trendline breaks fail 70% of time without volume. Watch 4H candle bodies. Small green doji above line = weak. Big bullish candle closing above $0.4550 = real breakout. Also watch if $0.4388 holds as support on retest.
*Outlook:*
Bias turns bullish on 4H close above $0.4550 + $0.4388 support hold. Rejection at yellow line sends TWT back to $0.4157. The $0.4157-$0.4388 zone is now the line in sand for bulls. Above it = range high at $0.53. Below it = lower lows.
_Note:
Trendlines are guides, not guarantees. Wait for candle close confirmation. This is analysis, not financial advice._
*TWT 4H Chart: Trust Wallet Token Breaks Downtrend, $0.4505 Flip Key For $0.53 Target*
TWT is trading at $0.4505, up 1.26% on the 4H chart. Price just broke above the yellow descending trendline from May 13 high. That’s the first bullish signal after 2 weeks of lower highs.
*What The Chart Shows:*
*1. Trendline Break = Structure Shift*
The yellow line connected every lower high from $0.53 → $0.48 → $0.46. TWT just tagged it at $0.4505 and is holding above. A 4H candle close above this line flips structure from bearish to bullish. Until then it’s just a fakeout zone.
*2. Support Flip At $0.4388*
The orange line at $0.4388 was resistance during the dump. Price bounced from $0.4157 demand, reclaimed $0.4388, and now it’s acting as support. If buyers defend this level, the trendline break gets confirmed. Lose it and we retest $0.4157 again.
*3. Next Targets If Breakout Holds*
- *Immediate resistance*: $0.4600 psychological level
- *Main target*: $0.4800-$0.4900 zone where sellers stepped in May 22-24
- *Breakout confirmation*: Daily close above $0.5000 + retest of yellow line
- *Bullish projection*: Back to May 13 high at $0.5300 if $0.48 flips
*Pro Insight: Volume Needed*
Trendline breaks fail 70% of time without volume. Watch 4H candle bodies. Small green doji above line = weak. Big bullish candle closing above $0.4550 = real breakout. Also watch if $0.4388 holds as support on retest.
*Outlook:*
Bias turns bullish on 4H close above $0.4550 + $0.4388 support hold. Rejection at yellow line sends TWT back to $0.4157. The $0.4157-$0.4388 zone is now the line in sand for bulls. Above it = range high at $0.53. Below it = lower lows.
_Note:
Trendlines are guides, not guarantees. Wait for candle close confirmation. This is analysis, not financial advice._
Log in to explore more content