
#trxanalysis
trxanalysis
33,288 views
99 Discussing
Hot
Latest

Article
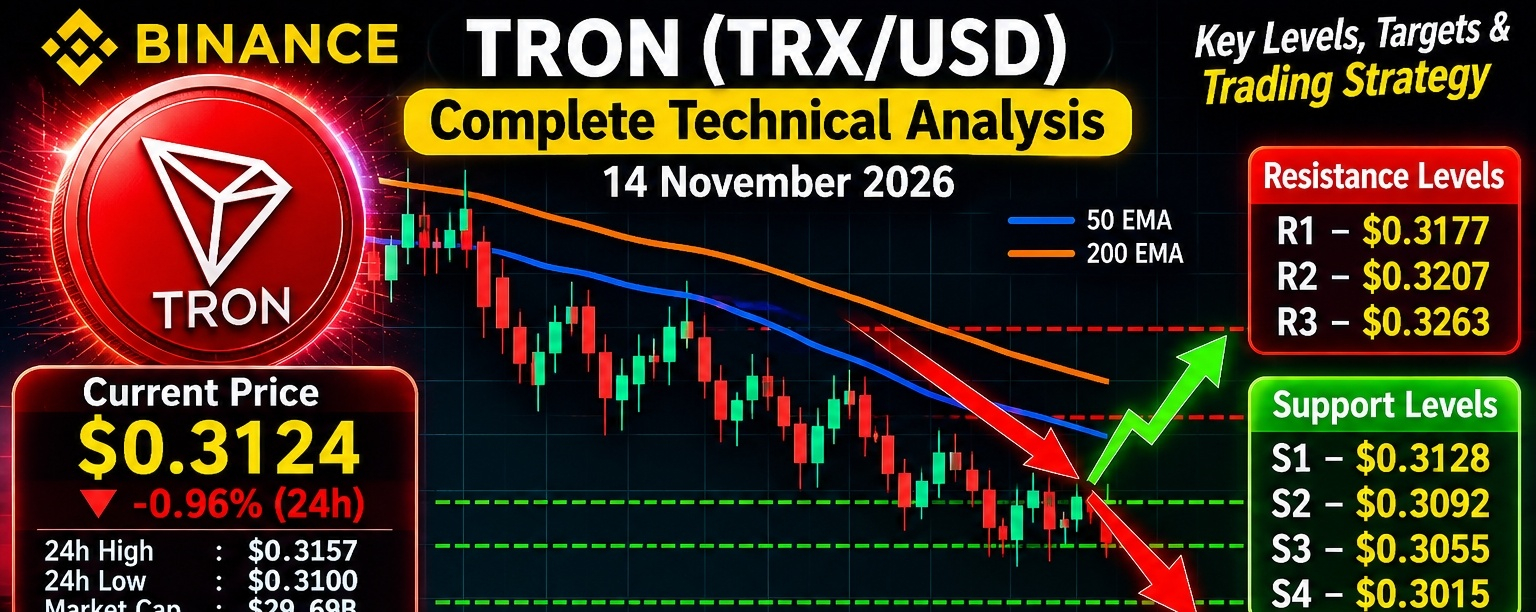
TRON (TRX/USD) — Complete Trading Analysis November 14, 2026 TRON ($TRX /USD) — Complete Trading Analysis November 14, 2026
I’ll cover the market direction, key support and resistance levels, bullish and bearish scenarios, and possible trading setups. TRX is commonly traded on Binance as TRX/USDT; USDT is a stablecoin, so its price is a close proxy for USD.
### $0.3124
{spot}(TRXUSDT)
Bearish bias
Indicative $TRX /USD quote · latest retrieved market snapshot, November 14, 2026
TRX is under short-term selling pressure. The daily RSI is around 39, and price is below key moving averages. That points to a weak trend, although a short-term rebound is possible if buyers defend nearby support. CoinGlass +2
### 1\. Market overview
| Metric | Latest available |
| ------------------ | ---------------- |
| Price | $0.3124 |
| 24-hour change | -0.96% |
| 24-hour range | $0.3100–$0.3157 |
| 7-day change | -1.74% |
| Market cap | About $29.69B |
| Circulating supply | About 95.04B TRX |
CoinGlass
### 2\. Technical indicators
* RSI (14): around 39 — weak momentum, not yet deeply oversold on the daily chart.
* Moving averages: price is below the 50-day and 200-day averages, suggesting the broader trend remains bearish.
* MACD/momentum: available readings lean bearish or neutral, not a confirmed bullish reversal.
* Trend: daily and hourly readings are weak; the weekly picture is less clear. COINOTAG +1
### 3\. Important support and resistance
Technical reference levels; not guaranteed turning points.
| Level | Price | Significance |
| ------------- | ------- | -------------------------- |
| Resistance 3 | $0.3263 | Stronger recovery hurdle |
| Resistance 2 | $0.3207 | Next upside barrier |
| Resistance 1 | $0.3177 | First important resistance |
| Current area | $0.3124 | Near-term price zone |
| Support 1 | $0.3128 | Immediate technical pivot |
| Support 2 | $0.3092 | Next support |
| Support 3 | $0.3055 | Deeper support |
| Major support | $0.3015 | Important recent low |
COINOTAG +1
The $0.3128 pivot is a reference from the November 13 daily analysis; the latest quote is slightly below it.
### 4\. Trading scenarios
Bullish scenario
* TRX needs to reclaim $0.3177.
* A sustained move above $0.3207 would strengthen the recovery.
* Next upside areas: $0.3263, then around $0.327–$0.330.
* A daily close above this higher zone would make the recovery more convincing.
Bearish scenario
* Continued trading below $0.3128 keeps downside risk elevated.
* A break below $0.3092 could expose $0.3055.
* If selling continues, watch $0.3015 and the psychological $0.3000 level.
Sideways scenario
\- If support around $0.3092–$0.3128 holds but resistance at $0.3177–$0.3207 remains intact, TRX could continue consolidating.
### 5\. Fundamental analysis
TRON’s network fundamentals look stronger than its current chart.
Stablecoin activity
### $92.25B
Average stablecoin supply in Q3 2026
Transfer volume
### $2.18T
Stablecoin transfers in Q3 2026
Monthly active addresses
### 17.81M
Quarterly average
Network revenue
### $693.21M
Q3 2026 reported revenue
The Block +1
Positive factors
* TRON remains a major network for USDT transfers and stablecoin payments.
* Stablecoin supply and network usage grew during Q3.
* Institutional access expanded, including the launch of a US-listed staked TRX ETF. Q3 2026 +1
Risks
* Strong network usage does not guarantee an immediate rise in TRX price.
* Network revenue reportedly declined slightly quarter-on-quarter in one Q3 report.
* Broader crypto-market weakness can keep pressure on TRX even when its network remains active. crypto.news
### 6\. Possible trading setups
These are conditional ideas based on the retrieved levels, not guaranteed trades.
| Setup | Entry condition | Target areas |
| ----------------- | ------------------------------------- | --------------- |
| Conservative long | Reclaim $0.3177 and hold | $0.3207–$0.3263 |
| Support bounce | Bullish reversal near $0.3092–$0.3128 | $0.3177 |
| Breakdown short | Lose $0.3092 and fail to reclaim | $0.3055–$0.3015 |
| Trend reversal | Daily close above $0.3263 | $0.327–$0.330+ |
Risk management: Wait for candle confirmation, use a stop-loss beyond the invalidation level, and avoid risking more than 1–2% of trading capital on a single trade. Futures leverage increases liquidation risk.
### 7\. My TRX outlook
* Next 24–48 hours: Weak unless $TRX recovers $0.3177.
* Next 1–2 weeks: A move toward $0.3207–$0.3263 is possible if buyers regain control.
* Bearish warning: A sustained break below $0.3055 could put $0.3015–$0.3000 in focus.
* Longer term: Strong stablecoin adoption is a positive fundamental factor, but price recovery still needs confirmation.
Bottom line: TRON has useful real-world network activity, but the current technical picture is weak. I would wait for a confirmed recovery above $0.3177 rather than chase a buy while price remains under resistance.
This is market analysis, not financial advice. Prices and indicators can change quickly. Check the live Binance TRX/USDT chart before placing a trade.
You can follow the market on [Binance TRX/USDT.
#TradingCommunity #trxanalysis #Trxusdt #viralmypost
TRON (TRX/USD) — Complete Trading Analysis November 14, 2026
TRON ($TRX /USD) — Complete Trading Analysis November 14, 2026
I’ll cover the market direction, key support and resistance levels, bullish and bearish scenarios, and possible trading setups. TRX is commonly traded on Binance as TRX/USDT; USDT is a stablecoin, so its price is a close proxy for USD.
### $0.3124
Bearish bias
Indicative $TRX /USD quote · latest retrieved market snapshot, November 14, 2026
TRX is under short-term selling pressure. The daily RSI is around 39, and price is below key moving averages. That points to a weak trend, although a short-term rebound is possible if buyers defend nearby support. CoinGlass +2
### 1\. Market overview
| Metric | Latest available |
| ------------------ | ---------------- |
| Price | $0.3124 |
| 24-hour change | -0.96% |
| 24-hour range | $0.3100–$0.3157 |
| 7-day change | -1.74% |
| Market cap | About $29.69B |
| Circulating supply | About 95.04B TRX |
CoinGlass
### 2\. Technical indicators
* RSI (14): around 39 — weak momentum, not yet deeply oversold on the daily chart.
* Moving averages: price is below the 50-day and 200-day averages, suggesting the broader trend remains bearish.
* MACD/momentum: available readings lean bearish or neutral, not a confirmed bullish reversal.
* Trend: daily and hourly readings are weak; the weekly picture is less clear. COINOTAG +1
### 3\. Important support and resistance
Technical reference levels; not guaranteed turning points.
| Level | Price | Significance |
| ------------- | ------- | -------------------------- |
| Resistance 3 | $0.3263 | Stronger recovery hurdle |
| Resistance 2 | $0.3207 | Next upside barrier |
| Resistance 1 | $0.3177 | First important resistance |
| Current area | $0.3124 | Near-term price zone |
| Support 1 | $0.3128 | Immediate technical pivot |
| Support 2 | $0.3092 | Next support |
| Support 3 | $0.3055 | Deeper support |
| Major support | $0.3015 | Important recent low |
COINOTAG +1
The $0.3128 pivot is a reference from the November 13 daily analysis; the latest quote is slightly below it.
### 4\. Trading scenarios
Bullish scenario
* TRX needs to reclaim $0.3177.
* A sustained move above $0.3207 would strengthen the recovery.
* Next upside areas: $0.3263, then around $0.327–$0.330.
* A daily close above this higher zone would make the recovery more convincing.
Bearish scenario
* Continued trading below $0.3128 keeps downside risk elevated.
* A break below $0.3092 could expose $0.3055.
* If selling continues, watch $0.3015 and the psychological $0.3000 level.
Sideways scenario
\- If support around $0.3092–$0.3128 holds but resistance at $0.3177–$0.3207 remains intact, TRX could continue consolidating.
### 5\. Fundamental analysis
TRON’s network fundamentals look stronger than its current chart.
Stablecoin activity
### $92.25B
Average stablecoin supply in Q3 2026
Transfer volume
### $2.18T
Stablecoin transfers in Q3 2026
Monthly active addresses
### 17.81M
Quarterly average
Network revenue
### $693.21M
Q3 2026 reported revenue
The Block +1
Positive factors
* TRON remains a major network for USDT transfers and stablecoin payments.
* Stablecoin supply and network usage grew during Q3.
* Institutional access expanded, including the launch of a US-listed staked TRX ETF. Q3 2026 +1
Risks
* Strong network usage does not guarantee an immediate rise in TRX price.
* Network revenue reportedly declined slightly quarter-on-quarter in one Q3 report.
* Broader crypto-market weakness can keep pressure on TRX even when its network remains active. crypto.news
### 6\. Possible trading setups
These are conditional ideas based on the retrieved levels, not guaranteed trades.
| Setup | Entry condition | Target areas |
| ----------------- | ------------------------------------- | --------------- |
| Conservative long | Reclaim $0.3177 and hold | $0.3207–$0.3263 |
| Support bounce | Bullish reversal near $0.3092–$0.3128 | $0.3177 |
| Breakdown short | Lose $0.3092 and fail to reclaim | $0.3055–$0.3015 |
| Trend reversal | Daily close above $0.3263 | $0.327–$0.330+ |
Risk management: Wait for candle confirmation, use a stop-loss beyond the invalidation level, and avoid risking more than 1–2% of trading capital on a single trade. Futures leverage increases liquidation risk.
### 7\. My TRX outlook
* Next 24–48 hours: Weak unless $TRX recovers $0.3177.
* Next 1–2 weeks: A move toward $0.3207–$0.3263 is possible if buyers regain control.
* Bearish warning: A sustained break below $0.3055 could put $0.3015–$0.3000 in focus.
* Longer term: Strong stablecoin adoption is a positive fundamental factor, but price recovery still needs confirmation.
Bottom line: TRON has useful real-world network activity, but the current technical picture is weak. I would wait for a confirmed recovery above $0.3177 rather than chase a buy while price remains under resistance.
This is market analysis, not financial advice. Prices and indicators can change quickly. Check the live Binance TRX/USDT chart before placing a trade.
You can follow the market on [Binance TRX/USDT.
#TradingCommunity #trxanalysis #Trxusdt #viralmypost
I’ll cover the market direction, key support and resistance levels, bullish and bearish scenarios, and possible trading setups. TRX is commonly traded on Binance as TRX/USDT; USDT is a stablecoin, so its price is a close proxy for USD.
### $0.3124
Bearish bias
Indicative $TRX /USD quote · latest retrieved market snapshot, November 14, 2026
TRX is under short-term selling pressure. The daily RSI is around 39, and price is below key moving averages. That points to a weak trend, although a short-term rebound is possible if buyers defend nearby support. CoinGlass +2
### 1\. Market overview
| Metric | Latest available |
| ------------------ | ---------------- |
| Price | $0.3124 |
| 24-hour change | -0.96% |
| 24-hour range | $0.3100–$0.3157 |
| 7-day change | -1.74% |
| Market cap | About $29.69B |
| Circulating supply | About 95.04B TRX |
CoinGlass
### 2\. Technical indicators
* RSI (14): around 39 — weak momentum, not yet deeply oversold on the daily chart.
* Moving averages: price is below the 50-day and 200-day averages, suggesting the broader trend remains bearish.
* MACD/momentum: available readings lean bearish or neutral, not a confirmed bullish reversal.
* Trend: daily and hourly readings are weak; the weekly picture is less clear. COINOTAG +1
### 3\. Important support and resistance
Technical reference levels; not guaranteed turning points.
| Level | Price | Significance |
| ------------- | ------- | -------------------------- |
| Resistance 3 | $0.3263 | Stronger recovery hurdle |
| Resistance 2 | $0.3207 | Next upside barrier |
| Resistance 1 | $0.3177 | First important resistance |
| Current area | $0.3124 | Near-term price zone |
| Support 1 | $0.3128 | Immediate technical pivot |
| Support 2 | $0.3092 | Next support |
| Support 3 | $0.3055 | Deeper support |
| Major support | $0.3015 | Important recent low |
COINOTAG +1
The $0.3128 pivot is a reference from the November 13 daily analysis; the latest quote is slightly below it.
### 4\. Trading scenarios
Bullish scenario
* TRX needs to reclaim $0.3177.
* A sustained move above $0.3207 would strengthen the recovery.
* Next upside areas: $0.3263, then around $0.327–$0.330.
* A daily close above this higher zone would make the recovery more convincing.
Bearish scenario
* Continued trading below $0.3128 keeps downside risk elevated.
* A break below $0.3092 could expose $0.3055.
* If selling continues, watch $0.3015 and the psychological $0.3000 level.
Sideways scenario
\- If support around $0.3092–$0.3128 holds but resistance at $0.3177–$0.3207 remains intact, TRX could continue consolidating.
### 5\. Fundamental analysis
TRON’s network fundamentals look stronger than its current chart.
Stablecoin activity
### $92.25B
Average stablecoin supply in Q3 2026
Transfer volume
### $2.18T
Stablecoin transfers in Q3 2026
Monthly active addresses
### 17.81M
Quarterly average
Network revenue
### $693.21M
Q3 2026 reported revenue
The Block +1
Positive factors
* TRON remains a major network for USDT transfers and stablecoin payments.
* Stablecoin supply and network usage grew during Q3.
* Institutional access expanded, including the launch of a US-listed staked TRX ETF. Q3 2026 +1
Risks
* Strong network usage does not guarantee an immediate rise in TRX price.
* Network revenue reportedly declined slightly quarter-on-quarter in one Q3 report.
* Broader crypto-market weakness can keep pressure on TRX even when its network remains active. crypto.news
### 6\. Possible trading setups
These are conditional ideas based on the retrieved levels, not guaranteed trades.
| Setup | Entry condition | Target areas |
| ----------------- | ------------------------------------- | --------------- |
| Conservative long | Reclaim $0.3177 and hold | $0.3207–$0.3263 |
| Support bounce | Bullish reversal near $0.3092–$0.3128 | $0.3177 |
| Breakdown short | Lose $0.3092 and fail to reclaim | $0.3055–$0.3015 |
| Trend reversal | Daily close above $0.3263 | $0.327–$0.330+ |
Risk management: Wait for candle confirmation, use a stop-loss beyond the invalidation level, and avoid risking more than 1–2% of trading capital on a single trade. Futures leverage increases liquidation risk.
### 7\. My TRX outlook
* Next 24–48 hours: Weak unless $TRX recovers $0.3177.
* Next 1–2 weeks: A move toward $0.3207–$0.3263 is possible if buyers regain control.
* Bearish warning: A sustained break below $0.3055 could put $0.3015–$0.3000 in focus.
* Longer term: Strong stablecoin adoption is a positive fundamental factor, but price recovery still needs confirmation.
Bottom line: TRON has useful real-world network activity, but the current technical picture is weak. I would wait for a confirmed recovery above $0.3177 rather than chase a buy while price remains under resistance.
This is market analysis, not financial advice. Prices and indicators can change quickly. Check the live Binance TRX/USDT chart before placing a trade.
You can follow the market on [Binance TRX/USDT.
#TradingCommunity #trxanalysis #Trxusdt #viralmypost
73
Article
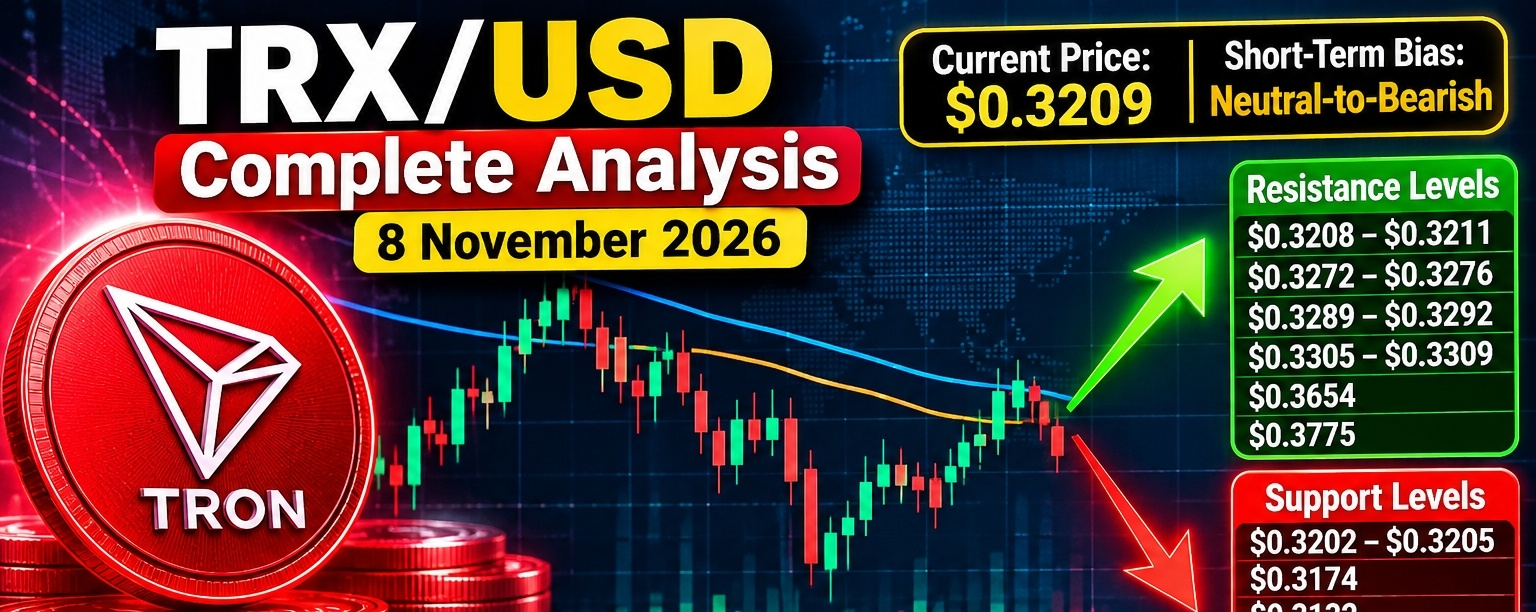
TRX/USD Complete Analysis — 8 November 2026$TRX /USD Complete Analysis — 8 November 2026
Current price: approximately $0.3209.
Short-term bias: 🟠 Neutral-to-bearish
Key point: $TRX is holding just above $0.3202–$0.3205, but the 4H and daily market structures remain bearish.
📊 Technical indicators
{spot}(TRXUSDT)
- RSI (14): ~58–62 → bullish momentum, but not yet overbought.
- MACD: Buy signal.
- ADX: ~34–37 → trend has reasonable strength.
- MA20: around $0.3201–$0.3203
- MA50: around $0.3192–$0.3197
- MA100: around $0.3193–$0.3196
- MA200: around $0.3180, although the 200-EMA is near $0.3207.
The interesting part is the conflict between indicators and structure: short-term indicators are mostly positive, while the 4H/daily structure remains bearish. That means confirmation is important before chasing a breakout.
🟢 Important support levels
Level Importance
$0.3202–$0.3205 Immediate support
$0.3174 Strong daily support
$0.3132 Weekly support
$0.3020 Major downside support
$0.2890 Major lower support
The $0.3202–$0.3205 zone is the immediate battleground. A failure there would make $0.3174 the next important test.
🔴 Resistance levels
Level Importance
$0.3208–$0.3211 Immediate resistance
$0.3272–$0.3276 Major 4H resistance
$0.3289–$0.3292 Strong resistance
$0.3305–$0.3309 Breakout zone
$0.3654 Major higher resistance
$0.3775 Major swing high
The first real bullish test is $0.3272–$0.3276. A clean break above that area would improve the structure considerably.
📈 Bullish scenario
If $TRX continues holding $0.3202–$0.3205 and breaks $0.3276, momentum could extend toward:
$0.3290 → $0.3305 → $0.3350 → $0.3450
A sustained move above $0.3309 would be a stronger confirmation that the bearish 4H structure is reversing.
For a larger trend reversal, $0.3654 is the major level to watch.
📉 Bearish scenario
If TRX loses $0.3202, the next targets become:
$0.3174 → $0.3132 → $0.3020 → $0.2890
A daily close below $0.3132 would substantially strengthen the bearish case.
🏦 Fundamental outlook
TRON's fundamentals remain relatively strong. Q3 2026 data showed approximately $2.21 trillion in stablecoin settlement, around 3.7 million daily active addresses, and more than $92.7 billion of USDT on TRON at its Q3 peak. TRON also gained additional institutional access through the Canary Staked TRX ETF, launched in September.
This gives TRX a stronger utility narrative than price action alone suggests. However, strong network activity does not automatically mean the token must rise, so technical confirmation remains important.
🎯 Trading setup
Aggressive long:
$0.3205–$0.3210 after a confirmed bullish reaction
Targets: $0.3275 → $0.3305 → $0.3350
Safer long:
Wait for a breakout above $0.3276, preferably followed by a successful retest.
Bearish setup:
Confirmed break below $0.3202
Targets: $0.3174 → $0.3132 → $0.3020
Bullish invalidation: sustained weakness below $0.3174.
Bearish invalidation: strong breakout and acceptance above $0.3309.
🔥 Overall view
Short term: 🟠 Neutral/Bearish
Medium term: 🟠 Neutral-to-bullish if $0.3174 holds
Long term: 🟢 Fundamentally constructive
Most important levels:
➡️ Above $0.3276 = bullish momentum
➡️ Above $0.3309 = stronger breakout confirmation
➡️ Below $0.3202 = downside risk increases
➡️ Below $0.3132 = bearish structure becomes much stronger
This is technical market analysis, not financial advice. Crypto prices can move rapidly, so use appropriate risk management.
#TRX #TRX/USDT❤️ #TrendingPredictions #trxanalysis
TRX/USD Complete Analysis — 8 November 2026
$TRX /USD Complete Analysis — 8 November 2026
Current price: approximately $0.3209.
Short-term bias: 🟠 Neutral-to-bearish
Key point: $TRX is holding just above $0.3202–$0.3205, but the 4H and daily market structures remain bearish.
📊 Technical indicators
- RSI (14): ~58–62 → bullish momentum, but not yet overbought.
- MACD: Buy signal.
- ADX: ~34–37 → trend has reasonable strength.
- MA20: around $0.3201–$0.3203
- MA50: around $0.3192–$0.3197
- MA100: around $0.3193–$0.3196
- MA200: around $0.3180, although the 200-EMA is near $0.3207.
The interesting part is the conflict between indicators and structure: short-term indicators are mostly positive, while the 4H/daily structure remains bearish. That means confirmation is important before chasing a breakout.
🟢 Important support levels
Level Importance
$0.3202–$0.3205 Immediate support
$0.3174 Strong daily support
$0.3132 Weekly support
$0.3020 Major downside support
$0.2890 Major lower support
The $0.3202–$0.3205 zone is the immediate battleground. A failure there would make $0.3174 the next important test.
🔴 Resistance levels
Level Importance
$0.3208–$0.3211 Immediate resistance
$0.3272–$0.3276 Major 4H resistance
$0.3289–$0.3292 Strong resistance
$0.3305–$0.3309 Breakout zone
$0.3654 Major higher resistance
$0.3775 Major swing high
The first real bullish test is $0.3272–$0.3276. A clean break above that area would improve the structure considerably.
📈 Bullish scenario
If $TRX continues holding $0.3202–$0.3205 and breaks $0.3276, momentum could extend toward:
$0.3290 → $0.3305 → $0.3350 → $0.3450
A sustained move above $0.3309 would be a stronger confirmation that the bearish 4H structure is reversing.
For a larger trend reversal, $0.3654 is the major level to watch.
📉 Bearish scenario
If TRX loses $0.3202, the next targets become:
$0.3174 → $0.3132 → $0.3020 → $0.2890
A daily close below $0.3132 would substantially strengthen the bearish case.
🏦 Fundamental outlook
TRON's fundamentals remain relatively strong. Q3 2026 data showed approximately $2.21 trillion in stablecoin settlement, around 3.7 million daily active addresses, and more than $92.7 billion of USDT on TRON at its Q3 peak. TRON also gained additional institutional access through the Canary Staked TRX ETF, launched in September.
This gives TRX a stronger utility narrative than price action alone suggests. However, strong network activity does not automatically mean the token must rise, so technical confirmation remains important.
🎯 Trading setup
Aggressive long:
$0.3205–$0.3210 after a confirmed bullish reaction
Targets: $0.3275 → $0.3305 → $0.3350
Safer long:
Wait for a breakout above $0.3276, preferably followed by a successful retest.
Bearish setup:
Confirmed break below $0.3202
Targets: $0.3174 → $0.3132 → $0.3020
Bullish invalidation: sustained weakness below $0.3174.
Bearish invalidation: strong breakout and acceptance above $0.3309.
🔥 Overall view
Short term: 🟠 Neutral/Bearish
Medium term: 🟠 Neutral-to-bullish if $0.3174 holds
Long term: 🟢 Fundamentally constructive
Most important levels:
➡️ Above $0.3276 = bullish momentum
➡️ Above $0.3309 = stronger breakout confirmation
➡️ Below $0.3202 = downside risk increases
➡️ Below $0.3132 = bearish structure becomes much stronger
This is technical market analysis, not financial advice. Crypto prices can move rapidly, so use appropriate risk management.
#TRX #TRX/USDT❤️ #TrendingPredictions #trxanalysis
Current price: approximately $0.3209.
Short-term bias: 🟠 Neutral-to-bearish
Key point: $TRX is holding just above $0.3202–$0.3205, but the 4H and daily market structures remain bearish.
📊 Technical indicators
- RSI (14): ~58–62 → bullish momentum, but not yet overbought.
- MACD: Buy signal.
- ADX: ~34–37 → trend has reasonable strength.
- MA20: around $0.3201–$0.3203
- MA50: around $0.3192–$0.3197
- MA100: around $0.3193–$0.3196
- MA200: around $0.3180, although the 200-EMA is near $0.3207.
The interesting part is the conflict between indicators and structure: short-term indicators are mostly positive, while the 4H/daily structure remains bearish. That means confirmation is important before chasing a breakout.
🟢 Important support levels
Level Importance
$0.3202–$0.3205 Immediate support
$0.3174 Strong daily support
$0.3132 Weekly support
$0.3020 Major downside support
$0.2890 Major lower support
The $0.3202–$0.3205 zone is the immediate battleground. A failure there would make $0.3174 the next important test.
🔴 Resistance levels
Level Importance
$0.3208–$0.3211 Immediate resistance
$0.3272–$0.3276 Major 4H resistance
$0.3289–$0.3292 Strong resistance
$0.3305–$0.3309 Breakout zone
$0.3654 Major higher resistance
$0.3775 Major swing high
The first real bullish test is $0.3272–$0.3276. A clean break above that area would improve the structure considerably.
📈 Bullish scenario
If $TRX continues holding $0.3202–$0.3205 and breaks $0.3276, momentum could extend toward:
$0.3290 → $0.3305 → $0.3350 → $0.3450
A sustained move above $0.3309 would be a stronger confirmation that the bearish 4H structure is reversing.
For a larger trend reversal, $0.3654 is the major level to watch.
📉 Bearish scenario
If TRX loses $0.3202, the next targets become:
$0.3174 → $0.3132 → $0.3020 → $0.2890
A daily close below $0.3132 would substantially strengthen the bearish case.
🏦 Fundamental outlook
TRON's fundamentals remain relatively strong. Q3 2026 data showed approximately $2.21 trillion in stablecoin settlement, around 3.7 million daily active addresses, and more than $92.7 billion of USDT on TRON at its Q3 peak. TRON also gained additional institutional access through the Canary Staked TRX ETF, launched in September.
This gives TRX a stronger utility narrative than price action alone suggests. However, strong network activity does not automatically mean the token must rise, so technical confirmation remains important.
🎯 Trading setup
Aggressive long:
$0.3205–$0.3210 after a confirmed bullish reaction
Targets: $0.3275 → $0.3305 → $0.3350
Safer long:
Wait for a breakout above $0.3276, preferably followed by a successful retest.
Bearish setup:
Confirmed break below $0.3202
Targets: $0.3174 → $0.3132 → $0.3020
Bullish invalidation: sustained weakness below $0.3174.
Bearish invalidation: strong breakout and acceptance above $0.3309.
🔥 Overall view
Short term: 🟠 Neutral/Bearish
Medium term: 🟠 Neutral-to-bullish if $0.3174 holds
Long term: 🟢 Fundamentally constructive
Most important levels:
➡️ Above $0.3276 = bullish momentum
➡️ Above $0.3309 = stronger breakout confirmation
➡️ Below $0.3202 = downside risk increases
➡️ Below $0.3132 = bearish structure becomes much stronger
This is technical market analysis, not financial advice. Crypto prices can move rapidly, so use appropriate risk management.
#TRX #TRX/USDT❤️ #TrendingPredictions #trxanalysis
11


·
--
The $TRX setup has me cautious with those heavy sell walls, but I'm also monitoring $SPCXB for any correlated movements.
🔥 Deep Market Intel
💎 Order Book: Heavy Sell Walls (0.65x)
💎 1H Open Interest: Declining (-)
💎 Whales L/S: 40.8% Long
💎 Taker Flow: 0.42x
💎
🎯 $TRX MACRO BREAKOUT 📈
💎 Entry Zone: 0.31057 - 0.31530
💎 🎯 Target 1: 0.31845
💎 🎯 Target 2: 0.32161
💎 🎯 Target 3: 0.32539
💎 🛑 Invalidation (SL): 0.30679
🔥 Deep Market Intel
💎 Order Book: Heavy Sell Walls (0.30x)
💎 1H Open Interest: Declining (-)
💎 Whales L/S: 61.9% Long
💎 Taker Flow: 1.03x 📊
#TRXAnalysis #SPCXB
The $TRX setup has me cautious with those heavy sell walls, but I'm also monitoring $SPCXB for any correlated movements.
🔥 Deep Market Intel
💎 Order Book: Heavy Sell Walls (0.65x)
💎 1H Open Interest: Declining (-)
💎 Whales L/S: 40.8% Long
💎 Taker Flow: 0.42x
💎
🎯 $TRX MACRO BREAKOUT 📈
💎 Entry Zone: 0.31057 - 0.31530
💎 🎯 Target 1: 0.31845
💎 🎯 Target 2: 0.32161
💎 🎯 Target 3: 0.32539
💎 🛑 Invalidation (SL): 0.30679
🔥 Deep Market Intel
💎 Order Book: Heavy Sell Walls (0.30x)
💎 1H Open Interest: Declining (-)
💎 Whales L/S: 61.9% Long
💎 Taker Flow: 1.03x 📊
#TRXAnalysis #SPCXB
🔥 Deep Market Intel
💎 Order Book: Heavy Sell Walls (0.65x)
💎 1H Open Interest: Declining (-)
💎 Whales L/S: 40.8% Long
💎 Taker Flow: 0.42x
💎
🎯 $TRX MACRO BREAKOUT 📈
💎 Entry Zone: 0.31057 - 0.31530
💎 🎯 Target 1: 0.31845
💎 🎯 Target 2: 0.32161
💎 🎯 Target 3: 0.32539
💎 🛑 Invalidation (SL): 0.30679
🔥 Deep Market Intel
💎 Order Book: Heavy Sell Walls (0.30x)
💎 1H Open Interest: Declining (-)
💎 Whales L/S: 61.9% Long
💎 Taker Flow: 1.03x 📊
#TRXAnalysis #SPCXB
2
604

🔥 $TRX - Where Are We Now?
TRON is currently sitting at $0.3692 zone.
TRX keeps delivering! TRON processes millions of transactions daily with ultra-low fees. One of the most used blockchains in the world! 💪
📌 Key Levels to Watch:
Support: $0.34 - $0.36 zone 👀
Resistance: $0.40 - $0.42 zone
Do you think $TRX will hit $0.50 soon?
Drop your thoughts in the comments! 👇🚀
$TRX $BTC $ETH
#TRON #TRX #Crypto #BinanceSquare #trxanalysis
🔥 $TRX - Where Are We Now?
TRON is currently sitting at $0.3692 zone.
TRX keeps delivering! TRON processes millions of transactions daily with ultra-low fees. One of the most used blockchains in the world! 💪
📌 Key Levels to Watch:
Support: $0.34 - $0.36 zone 👀
Resistance: $0.40 - $0.42 zone
Do you think $TRX will hit $0.50 soon?
Drop your thoughts in the comments! 👇🚀
$TRX $BTC $ETH
#TRON #TRX #Crypto #BinanceSquare #trxanalysis
TRON is currently sitting at $0.3692 zone.
TRX keeps delivering! TRON processes millions of transactions daily with ultra-low fees. One of the most used blockchains in the world! 💪
📌 Key Levels to Watch:
Support: $0.34 - $0.36 zone 👀
Resistance: $0.40 - $0.42 zone
Do you think $TRX will hit $0.50 soon?
Drop your thoughts in the comments! 👇🚀
$TRX $BTC $ETH
#TRON #TRX #Crypto #BinanceSquare #trxanalysis
36
Article
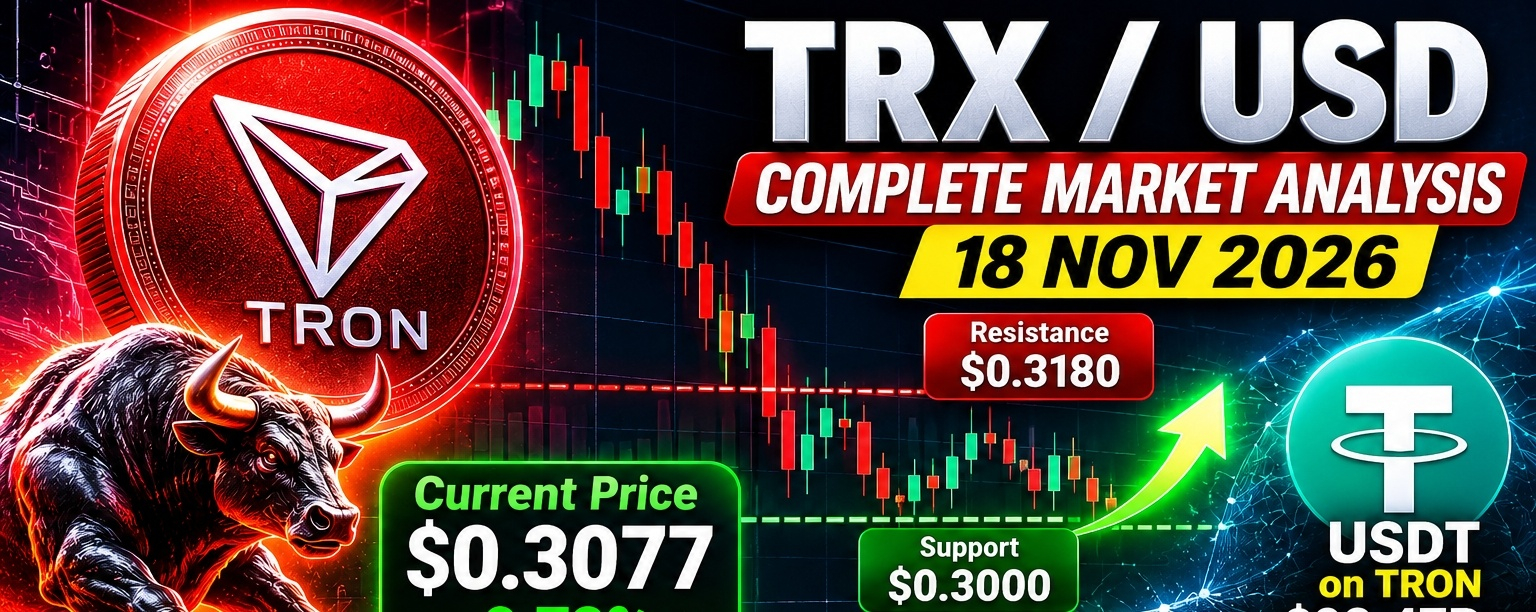
TRX / USD - Complete Analysis 18 Nov 2026 | Price: ∼$0.3077$TRX / USD - Complete Analysis 18 Nov 2026 | Price: ∼$0.3077
$TRX is the outlier in this market. While XRP is down -48% YTD and most altcoins are crashing, TRX is UP +6.51% YTD and +5.34% in 1 year. It is not rallying, but it is refusing to collapse.
This is a low-volatility, high-utility, bearish-consolidation coin right now. Boring price, incredibly strong network.
{spot}(TRXUSDT)
This is not financial advice.
1. Live Market Snapshot
| Metric | Value |
| --- | --- |
| Current Price | $0.3077 |
| 24h Range | $0.3048 - $0.3087 |
| 24h Change | +0.72% |
| Market Cap | ~$29.04B - Rank #8 |
| Circulating Supply | 95.04B TRX |
| Total Supply | 95.04B TRX |
| All-Time High | $0.4392 (4 Dec 2024) - now -30.0% below ATH |
Performance - This is the key story:
5 sessions: -3.17%
1 month: -8.09%
6 months: -14.03%
Year-to-date: +6.51%
1 year: +5.34%
Compare: XRP YTD -48%, TRX YTD +6.5%. TRX is holding up because its revenue does not depend on speculation.
Sentiment: Neutral 66%, Fear & Greed 12 - Extreme Fear (market-wide fear, not TRX-specific panic).
2. What Just Happened?
TRX has been in a very tight, boring range for 3 days:
15 Nov: $0.3069 - $0.3096 -> Close $0.3054
16 Nov: $0.3053 - $0.3074 -> Close $0.3052
17 Nov: $0.3052 - $0.3066 -> Close $0.3058
No crash, no pump. Just sideways grinding while the rest of crypto fell. US inflation data on 10 Nov pushed bond yields up and dampened risk appetite, which is keeping all coins capped.
3. Technical Analysis
Trend: Bearish on charts, Bullish on resilience
TRX trades 6.61% below its 200-day EMA at $0.32653, while the 50-day EMA has crossed $0.00197 below the 200-day line, completing a bearish crossover (Death Cross).
On the 4H chart, $TRX remains below both the H4 SMA-50 at $0.3122 and H4 SMA-200 at $0.3231, indicating a bearish medium-term structure even as price attempts to climb.
Technical rating: Strong Bearish on 4H, 1D, and 1W in automated models.
Momentum: Weak, Not Oversold
RSI (1D): 37.5 - 38
MACD: Bearish, histogram below zero
MA: Bearish
RSI 37 means selling pressure, but not oversold like XRP was at 17. TRX is slowly bleeding, not capitulating.
Key Levels
| Type | Level | Why it matters |
| --- | --- | --- |
| Strong Support | $0.2973 - $0.3000 | Major floor, monthly support, buy zone $0.2982 - $0.3036 |
| Support 1 | $0.3033 | Nearest support, S1 strength 89 |
| Support 2 | $0.3015 | 24h support |
| Resistance 1 | $0.3082 - $0.3110 | 4H Kijun + nearest resistance, only 0.9% above |
| Resistance 2 | $0.3092 - $0.3094 | R1 strength 87, 24h resistance |
| Resistance 3 | $0.3180 | Monthly resistance / December target |
| Major Resistance | $0.3231 - $0.3265 | 200 SMA + 200 EMA - must reclaim to flip bullish |
| Breakout Target | $0.3654 | Next major resistance if $0.32 breaks |
Highest-probability scenario: Base case at 45%, with Consolidation near current trend and a target range of $0.296 - $0.327.
24h forecast: Trade within $0.30752 - $0.30804, with 24h target $0.3040, support $0.3015, resistance $0.3094.
4. Fundamental Analysis - Why TRX Is Different
TRON is a Layer 1 blockchain founded in 2017 by Justin Sun. It uses Delegated Proof-of-Stake (DPoS) with 27 Super Representatives.
The #1 Reason TRX Holds Up: USDT
TRON is now the main network for USDT, the largest stablecoin.
USDT on Tron: $92.47B - $94.2B in circulation, 50.7% of all USDT
In Q3 2026, TRON overtook Ethereum for average USDT supply: $90.75B on TRON vs $87.73B on Ethereum
Average native stablecoin supply in Q3: $92.25B, up 4.18% QoQ and 14.58% YoY
In Q3 2026, TRON processed $2.21 Trillion in stablecoin settlement volume
TRON handled about 73% of stablecoin transaction volume in September 2026
Over 7 days in November: 16M+ USDT transfers, ~$177.8B in reported volume
Cumulative transaction value on TRON exceeded $30 Trillion
USDT makes up 98.5% of stablecoins on TRON. That is both its biggest strength and biggest risk.
Other Bullish Fundamentals
1. Real Revenue: In Q3 2026 the network created about 360M TRX and burned a large amount - TRX is deflationary when usage is high because fees burn TRX.
2. First US Spot Staked TRX ETF Launched: In Oct 2026, the first U.S. spot staked TRX ETF debuted, giving institutions regulated exposure + staking yield.
3. Institutional Adoption: Tron Inc., a Nasdaq-listed company backed by Justin Sun, became one of the 27... in Oct 2026, expanding institutional access.
4. Low Fees / Fast: 3-second blocks, bandwidth/energy model instead of high gas fees. Perfect for remittances and P2P payments in Asia, Africa, Latin America.
Bearish / Risk Factors
1. USDT Concentration Risk: If Tether ever has regulatory trouble, TRON is hit hardest.
2. Centralization + Justin Sun Risk: DPoS with 27 validators is more centralized than Bitcoin/Ethereum. Justin Sun is one of crypto's most controversial figures - reputation risk is real.
3. No Hype Narrative: TRX doesn't have meme, AI, or ETF hype like other coins. It grows slowly.
4. US Macro: Strong US inflation data keeps Tron vulnerable as rising funding costs dampen risk appetite.
5. Scenarios - What to Watch
🟢 Bullish Scenario (30% probability)
Trigger: Daily close above $0.3122 (H4 SMA-50), then above $0.3231
Target: $0.3180 -> $0.3265 -> $0.3654
Forecast: TRX could be $0.384 - $0.385 by end of 2026 in historical models, and $0.385 in 2027 in some forecasts.
🟡 Base / Sideways Scenario (45% probability - Most Likely)
Range: $0.3000 - $0.3180
November 2026 target is $0.3060 by end of month, with $0.3000 support and $0.3180 resistance framing the monthly channel. TRX keeps grinding sideways while USDT usage grows.
Projected for 2026: Trade between $0.2950 and $0.3300, with December target $0.3180.
🔴 Bearish Scenario (25% probability)
Trigger: Daily close below $0.2973 / $0.3000 with volume
Target: $0.2901 (stop zone) -> $0.28 -> $0.26
This would break the 2026 base and signal TRX finally joining the broader market sell-off.
6. Long-Term Outlook
| Year | Forecast Range / Target |
| --- | --- |
| Nov 2026 | $0.3000 - $0.3180, target $0.3060 |
| Dec 2026 | $0.3180 target, up to $0.385 in optimistic models |
| 2027 | $0.385 |
| 2030 | $0.510 |
| 2040 | $1.000 |
These are model forecasts, not guarantees. TRX moves slowly - it took 7 years to go from $0.01 to $0.30.
7. Strategy Summary (Not Advice)
For Traders:
TRX is a range-trading coin, not a breakout coin right now
Buy zone: $0.2982 - $0.3036, Stop: $0.2901, First target: $0.3239
Sell / Short zone: Near $0.3110 - $0.3180 if rejected
Do not expect 20% moves - TRX moves 1-2% per day
For Long-Term Holders / Staking:
TRX is one of the few coins where staking + real usage supports price
Its strength is defensive: it falls less in bear markets
Its weakness is offensive: it pumps less in bull markets
TRX vs XRP Quick Comparison:
| | TRX | XRP |
| --- | --- | --- |
| YTD | +6.51% | -48.33% |
| Use Case | USDT settlement | Cross-border bank payments |
| Volatility | Very Low | Very High |
| Risk | Centralization / USDT | Regulation / ETF flows |
Want me to do:
TRX vs XRP - which is better to buy now head-to-head?
TRX 1H / 4H scalp levels with exact entry / SL / TP?
TRX staking calculator - how much you earn if you stake 10,000 TRX?
#TRX #TRXUpdate #TRX/USDT❤️ #trxanalysis #TradingCommunity
TRX / USD - Complete Analysis 18 Nov 2026 | Price: ∼$0.3077
$TRX / USD - Complete Analysis 18 Nov 2026 | Price: ∼$0.3077
$TRX is the outlier in this market. While XRP is down -48% YTD and most altcoins are crashing, TRX is UP +6.51% YTD and +5.34% in 1 year. It is not rallying, but it is refusing to collapse.
This is a low-volatility, high-utility, bearish-consolidation coin right now. Boring price, incredibly strong network.
This is not financial advice.
1. Live Market Snapshot
| Metric | Value |
| --- | --- |
| Current Price | $0.3077 |
| 24h Range | $0.3048 - $0.3087 |
| 24h Change | +0.72% |
| Market Cap | ~$29.04B - Rank #8 |
| Circulating Supply | 95.04B TRX |
| Total Supply | 95.04B TRX |
| All-Time High | $0.4392 (4 Dec 2024) - now -30.0% below ATH |
Performance - This is the key story:
5 sessions: -3.17%
1 month: -8.09%
6 months: -14.03%
Year-to-date: +6.51%
1 year: +5.34%
Compare: XRP YTD -48%, TRX YTD +6.5%. TRX is holding up because its revenue does not depend on speculation.
Sentiment: Neutral 66%, Fear & Greed 12 - Extreme Fear (market-wide fear, not TRX-specific panic).
2. What Just Happened?
TRX has been in a very tight, boring range for 3 days:
15 Nov: $0.3069 - $0.3096 -> Close $0.3054
16 Nov: $0.3053 - $0.3074 -> Close $0.3052
17 Nov: $0.3052 - $0.3066 -> Close $0.3058
No crash, no pump. Just sideways grinding while the rest of crypto fell. US inflation data on 10 Nov pushed bond yields up and dampened risk appetite, which is keeping all coins capped.
3. Technical Analysis
Trend: Bearish on charts, Bullish on resilience
TRX trades 6.61% below its 200-day EMA at $0.32653, while the 50-day EMA has crossed $0.00197 below the 200-day line, completing a bearish crossover (Death Cross).
On the 4H chart, $TRX remains below both the H4 SMA-50 at $0.3122 and H4 SMA-200 at $0.3231, indicating a bearish medium-term structure even as price attempts to climb.
Technical rating: Strong Bearish on 4H, 1D, and 1W in automated models.
Momentum: Weak, Not Oversold
RSI (1D): 37.5 - 38
MACD: Bearish, histogram below zero
MA: Bearish
RSI 37 means selling pressure, but not oversold like XRP was at 17. TRX is slowly bleeding, not capitulating.
Key Levels
| Type | Level | Why it matters |
| --- | --- | --- |
| Strong Support | $0.2973 - $0.3000 | Major floor, monthly support, buy zone $0.2982 - $0.3036 |
| Support 1 | $0.3033 | Nearest support, S1 strength 89 |
| Support 2 | $0.3015 | 24h support |
| Resistance 1 | $0.3082 - $0.3110 | 4H Kijun + nearest resistance, only 0.9% above |
| Resistance 2 | $0.3092 - $0.3094 | R1 strength 87, 24h resistance |
| Resistance 3 | $0.3180 | Monthly resistance / December target |
| Major Resistance | $0.3231 - $0.3265 | 200 SMA + 200 EMA - must reclaim to flip bullish |
| Breakout Target | $0.3654 | Next major resistance if $0.32 breaks |
Highest-probability scenario: Base case at 45%, with Consolidation near current trend and a target range of $0.296 - $0.327.
24h forecast: Trade within $0.30752 - $0.30804, with 24h target $0.3040, support $0.3015, resistance $0.3094.
4. Fundamental Analysis - Why TRX Is Different
TRON is a Layer 1 blockchain founded in 2017 by Justin Sun. It uses Delegated Proof-of-Stake (DPoS) with 27 Super Representatives.
The #1 Reason TRX Holds Up: USDT
TRON is now the main network for USDT, the largest stablecoin.
USDT on Tron: $92.47B - $94.2B in circulation, 50.7% of all USDT
In Q3 2026, TRON overtook Ethereum for average USDT supply: $90.75B on TRON vs $87.73B on Ethereum
Average native stablecoin supply in Q3: $92.25B, up 4.18% QoQ and 14.58% YoY
In Q3 2026, TRON processed $2.21 Trillion in stablecoin settlement volume
TRON handled about 73% of stablecoin transaction volume in September 2026
Over 7 days in November: 16M+ USDT transfers, ~$177.8B in reported volume
Cumulative transaction value on TRON exceeded $30 Trillion
USDT makes up 98.5% of stablecoins on TRON. That is both its biggest strength and biggest risk.
Other Bullish Fundamentals
1. Real Revenue: In Q3 2026 the network created about 360M TRX and burned a large amount - TRX is deflationary when usage is high because fees burn TRX.
2. First US Spot Staked TRX ETF Launched: In Oct 2026, the first U.S. spot staked TRX ETF debuted, giving institutions regulated exposure + staking yield.
3. Institutional Adoption: Tron Inc., a Nasdaq-listed company backed by Justin Sun, became one of the 27... in Oct 2026, expanding institutional access.
4. Low Fees / Fast: 3-second blocks, bandwidth/energy model instead of high gas fees. Perfect for remittances and P2P payments in Asia, Africa, Latin America.
Bearish / Risk Factors
1. USDT Concentration Risk: If Tether ever has regulatory trouble, TRON is hit hardest.
2. Centralization + Justin Sun Risk: DPoS with 27 validators is more centralized than Bitcoin/Ethereum. Justin Sun is one of crypto's most controversial figures - reputation risk is real.
3. No Hype Narrative: TRX doesn't have meme, AI, or ETF hype like other coins. It grows slowly.
4. US Macro: Strong US inflation data keeps Tron vulnerable as rising funding costs dampen risk appetite.
5. Scenarios - What to Watch
🟢 Bullish Scenario (30% probability)
Trigger: Daily close above $0.3122 (H4 SMA-50), then above $0.3231
Target: $0.3180 -> $0.3265 -> $0.3654
Forecast: TRX could be $0.384 - $0.385 by end of 2026 in historical models, and $0.385 in 2027 in some forecasts.
🟡 Base / Sideways Scenario (45% probability - Most Likely)
Range: $0.3000 - $0.3180
November 2026 target is $0.3060 by end of month, with $0.3000 support and $0.3180 resistance framing the monthly channel. TRX keeps grinding sideways while USDT usage grows.
Projected for 2026: Trade between $0.2950 and $0.3300, with December target $0.3180.
🔴 Bearish Scenario (25% probability)
Trigger: Daily close below $0.2973 / $0.3000 with volume
Target: $0.2901 (stop zone) -> $0.28 -> $0.26
This would break the 2026 base and signal TRX finally joining the broader market sell-off.
6. Long-Term Outlook
| Year | Forecast Range / Target |
| --- | --- |
| Nov 2026 | $0.3000 - $0.3180, target $0.3060 |
| Dec 2026 | $0.3180 target, up to $0.385 in optimistic models |
| 2027 | $0.385 |
| 2030 | $0.510 |
| 2040 | $1.000 |
These are model forecasts, not guarantees. TRX moves slowly - it took 7 years to go from $0.01 to $0.30.
7. Strategy Summary (Not Advice)
For Traders:
TRX is a range-trading coin, not a breakout coin right now
Buy zone: $0.2982 - $0.3036, Stop: $0.2901, First target: $0.3239
Sell / Short zone: Near $0.3110 - $0.3180 if rejected
Do not expect 20% moves - TRX moves 1-2% per day
For Long-Term Holders / Staking:
TRX is one of the few coins where staking + real usage supports price
Its strength is defensive: it falls less in bear markets
Its weakness is offensive: it pumps less in bull markets
TRX vs XRP Quick Comparison:
| | TRX | XRP |
| --- | --- | --- |
| YTD | +6.51% | -48.33% |
| Use Case | USDT settlement | Cross-border bank payments |
| Volatility | Very Low | Very High |
| Risk | Centralization / USDT | Regulation / ETF flows |
Want me to do:
TRX vs XRP - which is better to buy now head-to-head?
TRX 1H / 4H scalp levels with exact entry / SL / TP?
TRX staking calculator - how much you earn if you stake 10,000 TRX?
#TRX #TRXUpdate #TRX/USDT❤️ #trxanalysis #TradingCommunity
$TRX is the outlier in this market. While XRP is down -48% YTD and most altcoins are crashing, TRX is UP +6.51% YTD and +5.34% in 1 year. It is not rallying, but it is refusing to collapse.
This is a low-volatility, high-utility, bearish-consolidation coin right now. Boring price, incredibly strong network.
This is not financial advice.
1. Live Market Snapshot
| Metric | Value |
| --- | --- |
| Current Price | $0.3077 |
| 24h Range | $0.3048 - $0.3087 |
| 24h Change | +0.72% |
| Market Cap | ~$29.04B - Rank #8 |
| Circulating Supply | 95.04B TRX |
| Total Supply | 95.04B TRX |
| All-Time High | $0.4392 (4 Dec 2024) - now -30.0% below ATH |
Performance - This is the key story:
5 sessions: -3.17%
1 month: -8.09%
6 months: -14.03%
Year-to-date: +6.51%
1 year: +5.34%
Compare: XRP YTD -48%, TRX YTD +6.5%. TRX is holding up because its revenue does not depend on speculation.
Sentiment: Neutral 66%, Fear & Greed 12 - Extreme Fear (market-wide fear, not TRX-specific panic).
2. What Just Happened?
TRX has been in a very tight, boring range for 3 days:
15 Nov: $0.3069 - $0.3096 -> Close $0.3054
16 Nov: $0.3053 - $0.3074 -> Close $0.3052
17 Nov: $0.3052 - $0.3066 -> Close $0.3058
No crash, no pump. Just sideways grinding while the rest of crypto fell. US inflation data on 10 Nov pushed bond yields up and dampened risk appetite, which is keeping all coins capped.
3. Technical Analysis
Trend: Bearish on charts, Bullish on resilience
TRX trades 6.61% below its 200-day EMA at $0.32653, while the 50-day EMA has crossed $0.00197 below the 200-day line, completing a bearish crossover (Death Cross).
On the 4H chart, $TRX remains below both the H4 SMA-50 at $0.3122 and H4 SMA-200 at $0.3231, indicating a bearish medium-term structure even as price attempts to climb.
Technical rating: Strong Bearish on 4H, 1D, and 1W in automated models.
Momentum: Weak, Not Oversold
RSI (1D): 37.5 - 38
MACD: Bearish, histogram below zero
MA: Bearish
RSI 37 means selling pressure, but not oversold like XRP was at 17. TRX is slowly bleeding, not capitulating.
Key Levels
| Type | Level | Why it matters |
| --- | --- | --- |
| Strong Support | $0.2973 - $0.3000 | Major floor, monthly support, buy zone $0.2982 - $0.3036 |
| Support 1 | $0.3033 | Nearest support, S1 strength 89 |
| Support 2 | $0.3015 | 24h support |
| Resistance 1 | $0.3082 - $0.3110 | 4H Kijun + nearest resistance, only 0.9% above |
| Resistance 2 | $0.3092 - $0.3094 | R1 strength 87, 24h resistance |
| Resistance 3 | $0.3180 | Monthly resistance / December target |
| Major Resistance | $0.3231 - $0.3265 | 200 SMA + 200 EMA - must reclaim to flip bullish |
| Breakout Target | $0.3654 | Next major resistance if $0.32 breaks |
Highest-probability scenario: Base case at 45%, with Consolidation near current trend and a target range of $0.296 - $0.327.
24h forecast: Trade within $0.30752 - $0.30804, with 24h target $0.3040, support $0.3015, resistance $0.3094.
4. Fundamental Analysis - Why TRX Is Different
TRON is a Layer 1 blockchain founded in 2017 by Justin Sun. It uses Delegated Proof-of-Stake (DPoS) with 27 Super Representatives.
The #1 Reason TRX Holds Up: USDT
TRON is now the main network for USDT, the largest stablecoin.
USDT on Tron: $92.47B - $94.2B in circulation, 50.7% of all USDT
In Q3 2026, TRON overtook Ethereum for average USDT supply: $90.75B on TRON vs $87.73B on Ethereum
Average native stablecoin supply in Q3: $92.25B, up 4.18% QoQ and 14.58% YoY
In Q3 2026, TRON processed $2.21 Trillion in stablecoin settlement volume
TRON handled about 73% of stablecoin transaction volume in September 2026
Over 7 days in November: 16M+ USDT transfers, ~$177.8B in reported volume
Cumulative transaction value on TRON exceeded $30 Trillion
USDT makes up 98.5% of stablecoins on TRON. That is both its biggest strength and biggest risk.
Other Bullish Fundamentals
1. Real Revenue: In Q3 2026 the network created about 360M TRX and burned a large amount - TRX is deflationary when usage is high because fees burn TRX.
2. First US Spot Staked TRX ETF Launched: In Oct 2026, the first U.S. spot staked TRX ETF debuted, giving institutions regulated exposure + staking yield.
3. Institutional Adoption: Tron Inc., a Nasdaq-listed company backed by Justin Sun, became one of the 27... in Oct 2026, expanding institutional access.
4. Low Fees / Fast: 3-second blocks, bandwidth/energy model instead of high gas fees. Perfect for remittances and P2P payments in Asia, Africa, Latin America.
Bearish / Risk Factors
1. USDT Concentration Risk: If Tether ever has regulatory trouble, TRON is hit hardest.
2. Centralization + Justin Sun Risk: DPoS with 27 validators is more centralized than Bitcoin/Ethereum. Justin Sun is one of crypto's most controversial figures - reputation risk is real.
3. No Hype Narrative: TRX doesn't have meme, AI, or ETF hype like other coins. It grows slowly.
4. US Macro: Strong US inflation data keeps Tron vulnerable as rising funding costs dampen risk appetite.
5. Scenarios - What to Watch
🟢 Bullish Scenario (30% probability)
Trigger: Daily close above $0.3122 (H4 SMA-50), then above $0.3231
Target: $0.3180 -> $0.3265 -> $0.3654
Forecast: TRX could be $0.384 - $0.385 by end of 2026 in historical models, and $0.385 in 2027 in some forecasts.
🟡 Base / Sideways Scenario (45% probability - Most Likely)
Range: $0.3000 - $0.3180
November 2026 target is $0.3060 by end of month, with $0.3000 support and $0.3180 resistance framing the monthly channel. TRX keeps grinding sideways while USDT usage grows.
Projected for 2026: Trade between $0.2950 and $0.3300, with December target $0.3180.
🔴 Bearish Scenario (25% probability)
Trigger: Daily close below $0.2973 / $0.3000 with volume
Target: $0.2901 (stop zone) -> $0.28 -> $0.26
This would break the 2026 base and signal TRX finally joining the broader market sell-off.
6. Long-Term Outlook
| Year | Forecast Range / Target |
| --- | --- |
| Nov 2026 | $0.3000 - $0.3180, target $0.3060 |
| Dec 2026 | $0.3180 target, up to $0.385 in optimistic models |
| 2027 | $0.385 |
| 2030 | $0.510 |
| 2040 | $1.000 |
These are model forecasts, not guarantees. TRX moves slowly - it took 7 years to go from $0.01 to $0.30.
7. Strategy Summary (Not Advice)
For Traders:
TRX is a range-trading coin, not a breakout coin right now
Buy zone: $0.2982 - $0.3036, Stop: $0.2901, First target: $0.3239
Sell / Short zone: Near $0.3110 - $0.3180 if rejected
Do not expect 20% moves - TRX moves 1-2% per day
For Long-Term Holders / Staking:
TRX is one of the few coins where staking + real usage supports price
Its strength is defensive: it falls less in bear markets
Its weakness is offensive: it pumps less in bull markets
TRX vs XRP Quick Comparison:
| | TRX | XRP |
| --- | --- | --- |
| YTD | +6.51% | -48.33% |
| Use Case | USDT settlement | Cross-border bank payments |
| Volatility | Very Low | Very High |
| Risk | Centralization / USDT | Regulation / ETF flows |
Want me to do:
TRX vs XRP - which is better to buy now head-to-head?
TRX 1H / 4H scalp levels with exact entry / SL / TP?
TRX staking calculator - how much you earn if you stake 10,000 TRX?
#TRX #TRXUpdate #TRX/USDT❤️ #trxanalysis #TradingCommunity
90

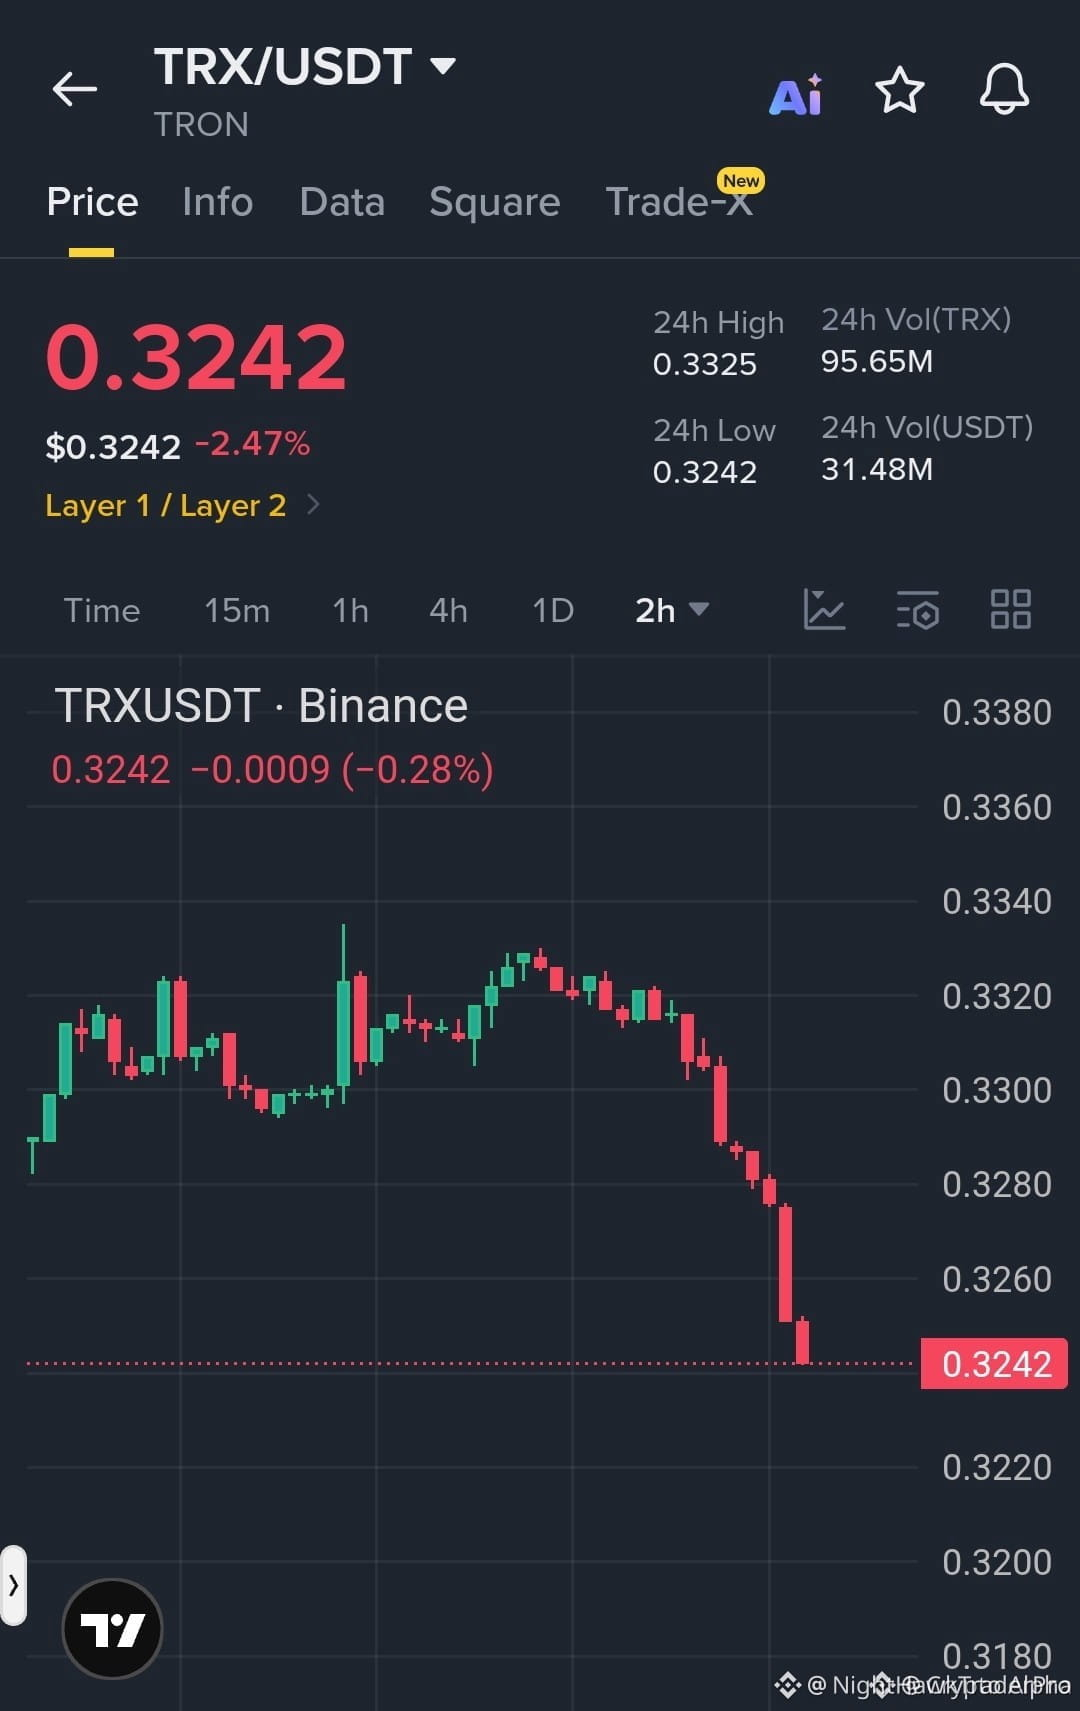
$TRX BREAKING DOWN — SELLERS ARE DROPPING THE HAMMER 💥🔴
Entry: $0.3240 – $0.3250 ⚡
Target 1: $0.3200 🎯
Target 2: $0.3175 💥
Stop Loss: $0.3275 ⚠️
📉 The structure is crumbling in real time. Each rejection at $0.3275 has been sharper, with volume surging on every red candle. 🐻 Sellers are stacking bids below—this isn't a dip, it’s a liquidity grab into the void. 🔴 Daily momentum flipped negative, and lower highs are stacking like dominos.
💡 The risk-to-reward on this breakdown is tight if you time the entry near resistance. Bears are treating every bounce as a gift. 💬 Are you shorting the retest or waiting for a full breakdown confirmation below $0.3200? 👇
⚠️ Not financial advice. Always manage your risk. 🛡️
🏷️ #TRX #ShortSetup #Breakdown #Crypto #TRXAnalysis
🎯 🐻
$TRX BREAKING DOWN — SELLERS ARE DROPPING THE HAMMER 💥🔴
Entry: $0.3240 – $0.3250 ⚡
Target 1: $0.3200 🎯
Target 2: $0.3175 💥
Stop Loss: $0.3275 ⚠️
📉 The structure is crumbling in real time. Each rejection at $0.3275 has been sharper, with volume surging on every red candle. 🐻 Sellers are stacking bids below—this isn't a dip, it’s a liquidity grab into the void. 🔴 Daily momentum flipped negative, and lower highs are stacking like dominos.
💡 The risk-to-reward on this breakdown is tight if you time the entry near resistance. Bears are treating every bounce as a gift. 💬 Are you shorting the retest or waiting for a full breakdown confirmation below $0.3200? 👇
⚠️ Not financial advice. Always manage your risk. 🛡️
🏷️ #TRX #ShortSetup #Breakdown #Crypto #TRXAnalysis
🎯 🐻
Entry: $0.3240 – $0.3250 ⚡
Target 1: $0.3200 🎯
Target 2: $0.3175 💥
Stop Loss: $0.3275 ⚠️
📉 The structure is crumbling in real time. Each rejection at $0.3275 has been sharper, with volume surging on every red candle. 🐻 Sellers are stacking bids below—this isn't a dip, it’s a liquidity grab into the void. 🔴 Daily momentum flipped negative, and lower highs are stacking like dominos.
💡 The risk-to-reward on this breakdown is tight if you time the entry near resistance. Bears are treating every bounce as a gift. 💬 Are you shorting the retest or waiting for a full breakdown confirmation below $0.3200? 👇
⚠️ Not financial advice. Always manage your risk. 🛡️
🏷️ #TRX #ShortSetup #Breakdown #Crypto #TRXAnalysis
🎯 🐻
40

·
--
Bearish
$TRX SHORT TRADE SETUP
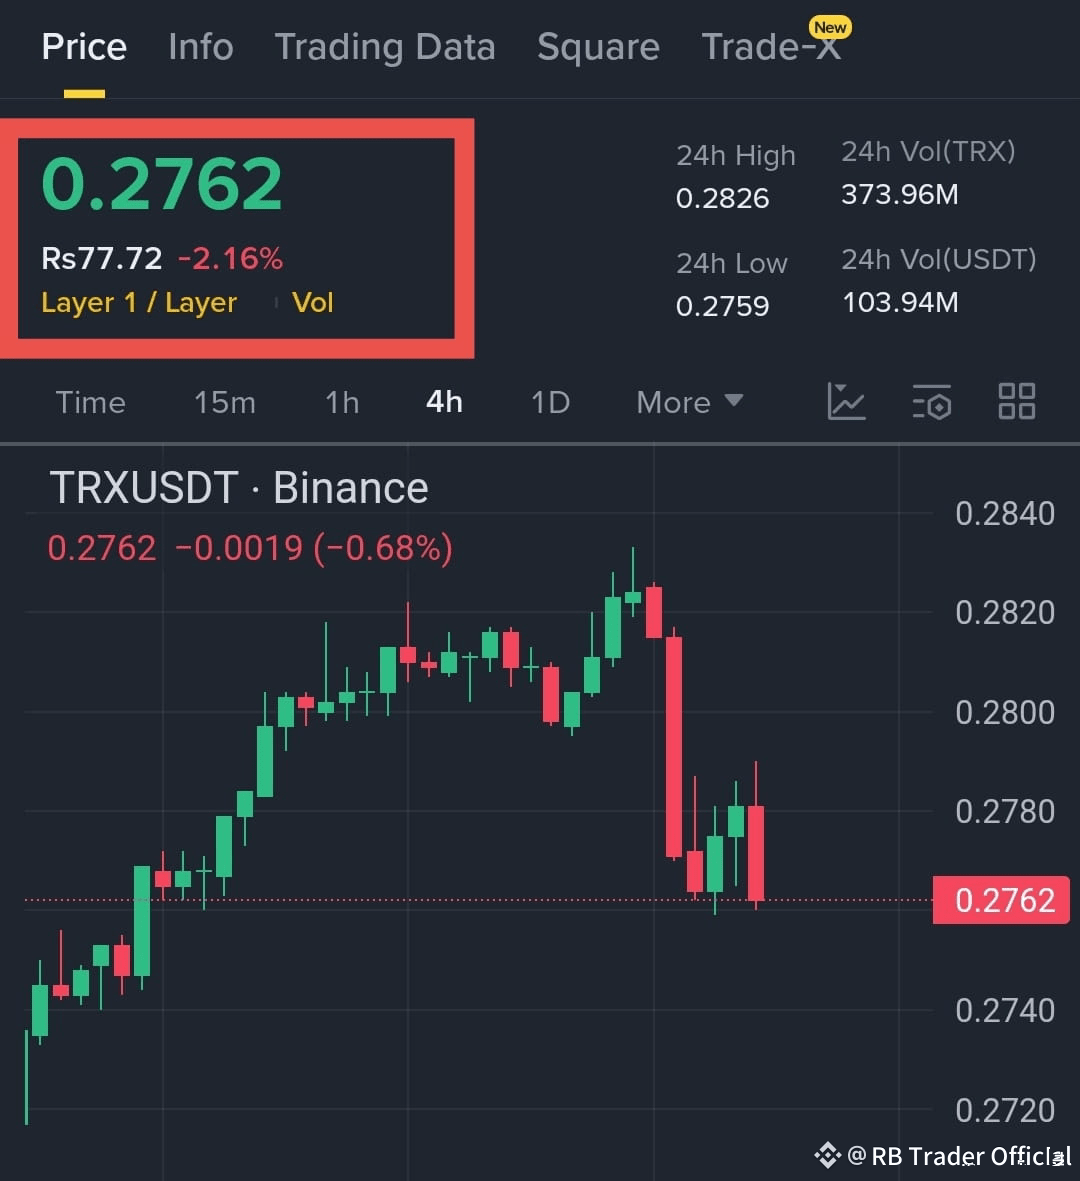
$TRX is showing clear rejection from the recent push toward 0.2820, and the last few 4H candles confirm selling pressure taking control again. Price failed to hold above support and slipped back into the lower zone, indicating bears are tightening momentum.
Market structure is turning weaker with every lower high, and the current pullback looks like a typical bearish continuation. If TRX stays below the rejection zone, further downside movement is highly likely.
Entry Zone
0.2760 – 0.2775
Targets
TP1: 0.2725
TP2: 0.2690
Stop Loss
0.2810
#TRXAnalysis #CryptoTrades
$TRX SHORT TRADE SETUP
$TRX is showing clear rejection from the recent push toward 0.2820, and the last few 4H candles confirm selling pressure taking control again. Price failed to hold above support and slipped back into the lower zone, indicating bears are tightening momentum.
Market structure is turning weaker with every lower high, and the current pullback looks like a typical bearish continuation. If TRX stays below the rejection zone, further downside movement is highly likely.
Entry Zone
0.2760 – 0.2775
Targets
TP1: 0.2725
TP2: 0.2690
Stop Loss
0.2810
#TRXAnalysis #CryptoTrades
$TRX is showing clear rejection from the recent push toward 0.2820, and the last few 4H candles confirm selling pressure taking control again. Price failed to hold above support and slipped back into the lower zone, indicating bears are tightening momentum.
Market structure is turning weaker with every lower high, and the current pullback looks like a typical bearish continuation. If TRX stays below the rejection zone, further downside movement is highly likely.
Entry Zone
0.2760 – 0.2775
Targets
TP1: 0.2725
TP2: 0.2690
Stop Loss
0.2810
#TRXAnalysis #CryptoTrades
1
126

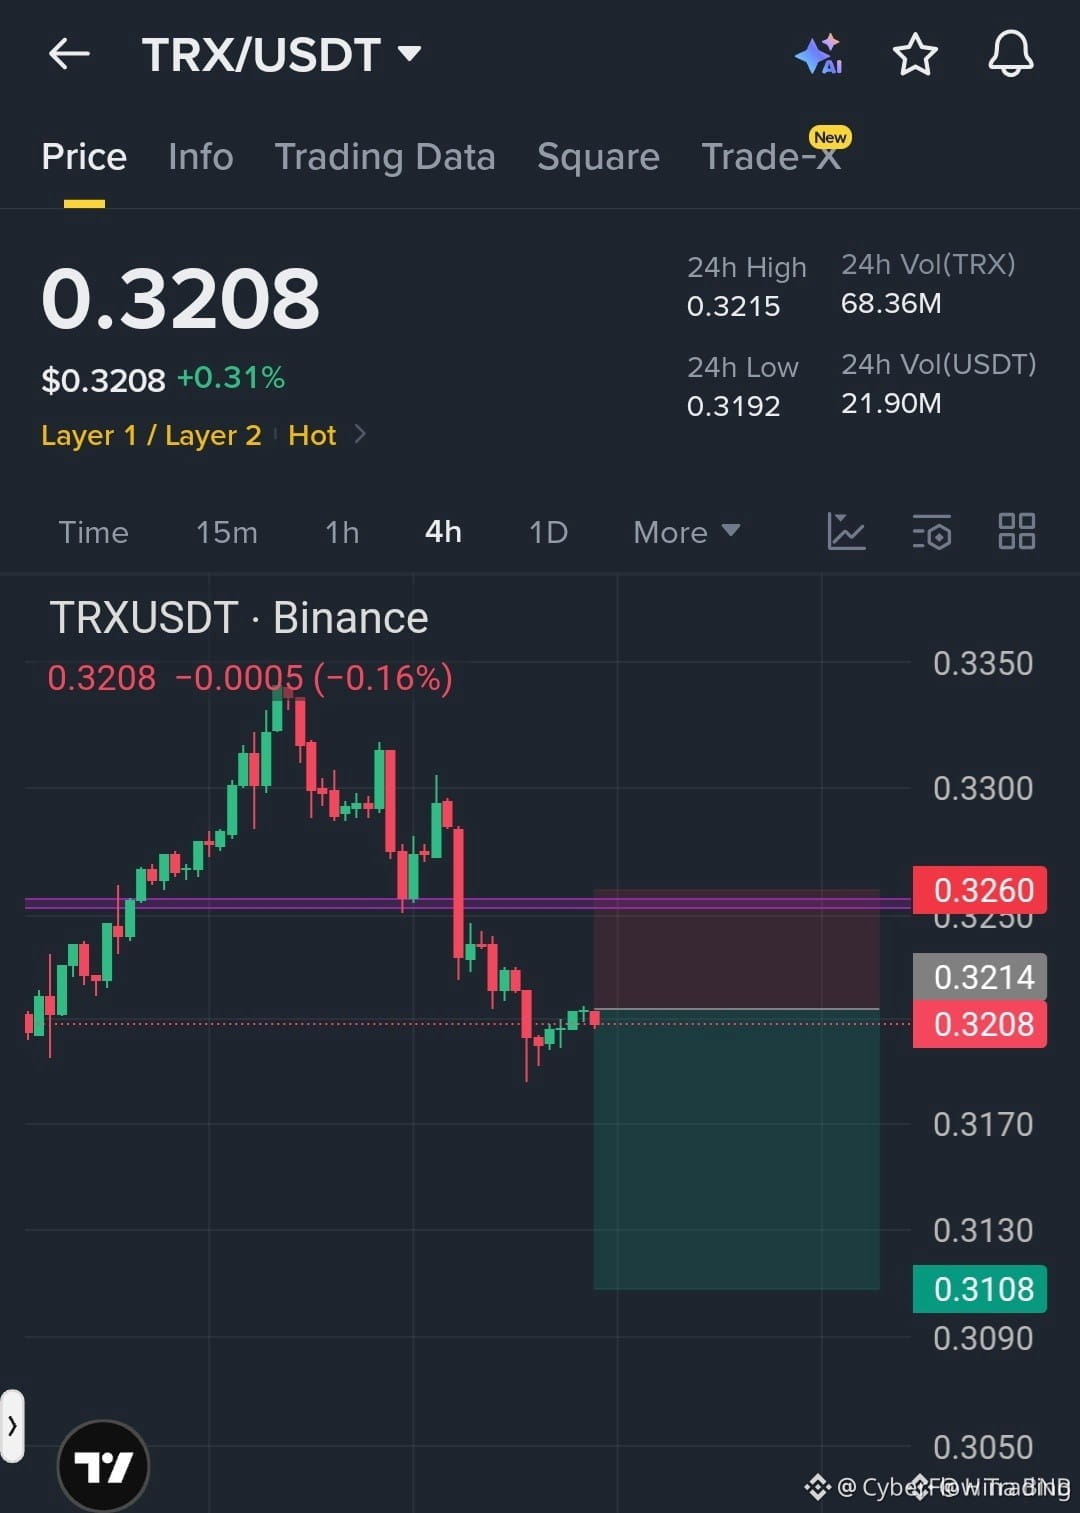
$TRX JUST LOST KEY SUPPORT – SHORT PRESSURE BUILDING 🚨
Entry: 0.3205 🔥
Target: 0.3170 🚀
Stop Loss: 0.3260 ⚠️
TRX broke down hard from resistance and is now trading below a major zone I’ve been watching all week. The structure flipped bearish and sellers are holding the bid firmly. Volume is picking up on the 1H, and as long as price stays under the stop-loss level, the path of least resistance is lower.
The risk-to-reward on the first target alone is solid, and with multiple profit zones stacked below, this setup has room to run. Are you shorting this or waiting for a retest of the breakdown level?
Not financial advice. Always manage your risk.
#TRX #ShortSetup #Bearish #Crypto #TRXAnalysis
🚨
$TRX JUST LOST KEY SUPPORT – SHORT PRESSURE BUILDING 🚨
Entry: 0.3205 🔥
Target: 0.3170 🚀
Stop Loss: 0.3260 ⚠️
TRX broke down hard from resistance and is now trading below a major zone I’ve been watching all week. The structure flipped bearish and sellers are holding the bid firmly. Volume is picking up on the 1H, and as long as price stays under the stop-loss level, the path of least resistance is lower.
The risk-to-reward on the first target alone is solid, and with multiple profit zones stacked below, this setup has room to run. Are you shorting this or waiting for a retest of the breakdown level?
Not financial advice. Always manage your risk.
#TRX #ShortSetup #Bearish #Crypto #TRXAnalysis
🚨
Entry: 0.3205 🔥
Target: 0.3170 🚀
Stop Loss: 0.3260 ⚠️
TRX broke down hard from resistance and is now trading below a major zone I’ve been watching all week. The structure flipped bearish and sellers are holding the bid firmly. Volume is picking up on the 1H, and as long as price stays under the stop-loss level, the path of least resistance is lower.
The risk-to-reward on the first target alone is solid, and with multiple profit zones stacked below, this setup has room to run. Are you shorting this or waiting for a retest of the breakdown level?
Not financial advice. Always manage your risk.
#TRX #ShortSetup #Bearish #Crypto #TRXAnalysis
🚨
33
Log in to explore more content
Join global crypto users on Binance Square
⚡️ Get latest and useful information about crypto.
💬 Trusted by the world’s largest crypto exchange.
👍 Discover real insights from verified creators.
Email / Phone number
Trending Topics
1
#NvidiaBeatsEstimatesWith$130BQ4Outlook
17,261 views
208 Discussing
2
#AnthropicIPOPriceCouldExceed$80
22,019 views
179 Discussing
3
#RussiaCentralBankAddsAlfaBankToCryptoExchangeRegister
0 views
11 Discussing
4
#RussianCentralBankPlansToAllowFundsToHoldCryptoIn2027
0 views
6 Discussing
5
#VisaPlansStablecoinPrefundingForAPACCrossBorderPayments
0 views
9 Discussing
6
#CanNvidia’sDataCenterGrowthContinue?
65,350 views
987 Discussing
7
#CanadaAndUSLaunchOperationNiagaraAgainstApprovalPhishing
5,807 views
47 Discussing
8
#BankOfEnglandUnveilsClearingHousePathwayCoveringDLTFirms
2,628 views
55 Discussing
9
#DBSAndCirclePartnerToExpandAsianInstitutionsUSDCAccess
3,856 views
60 Discussing
10
#LedgerHardwareImplantReportsExtendToDubai
31,123 views
491 Discussing