ppishockwave

23.5M views
13,607 Discussing
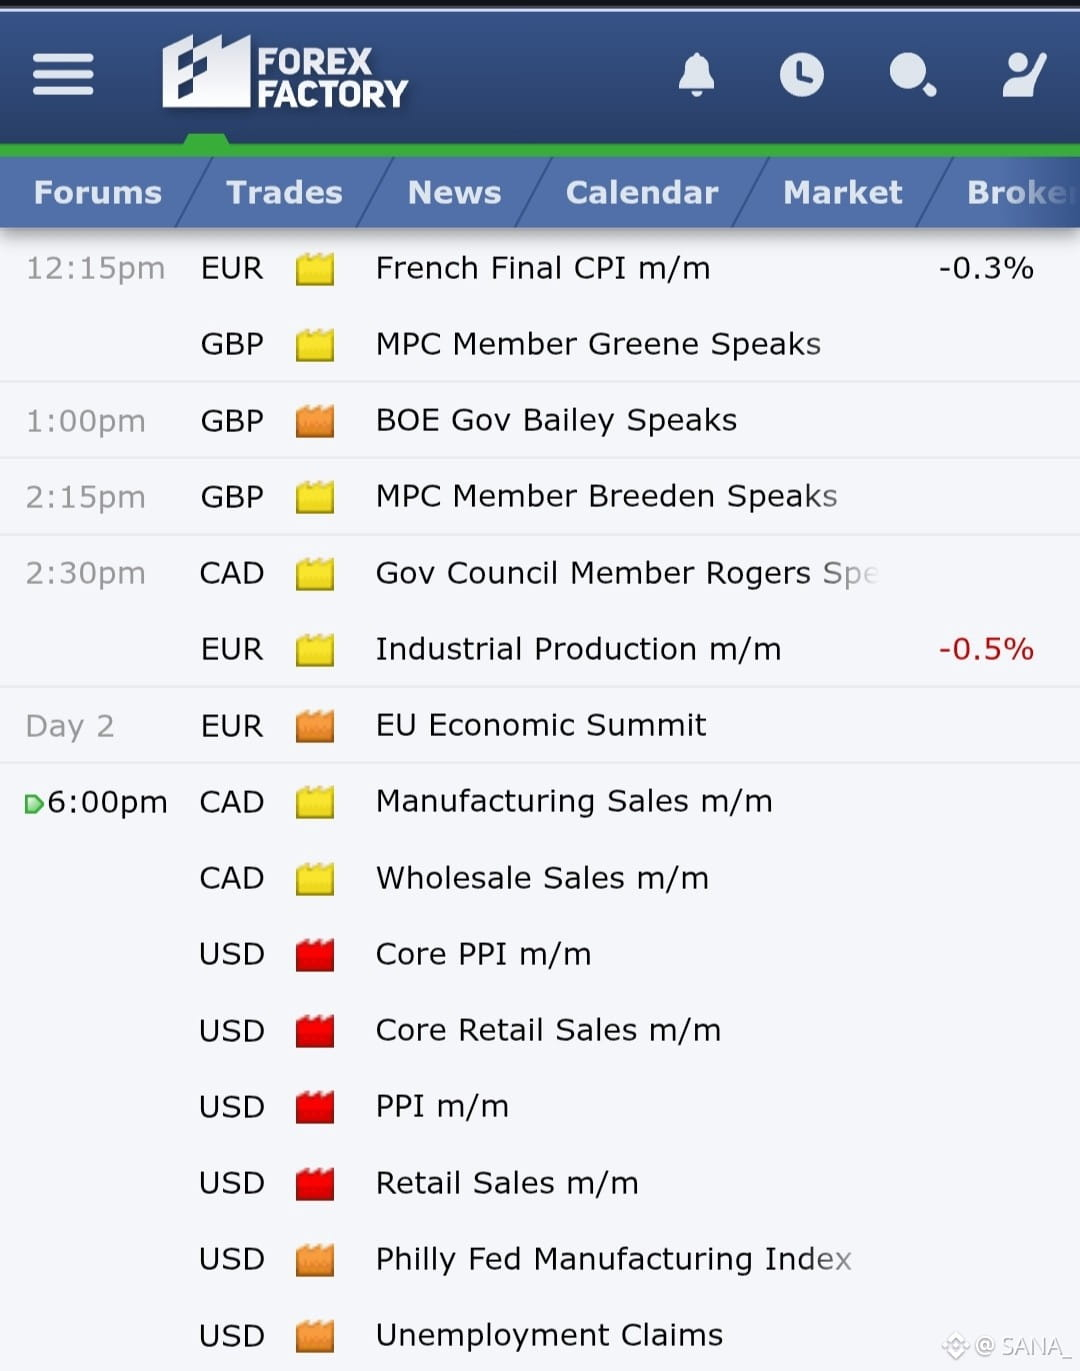
U.S. January PPI jumps 3.5% YoY—the biggest surge since Feb 2023! Monthly PPI also beats expectations, rising 0.4% vs. 0.3% forecast. What does this mean for Bitcoin & markets? - Higher inflation = Fed may delay rate cuts - DXY & Treasury yields could spike - BTC’s role as an inflation hedge in focus Will this fuel more volatility or push BTC higher?
Binance News
·
--
U.S. January PPI Shows Significant IncreaseAccording to BlockBeats, the U.S. Producer Price Index (PPI) for January recorded a year-on-year increase of 3.5%, marking the largest rise since February 2023. The monthly PPI for January rose by 0.4%, surpassing market expectations of a 0.3% increase.

U.S. January PPI Shows Significant Increase

According to BlockBeats, the U.S. Producer Price Index (PPI) for January recorded a year-on-year increase of 3.5%, marking the largest rise since February 2023. The monthly PPI for January rose by 0.4%, surpassing market expectations of a 0.3% increase.
·
--
$BTC Breaks Below 69K: What’s happening, and what comes next? 👇 🎯 Touched 68.268 at noon today, down 3.8% since morning Lowest since August 1ïžâƒŁ Hot U.S. CPI → 89% chance of a Fed rate hike in December 2ïžâƒŁ USD at a ~19-month high, 10-year yield near 5% 3ïžâƒŁ Stablecoins down $14.2 billion in 30 days 4ïžâƒŁ Recent buyers are down ~9%, making them more likely to sell on a rebound ⚖ Bright spot: mid-sized whales are accumulating 🔭 Next 12 hours: 2 scenarios around PPI (20:30 Vietnam time) ‱ Before PPI: likely to move sideways, sweeping both sides of 68K–70.5K ‱ Hotter-than-expected PPI → 66.9K–68K could be tested ‱ In-line or cooler PPI → could rebound to 70.5K–71.5K → 72.7K and 75.6K remain major resistance zones above 💬 Which scenario do you lean toward: đŸ…°ïž Hot PPI or đŸ…±ïž Cool PPI? Market observation only, not investment advice. #CryptoTrading #PPIShockwave
$BTC Breaks Below 69K: What’s happening, and what comes next? 👇

🎯 Touched 68.268 at noon today, down 3.8% since morning
Lowest since August

1ïžâƒŁ Hot U.S. CPI → 89% chance of a Fed rate hike in December
2ïžâƒŁ USD at a ~19-month high, 10-year yield near 5%
3ïžâƒŁ Stablecoins down $14.2 billion in 30 days
4ïžâƒŁ Recent buyers are down ~9%, making them more likely to sell on a rebound

⚖ Bright spot: mid-sized whales are accumulating

🔭 Next 12 hours: 2 scenarios around PPI (20:30 Vietnam time)
‱ Before PPI: likely to move sideways, sweeping both sides of 68K–70.5K
‱ Hotter-than-expected PPI → 66.9K–68K could be tested
‱ In-line or cooler PPI → could rebound to 70.5K–71.5K
→ 72.7K and 75.6K remain major resistance zones above

💬 Which scenario do you lean toward: đŸ…°ïž Hot PPI or đŸ…±ïž Cool PPI?

Market observation only, not investment advice.
#CryptoTrading #PPIShockwave
·
--
Bullish
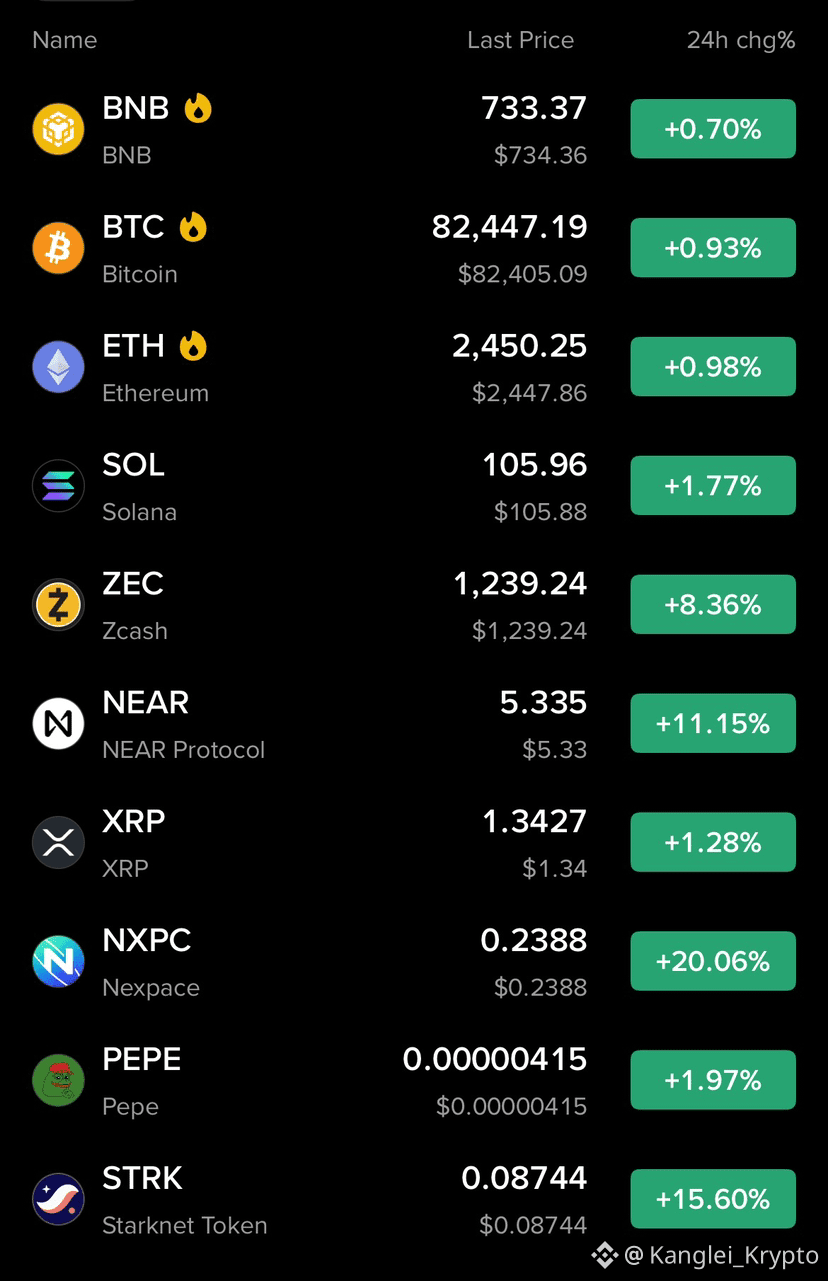
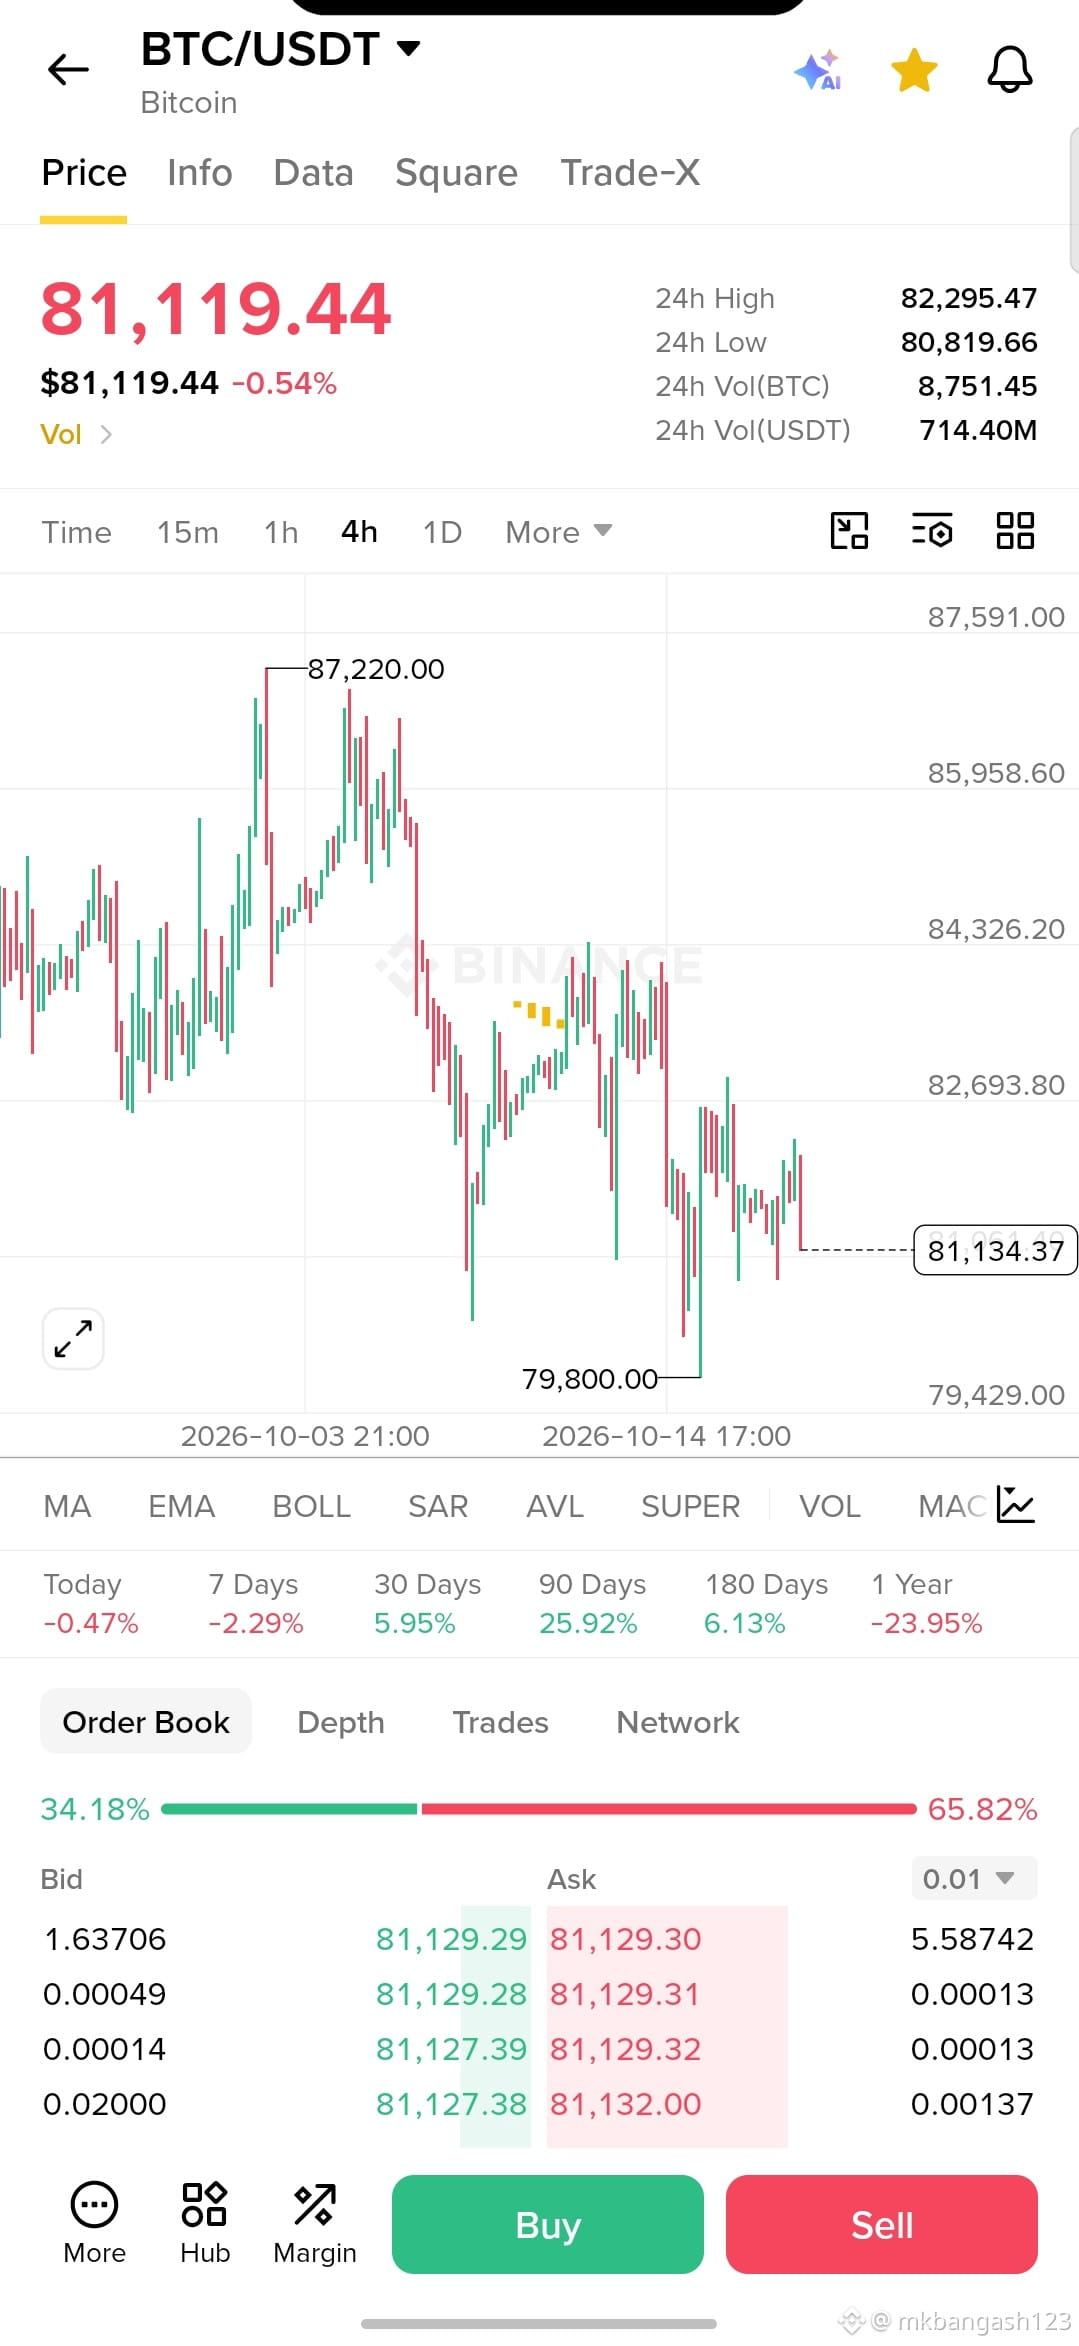
đŸ”„ HOT CPI. HOTTER PPI. CRYPTO JUST TURNED GREEN. #Uptober finally starting—or is this the fake-out nobody saw coming? 👀 The last 24 hours have been a macro rollercoaster. After September U.S. CPI on October 14 and today’s October 15 PPI, crypto initially showed weakness. Then suddenly—the board flipped green. Current snapshot: BTC ~$82.4K | ETH ~$2.45K | SOL ~$106, with several altcoins outperforming BTC. But here’s the part I find interesting: 1ïžâƒŁ Price reaction matters. Crypto absorbed negative inflation headlines and still bounced. That suggests buyers are willing to step in—but one rebound doesn’t confirm a trend. 2ïžâƒŁ Altcoin breadth is catching attention. NEAR, STRK, ZEC and other alts are moving much faster than BTC right now. If that strength broadens and persists, the market structure becomes more interesting. 3ïžâƒŁ The contrarian view: Green candles after bad macro data aren’t automatically bullish. This could be short-covering, positioning, or a liquidity-driven bounce rather than fresh conviction. 🟱 Bullish: BTC resilience + improving altcoin participation. 🔮 Risk: Sticky inflation could keep rate expectations restrictive and volatility elevated. So I’m watching follow-through, not just today’s green screen. Uptober—or simply a very convincing fake-out? 👇 What are you seeing: genuine accumulation or just a relief bounce? #CPIWatch #PPIShockwave #WarshPushesToScaleBackForwardGuidanceAndDotPlot $ZEC $BTC $BNB
đŸ”„ HOT CPI. HOTTER PPI. CRYPTO JUST TURNED GREEN.

#Uptober finally starting—or is this the fake-out nobody saw coming? 👀

The last 24 hours have been a macro rollercoaster.

After September U.S. CPI on October 14 and today’s October 15 PPI, crypto initially showed weakness. Then suddenly—the board flipped green.

Current snapshot: BTC ~$82.4K | ETH ~$2.45K | SOL ~$106, with several altcoins outperforming BTC.

But here’s the part I find interesting:

1ïžâƒŁ Price reaction matters.
Crypto absorbed negative inflation headlines and still bounced. That suggests buyers are willing to step in—but one rebound doesn’t confirm a trend.

2ïžâƒŁ Altcoin breadth is catching attention.
NEAR, STRK, ZEC and other alts are moving much faster than BTC right now. If that strength broadens and persists, the market structure becomes more interesting.

3ïžâƒŁ The contrarian view:
Green candles after bad macro data aren’t automatically bullish. This could be short-covering, positioning, or a liquidity-driven bounce rather than fresh conviction.

🟱 Bullish: BTC resilience + improving altcoin participation.

🔮 Risk: Sticky inflation could keep rate expectations restrictive and volatility elevated.

So I’m watching follow-through, not just today’s green screen.

Uptober—or simply a very convincing fake-out?

👇 What are you seeing: genuine accumulation or just a relief bounce?

#CPIWatch #PPIShockwave #WarshPushesToScaleBackForwardGuidanceAndDotPlot $ZEC $BTC $BNB
·
--
Bearish
Producer Price Index (PPI)😁 September 2026 U.S. PPI Breakdown ‱ Headline PPI (MoM): Increased by +1.3% compared to a consensus estimate of +0.5% (and a revised +0.5% in August). ‱ Headline PPI (YoY): Reached +6.3% compared to a consensus estimate of +5.4% (and +5.6% prior). ‱ Core PPI (MoM) — ex-food & energy: Rose +0.7% against a +0.3% consensus expectation (up from +0.2% in August). ‱ Core PPI (YoY): Climbed +5.0% compared to a +4.5% consensus estimate (and +4.8% prior). #GOLD_UPDATE #PPIShockwave $XAUT
Producer Price Index (PPI)😁
September 2026 U.S. PPI Breakdown

‱ Headline PPI (MoM): Increased by +1.3% compared to a consensus estimate of +0.5% (and a revised +0.5% in August).
‱ Headline PPI (YoY): Reached +6.3% compared to a consensus estimate of +5.4% (and +5.6% prior).
‱ Core PPI (MoM) — ex-food & energy: Rose +0.7% against a +0.3% consensus expectation (up from +0.2% in August).
‱ Core PPI (YoY): Climbed +5.0% compared to a +4.5% consensus estimate (and +4.8% prior).
#GOLD_UPDATE
#PPIShockwave
$XAUT
đŸ‡ș🇾 US Economic Data Shakes the Gold Market! đŸ„‡đŸ“Š The latest US economic reports have triggered significant volatility in the gold market. 📌 Key US Data — September 2026 PPI: +1.3% MoM vs. +0.6% expected Retail Sales: +0.8% MoM vs. +0.3% expected Initial Jobless Claims: 199K vs. 200K expected đŸ”„ Why Does It Matter? Higher-than-expected producer inflation and stronger retail sales may support expectations for tighter Federal Reserve policy. However, the US dollar weakened despite the data, while Treasury yields also faced pressure. This mixed reaction kept markets volatile. 📈 Gold Price Reaction Gold surged to $4,172/oz following the news, then pulled back to around $4,163/oz. The next move may depend on the US dollar, Treasury yields, and changing Fed rate expectations. 👇 What's next for gold — $4,200 or a deeper correction? #GoldenOpportunity #xauusdtrading #USInflation #PPIShockwave #RetailSales #FederalReserve #Trading
đŸ‡ș🇾 US Economic Data Shakes the Gold Market! đŸ„‡đŸ“Š

The latest US economic reports have triggered significant volatility in the gold market.

📌 Key US Data — September 2026

PPI: +1.3% MoM vs. +0.6% expected

Retail Sales: +0.8% MoM vs. +0.3% expected

Initial Jobless Claims: 199K vs. 200K expected

đŸ”„ Why Does It Matter?

Higher-than-expected producer inflation and stronger retail sales may support expectations for tighter Federal Reserve policy. However, the US dollar weakened despite the data, while Treasury yields also faced pressure. This mixed reaction kept markets volatile.

📈 Gold Price Reaction
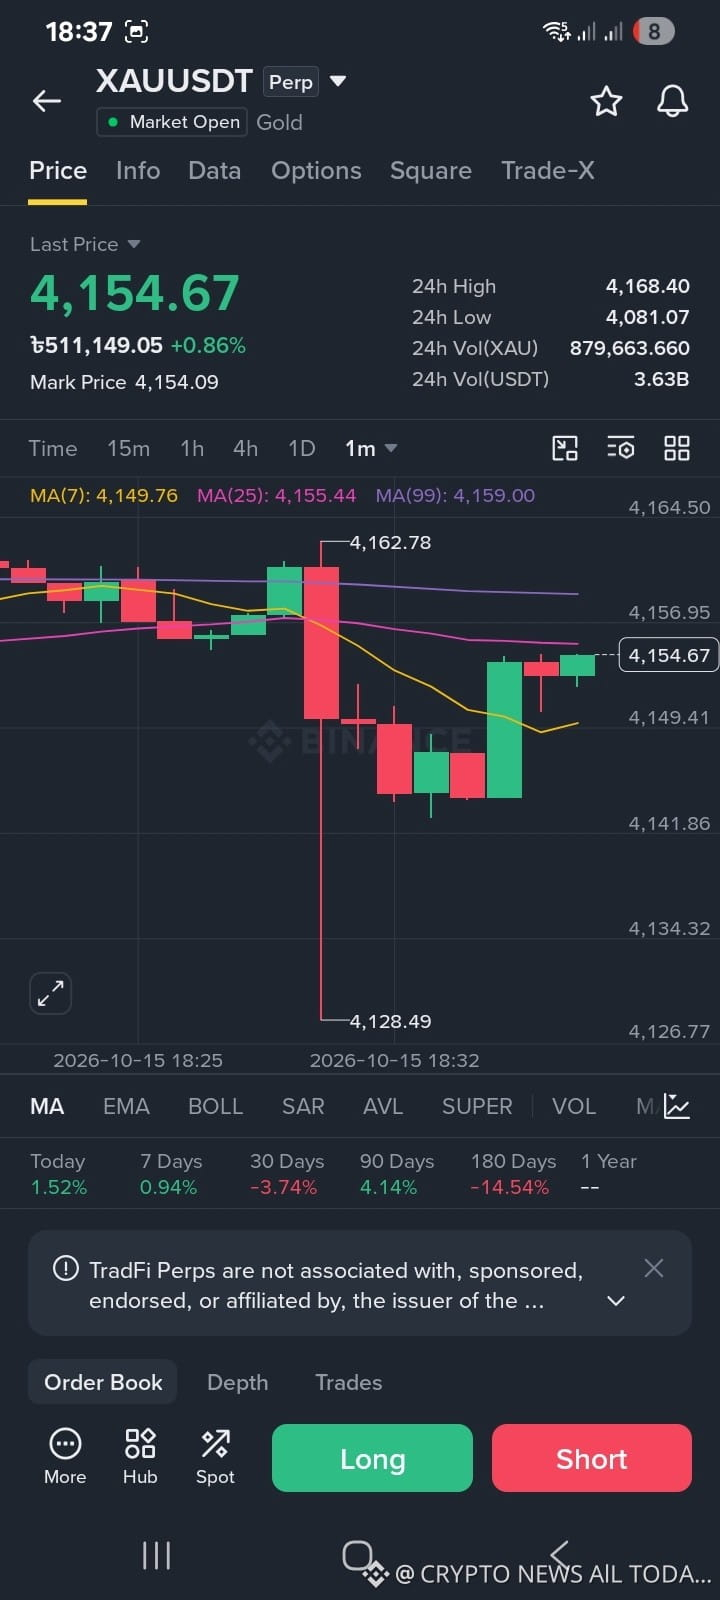
Gold surged to $4,172/oz following the news, then pulled back to around $4,163/oz.

The next move may depend on the US dollar, Treasury yields, and changing Fed rate expectations.

👇 What's next for gold — $4,200 or a deeper correction?

#GoldenOpportunity #xauusdtrading #USInflation #PPIShockwave #RetailSales #FederalReserve #Trading
·
--
Bullish
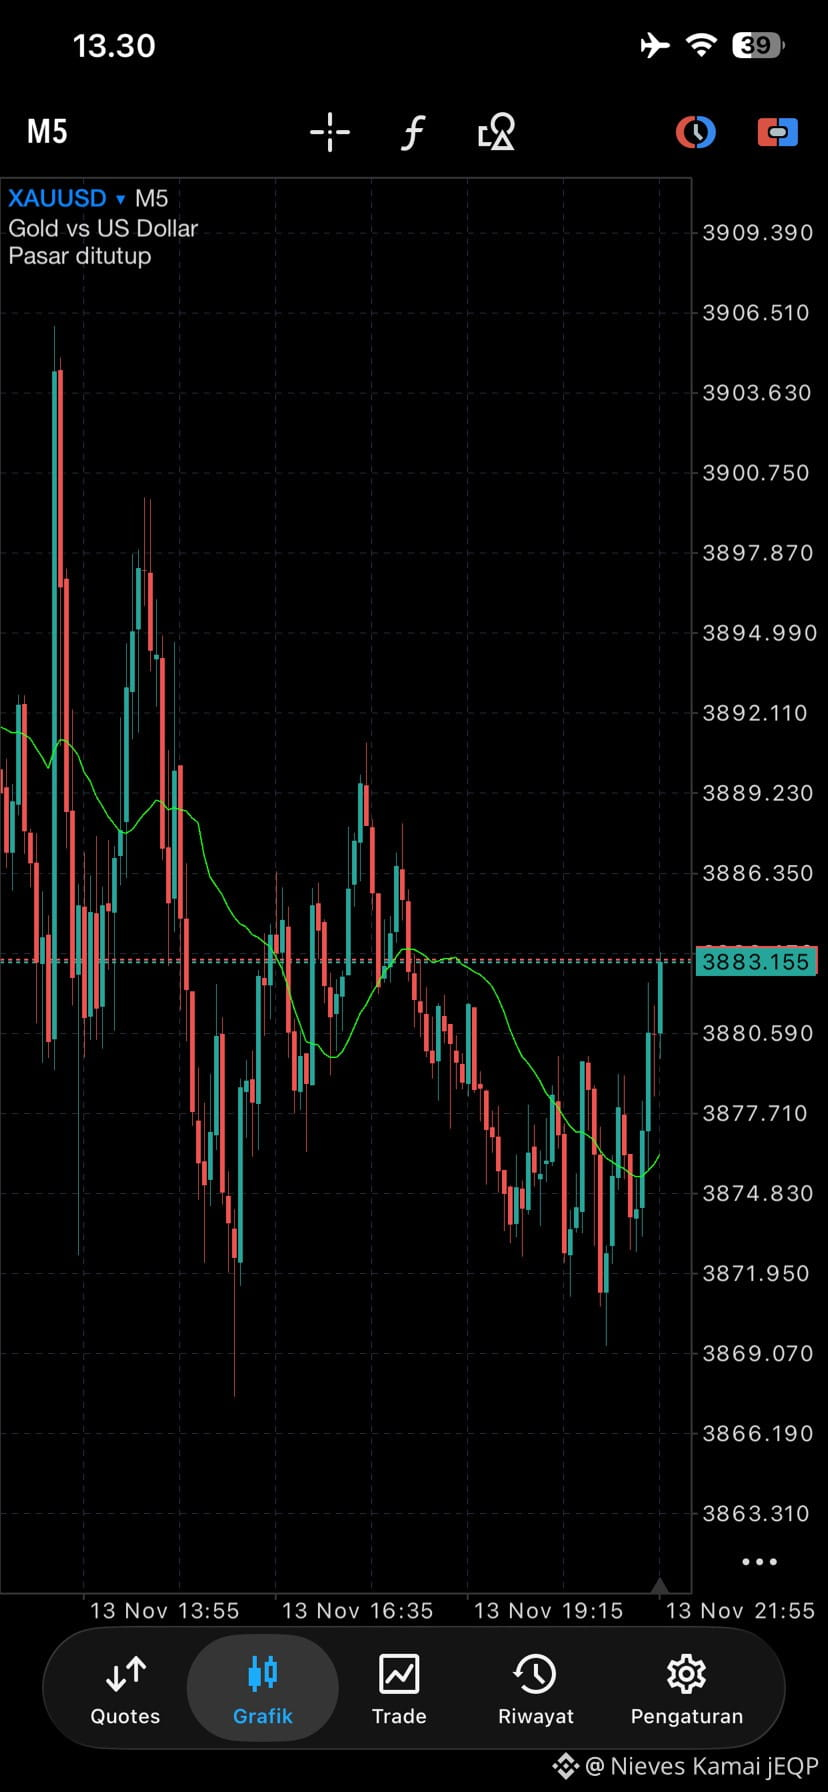
$XAU Will gold make a drastic rise after a crazy drop” an #PPIShockwave
What will Gold (XAUUSD) hit in November 2026?

What will Gold (XAUUSD) hit in November 2026?

↓ $4,00099%↓ $3,90099%↓ $3,80099%
Volume $302.94
Log in to explore more content
Join global crypto users on Binance Square
âšĄïž Get latest and useful information about crypto.
💬 Trusted by the world’s largest crypto exchange.
👍 Discover real insights from verified creators.
Email / Phone number