

#matrixfamily
matrixfamily
23,908 views
364 Discussing
Hot
Latest

#MatrixFamily listen to me carefully…..🔥💥
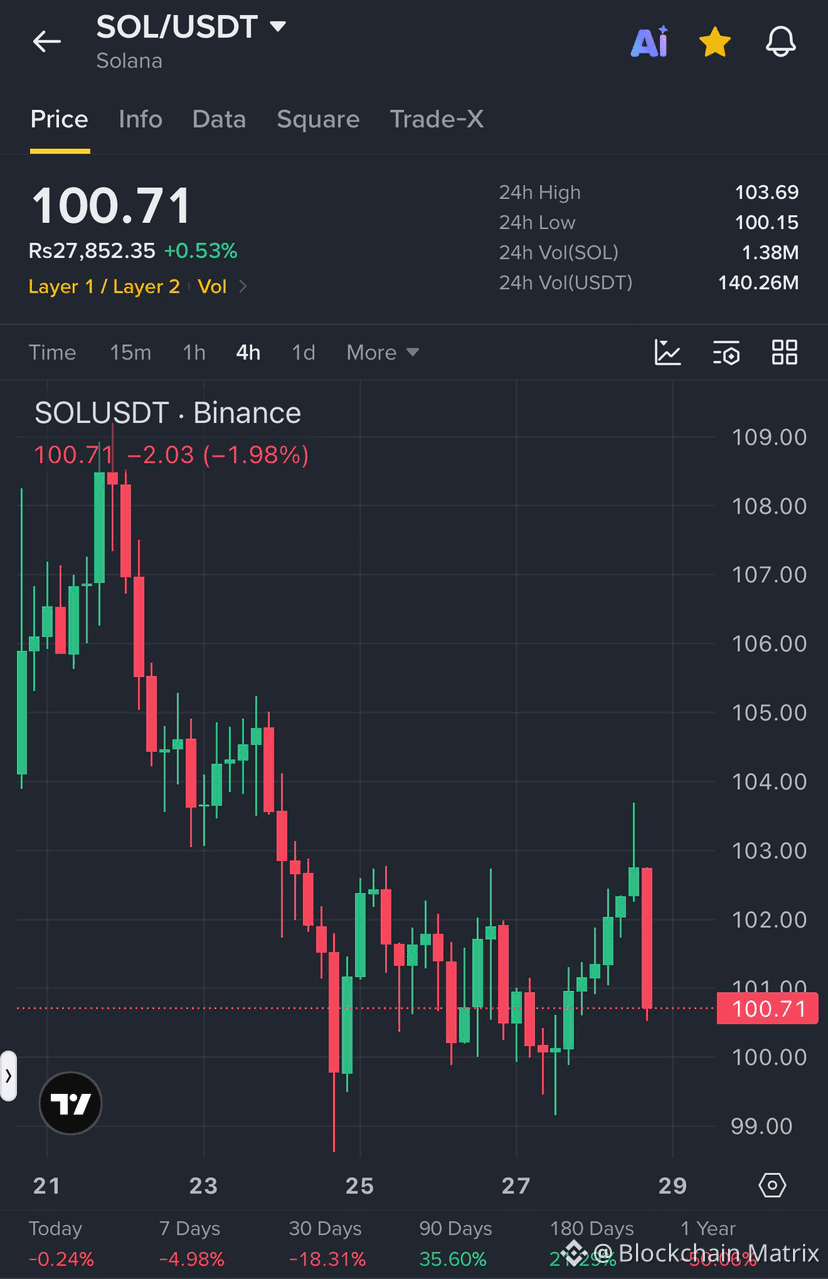
$SOL is facing renewed selling pressure on the 4H chart after a sharp rejection near $102.80. The price is currently around $100.71, and sellers could push for another breakdown if the $100 support zone fails.
$SOL SHORT TRADE SETUP
Entry Range: $100.70 – $101.30
Stop Loss: $102.20
TP1: $100.00
TP2: $99.00
TP3: $98.00
Market Analysis:
$SOL remains in a broader short-term downtrend, with lower highs and lower lows visible on the 4H chart. The recent recovery toward $103 failed, followed by a strong bearish candle that brought price back toward $100.70. A confirmed breakdown below $100 could open the way toward $99 and $98.
{spot}(SOLUSDT)
#MatrixFamily listen to me carefully…..🔥💥
$SOL is facing renewed selling pressure on the 4H chart after a sharp rejection near $102.80. The price is currently around $100.71, and sellers could push for another breakdown if the $100 support zone fails.
$SOL SHORT TRADE SETUP
Entry Range: $100.70 – $101.30
Stop Loss: $102.20
TP1: $100.00
TP2: $99.00
TP3: $98.00
Market Analysis:
$SOL remains in a broader short-term downtrend, with lower highs and lower lows visible on the 4H chart. The recent recovery toward $103 failed, followed by a strong bearish candle that brought price back toward $100.70. A confirmed breakdown below $100 could open the way toward $99 and $98.
84
·
--
Bullish
#MatrixFamily listen to me carefully…
$DELLB BULLISH BREAKOUT: Strong Buyers Push Price Above $500
Entry Range: $498 – $502
Stop Loss: $490
Targets:
TP1: $507
TP2: $515
TP3: $525
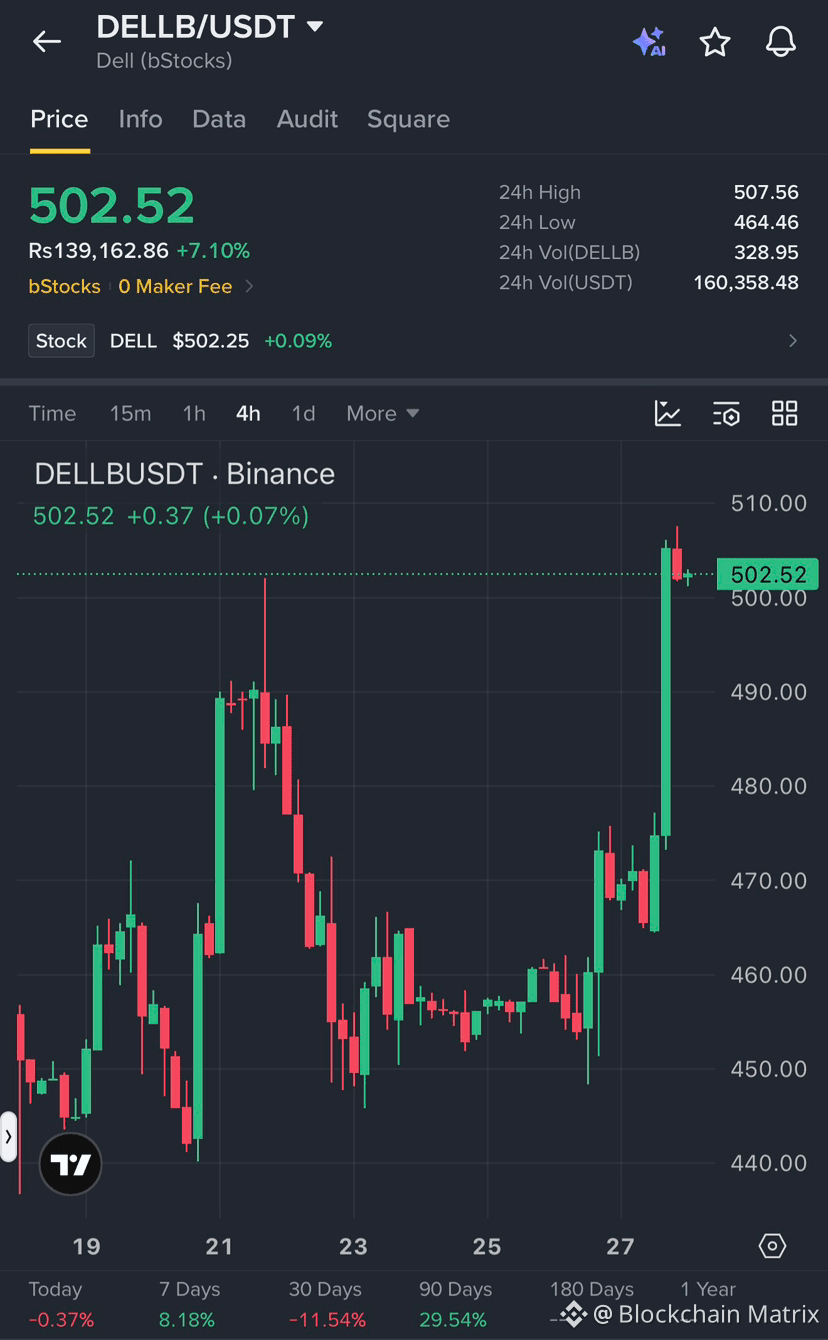
$DELLB is showing strong bullish momentum on the 4-hour chart after a powerful breakout from the $470–$475 resistance zone. Price has surged toward $502.52, and buyers are attempting to hold the psychological $500 level.
If $DELLB maintains support above $498–$500 and breaks through the recent high of $507.56, further upside toward $515 and $525 could become possible. However, after such a sharp move, a pullback or profit-taking is also possible, so avoid chasing the price without confirmation.
Invalidation: A decisive breakdown below $490 would weaken the bullish setup.
{spot}(DELLBUSDT)
#MatrixFamily listen to me carefully…
$DELLB BULLISH BREAKOUT: Strong Buyers Push Price Above $500
Entry Range: $498 – $502
Stop Loss: $490
Targets:
TP1: $507
TP2: $515
TP3: $525
$DELLB is showing strong bullish momentum on the 4-hour chart after a powerful breakout from the $470–$475 resistance zone. Price has surged toward $502.52, and buyers are attempting to hold the psychological $500 level.
If $DELLB maintains support above $498–$500 and breaks through the recent high of $507.56, further upside toward $515 and $525 could become possible. However, after such a sharp move, a pullback or profit-taking is also possible, so avoid chasing the price without confirmation.
Invalidation: A decisive breakdown below $490 would weaken the bullish setup.
36
·
--
Bullish
#MatrixFamily listen to me carefully…
$OSMO BULLISH BREAKOUT: Strong Momentum Pushes Price Toward $0.0670
Entry Range: $0.0585 – $0.0600
Stop Loss: $0.0565
Targets:
TP1: $0.0615
TP2: $0.0635
TP3: $0.0670
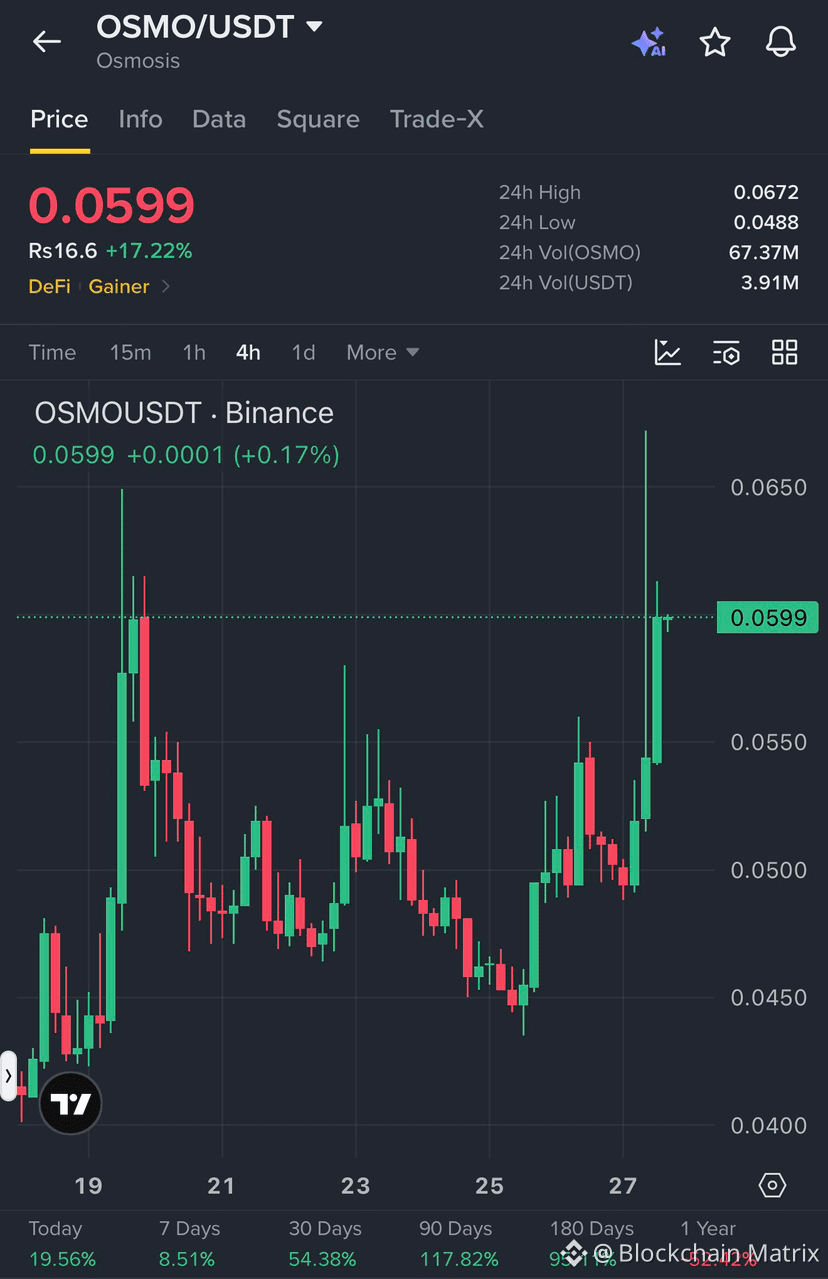
$OSMO is showing strong bullish momentum on the 4-hour chart after breaking above the $0.0500 resistance zone. The sharp upward move and increased buying pressure suggest that buyers are currently in control.
Price is trading near $0.0599 after reaching a 24-hour high of $0.0672. A sustained hold above $0.0585 could support another move toward $0.0615 and $0.0635, while a breakout above $0.0635 may open the way toward $0.0670.
Avoid chasing the sudden pump. A pullback and confirmation above support would offer a more controlled entry.
Invalidation: A decisive breakdown below $0.0565 would weaken the bullish setup.
{spot}(OSMOUSDT)
#MatrixFamily listen to me carefully…
$OSMO BULLISH BREAKOUT: Strong Momentum Pushes Price Toward $0.0670
Entry Range: $0.0585 – $0.0600
Stop Loss: $0.0565
Targets:
TP1: $0.0615
TP2: $0.0635
TP3: $0.0670
$OSMO is showing strong bullish momentum on the 4-hour chart after breaking above the $0.0500 resistance zone. The sharp upward move and increased buying pressure suggest that buyers are currently in control.
Price is trading near $0.0599 after reaching a 24-hour high of $0.0672. A sustained hold above $0.0585 could support another move toward $0.0615 and $0.0635, while a breakout above $0.0635 may open the way toward $0.0670.
Avoid chasing the sudden pump. A pullback and confirmation above support would offer a more controlled entry.
Invalidation: A decisive breakdown below $0.0565 would weaken the bullish setup.
137
·
--
Bullish
#MatrixFamily listen to me carefully…
$BANK BULLISH BREAKOUT: Buyers Are Pushing Price Toward $0.0300
Entry Range: $0.0285 – $0.0292
Stop Loss: $0.0274
Targets:
TP1: $0.0298
TP2: $0.0305
TP3: $0.0315
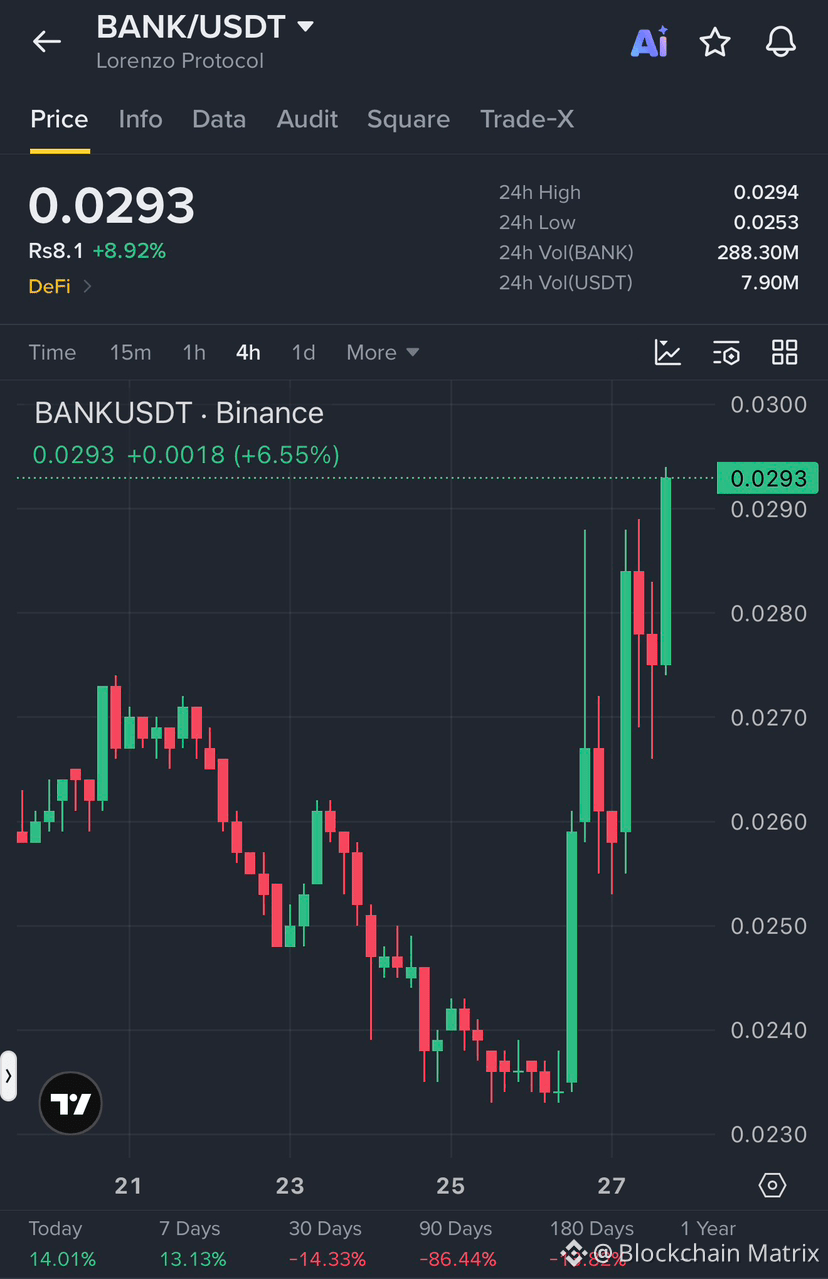
$BANK is showing strong bullish momentum on the 4-hour chart after recovering from the $0.0235 support area. A sharp upward move has pushed the price toward $0.0293, with buyers challenging the $0.0294–$0.0300 resistance zone.
If BANK breaks above $0.0300 and holds the level, further upside toward $0.0305 and $0.0315 could become possible. However, the price has already moved sharply, so a pullback toward the entry zone may offer a better opportunity than chasing the current candle.
Invalidation: A decisive breakdown below $0.0274 would weaken the bullish setup.
{spot}(BANKUSDT)
#MatrixFamily listen to me carefully…
$BANK BULLISH BREAKOUT: Buyers Are Pushing Price Toward $0.0300
Entry Range: $0.0285 – $0.0292
Stop Loss: $0.0274
Targets:
TP1: $0.0298
TP2: $0.0305
TP3: $0.0315
$BANK is showing strong bullish momentum on the 4-hour chart after recovering from the $0.0235 support area. A sharp upward move has pushed the price toward $0.0293, with buyers challenging the $0.0294–$0.0300 resistance zone.
If BANK breaks above $0.0300 and holds the level, further upside toward $0.0305 and $0.0315 could become possible. However, the price has already moved sharply, so a pullback toward the entry zone may offer a better opportunity than chasing the current candle.
Invalidation: A decisive breakdown below $0.0274 would weaken the bullish setup.
1
523
#MatrixFamily listen to me carefully…
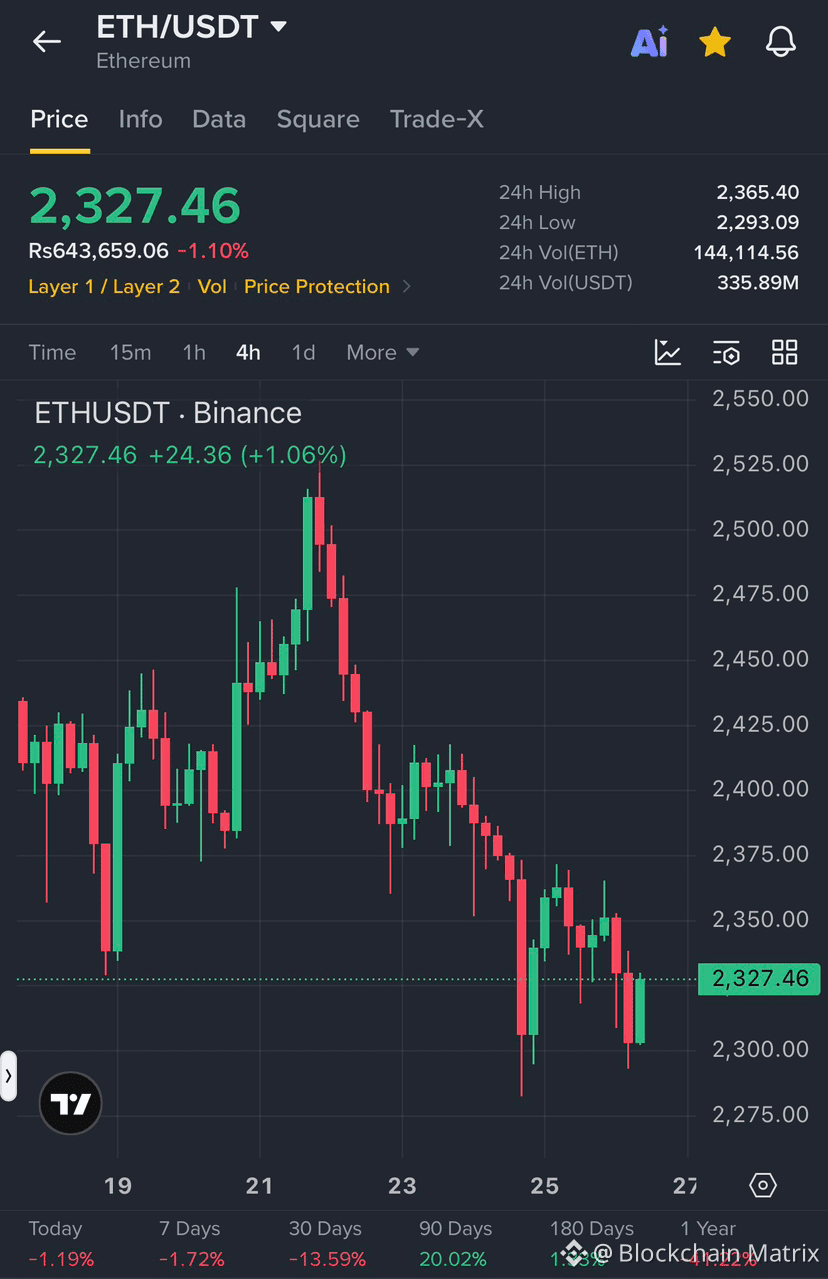
$ETH BULLISH RECOVERY SETUP: Buyers Are Defending the $2,300 Support Zone
Entry Range: $2,320 – $2,335
Stop Loss: $2,290
Targets:
TP1: $2,350
TP2: $2,375
TP3: $2,400
$ETH is attempting a short-term recovery after a strong bearish move on the 4-hour chart. Price has bounced from the $2,300 area, showing that buyers are trying to defend this important support zone.
If ETH holds above $2,300 and breaks through $2,350, bullish momentum could push the price toward $2,375 and $2,400. However, the overall trend remains bearish, so confirmation is important before considering a long entry.
Invalidation: A decisive breakdown below $2,290 would weaken the bullish recovery setup.
Wait for confirmation and manage risk carefully.
{spot}(ETHUSDT)
#MatrixFamily listen to me carefully…
$ETH BULLISH RECOVERY SETUP: Buyers Are Defending the $2,300 Support Zone
Entry Range: $2,320 – $2,335
Stop Loss: $2,290
Targets:
TP1: $2,350
TP2: $2,375
TP3: $2,400
$ETH is attempting a short-term recovery after a strong bearish move on the 4-hour chart. Price has bounced from the $2,300 area, showing that buyers are trying to defend this important support zone.
If ETH holds above $2,300 and breaks through $2,350, bullish momentum could push the price toward $2,375 and $2,400. However, the overall trend remains bearish, so confirmation is important before considering a long entry.
Invalidation: A decisive breakdown below $2,290 would weaken the bullish recovery setup.
Wait for confirmation and manage risk carefully.
139
·
--
Bullish
#MatrixFamily listen to me carefully…..🔥💥
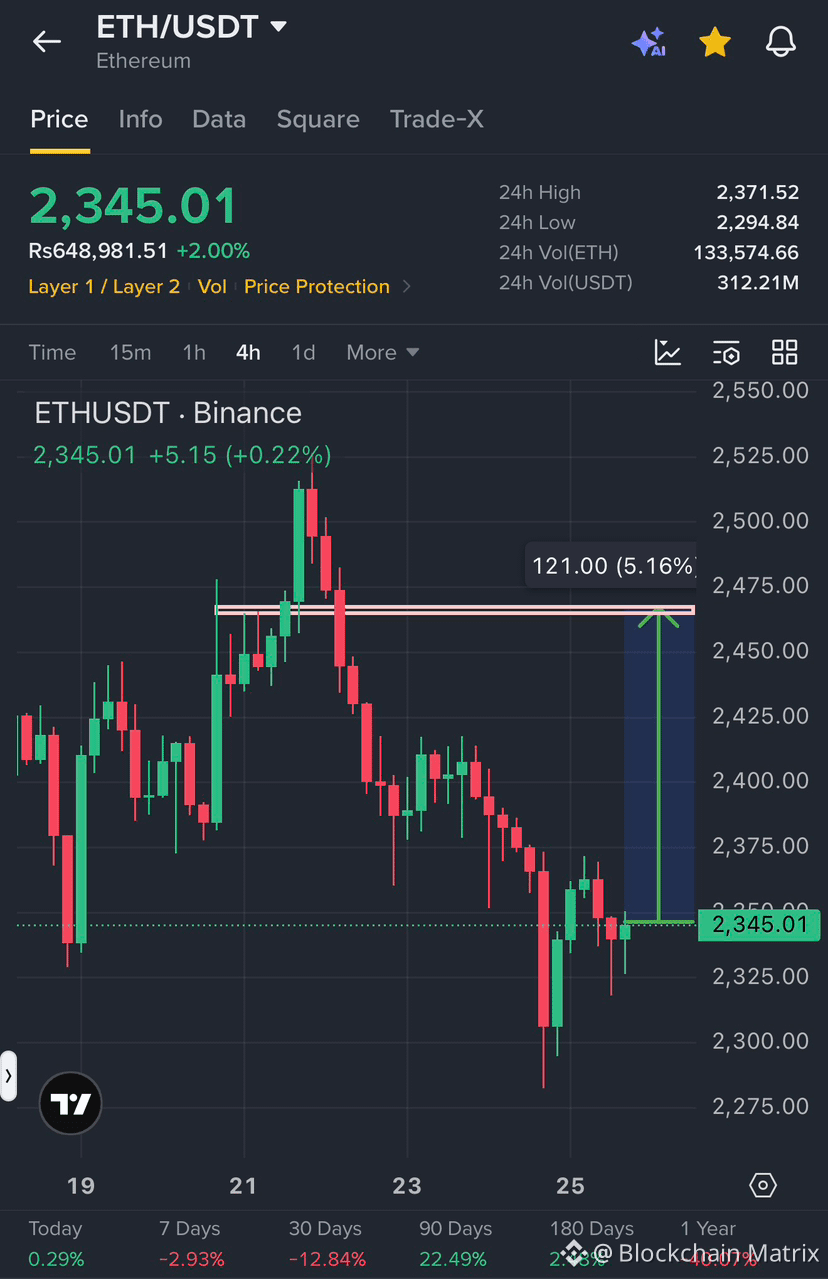
$ETH BULLISH RECOVERY SETUP – WATCH THIS KEY RESISTANCE
$ETH is trading around $2,345 after bouncing back from the $2,290–$2,300 support zone. Buyers are trying to regain control, but the 4H chart still shows a broader short-term downtrend.
Entry Range: $2,335–$2,350
Stop Loss: $2,315
Targets:
TP1: $2,375
TP2: $2,420
TP3: $2,465
Trade Analysis:
$ETH is showing signs of recovery after a sharp sell-off. If buyers maintain support above $2,330 and build bullish momentum, price could move toward $2,375 and then $2,420. The major resistance zone sits around $2,465–$2,470, where sellers previously took control.
A strong 4H close above $2,375 would improve the bullish outlook. However, rejection at resistance could trigger another move lower, so confirmation is important before entering.
Invalidation: A breakdown below $2,315 weakens this bullish setup and increases the risk of further downside.
Wait for confirmation and manage risk carefully. These levels are based on the provided chart, not a guaranteed outcome.
{spot}(ETHUSDT)
#MatrixFamily listen to me carefully…..🔥💥
$ETH BULLISH RECOVERY SETUP – WATCH THIS KEY RESISTANCE
$ETH is trading around $2,345 after bouncing back from the $2,290–$2,300 support zone. Buyers are trying to regain control, but the 4H chart still shows a broader short-term downtrend.
Entry Range: $2,335–$2,350
Stop Loss: $2,315
Targets:
TP1: $2,375
TP2: $2,420
TP3: $2,465
Trade Analysis:
$ETH is showing signs of recovery after a sharp sell-off. If buyers maintain support above $2,330 and build bullish momentum, price could move toward $2,375 and then $2,420. The major resistance zone sits around $2,465–$2,470, where sellers previously took control.
A strong 4H close above $2,375 would improve the bullish outlook. However, rejection at resistance could trigger another move lower, so confirmation is important before entering.
Invalidation: A breakdown below $2,315 weakens this bullish setup and increases the risk of further downside.
Wait for confirmation and manage risk carefully. These levels are based on the provided chart, not a guaranteed outcome.
84
·
--
Bullish
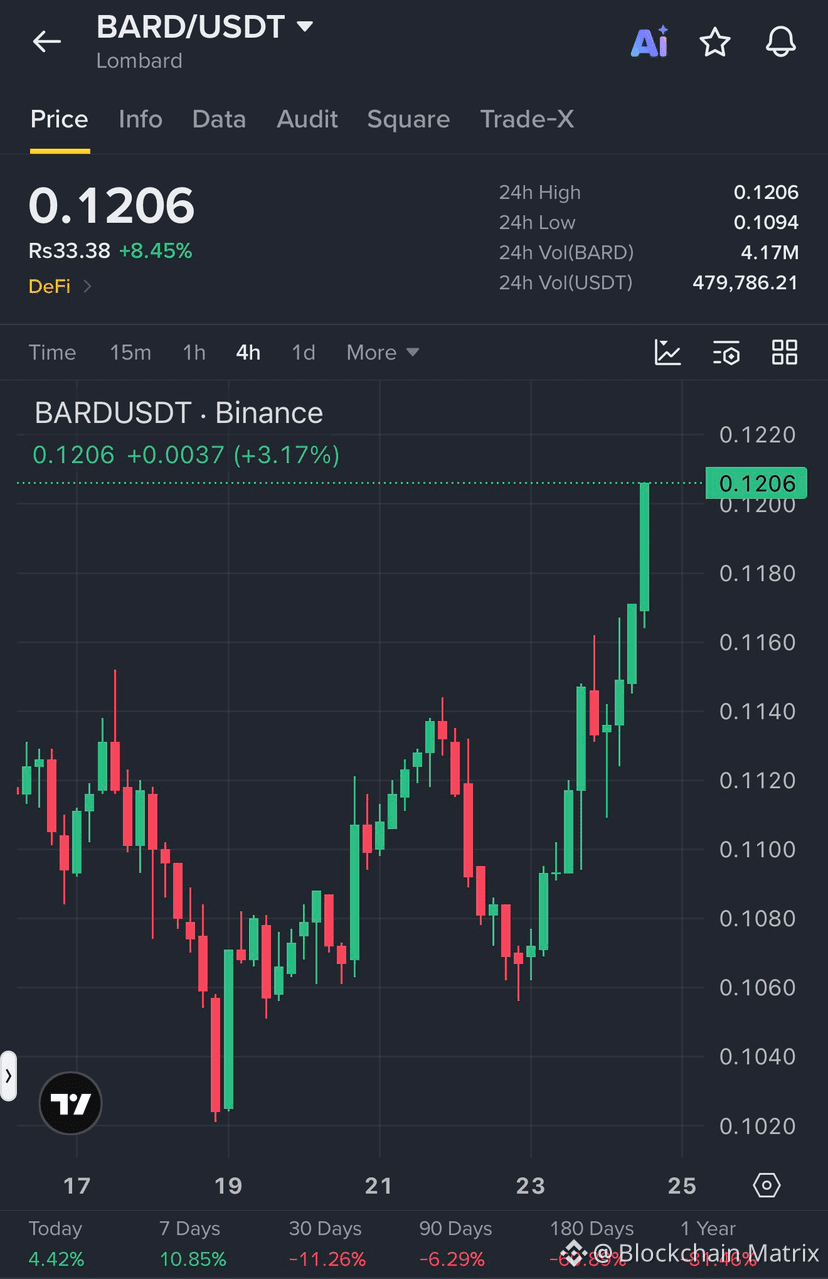
#MatrixFamily listen to me carefully… $BARD is showing strong bullish momentum on the 4H chart, but the next move is important.
$BARD Long Trade Setup
Entry Range: 0.1170 – 0.1190
Stop Loss: 0.1145
Targets:
TP1: 0.1220
TP2: 0.1250
TP3: 0.1290
$BARD is trading around 0.1206 after a strong upward move, breaking above previous resistance near 0.1170. Buyers are currently in control, and the recent green candles show increasing bullish momentum.
A pullback toward the entry zone could offer a better opportunity than chasing the current pump. If price holds above 0.1170 and maintains buying pressure, the next upside targets could come into play. However, rejection near the current high may trigger a short-term correction.
Invalidation: A 4H candle close below 0.1145 would weaken this bullish setup.
Always manage risk and wait for confirmation before entering.
{spot}(BARDUSDT)
#MatrixFamily listen to me carefully… $BARD is showing strong bullish momentum on the 4H chart, but the next move is important.
$BARD Long Trade Setup
Entry Range: 0.1170 – 0.1190
Stop Loss: 0.1145
Targets:
TP1: 0.1220
TP2: 0.1250
TP3: 0.1290
$BARD is trading around 0.1206 after a strong upward move, breaking above previous resistance near 0.1170. Buyers are currently in control, and the recent green candles show increasing bullish momentum.
A pullback toward the entry zone could offer a better opportunity than chasing the current pump. If price holds above 0.1170 and maintains buying pressure, the next upside targets could come into play. However, rejection near the current high may trigger a short-term correction.
Invalidation: A 4H candle close below 0.1145 would weaken this bullish setup.
Always manage risk and wait for confirmation before entering.
653
·
--
Bullish
#MatrixFamily listen to me carefully…..💥
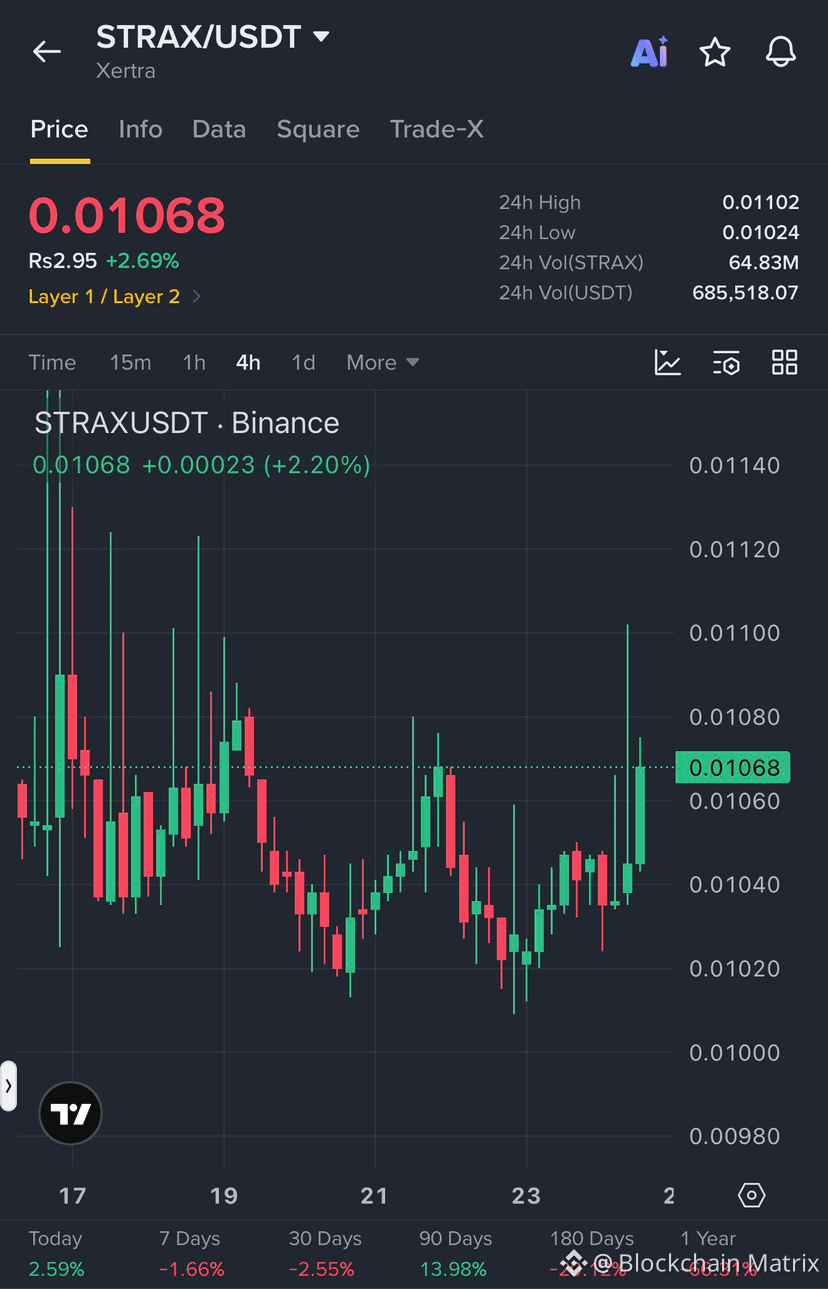
$STRAX is showing signs of a bullish recovery on the 4-hour chart after defending the $0.0102 support zone. Buyers are pushing the price back toward $0.0107, with a fresh green candle suggesting renewed buying interest.
$STRAX Bullish Trade Setup💥🔥
Entry Range: $0.01055–$0.01070
Stop Loss: $0.01020
TP1: $0.01080
TP2: $0.01100
TP3: $0.01120
The chart shows a recovery from recent lows, with price attempting to reclaim the $0.0106–$0.0107 area. However, the upper wicks indicate selling pressure near resistance, so confirmation is important before expecting another upward move.
If $STRAX holds above the entry zone and breaks through $0.01080 with strong buying volume, the next targets are $0.01100 and $0.01120. A rejection near resistance could send the price back toward $0.0104 support.
Invalidation Level: $0.01020
{spot}(STRAXUSDT)
#MatrixFamily listen to me carefully…..💥
$STRAX is showing signs of a bullish recovery on the 4-hour chart after defending the $0.0102 support zone. Buyers are pushing the price back toward $0.0107, with a fresh green candle suggesting renewed buying interest.
$STRAX Bullish Trade Setup💥🔥
Entry Range: $0.01055–$0.01070
Stop Loss: $0.01020
TP1: $0.01080
TP2: $0.01100
TP3: $0.01120
The chart shows a recovery from recent lows, with price attempting to reclaim the $0.0106–$0.0107 area. However, the upper wicks indicate selling pressure near resistance, so confirmation is important before expecting another upward move.
If $STRAX holds above the entry zone and breaks through $0.01080 with strong buying volume, the next targets are $0.01100 and $0.01120. A rejection near resistance could send the price back toward $0.0104 support.
Invalidation Level: $0.01020
251
#MatrixFamily listen to me carefully…
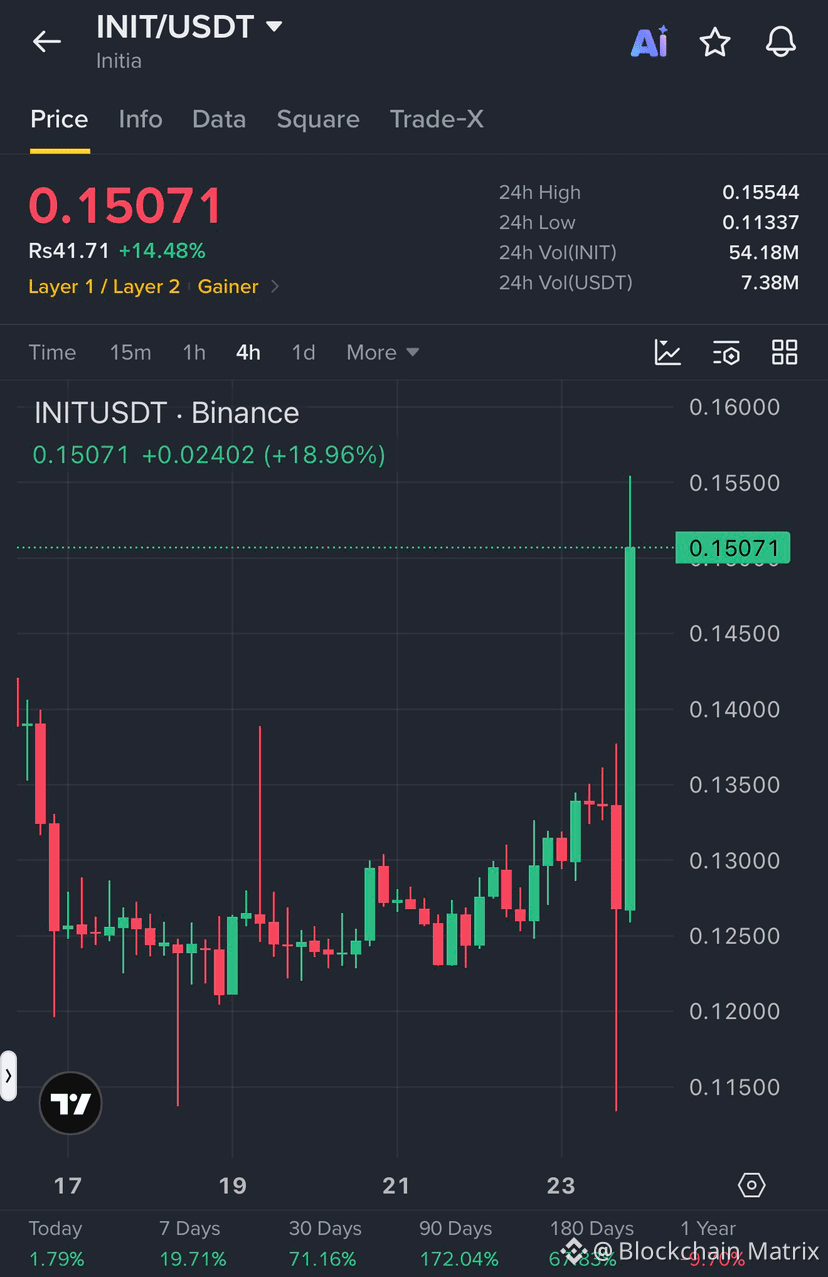
$INIT is showing strong bullish momentum after a powerful breakout on the 4-hour chart. Price has surged from the $0.127 area toward $0.155, supported by a massive green candle and increased trading activity.
$INIT Bullish Trade Setup
Entry Range: $0.1460–$0.1500
Stop Loss: $0.1410
TP1: $0.1550
TP2: $0.1600
TP3: $0.1680
The breakout shows strong buying pressure, but $INIT has already moved sharply, so chasing the current price carries higher risk. A pullback toward the entry zone followed by a strong bullish reaction could offer a better opportunity. If buyers maintain control and price breaks above $0.1555, the next resistance levels could come into focus.
If price loses the $0.1460 area, bullish momentum may weaken and a deeper correction could follow. Wait for confirmation before entering, as volatility remains elevated.
Invalidation Level: $0.1410
{spot}(INITUSDT)
#MatrixFamily listen to me carefully…
$INIT is showing strong bullish momentum after a powerful breakout on the 4-hour chart. Price has surged from the $0.127 area toward $0.155, supported by a massive green candle and increased trading activity.
$INIT Bullish Trade Setup
Entry Range: $0.1460–$0.1500
Stop Loss: $0.1410
TP1: $0.1550
TP2: $0.1600
TP3: $0.1680
The breakout shows strong buying pressure, but $INIT has already moved sharply, so chasing the current price carries higher risk. A pullback toward the entry zone followed by a strong bullish reaction could offer a better opportunity. If buyers maintain control and price breaks above $0.1555, the next resistance levels could come into focus.
If price loses the $0.1460 area, bullish momentum may weaken and a deeper correction could follow. Wait for confirmation before entering, as volatility remains elevated.
Invalidation Level: $0.1410
139
#MatrixFamily listen to me carefully…
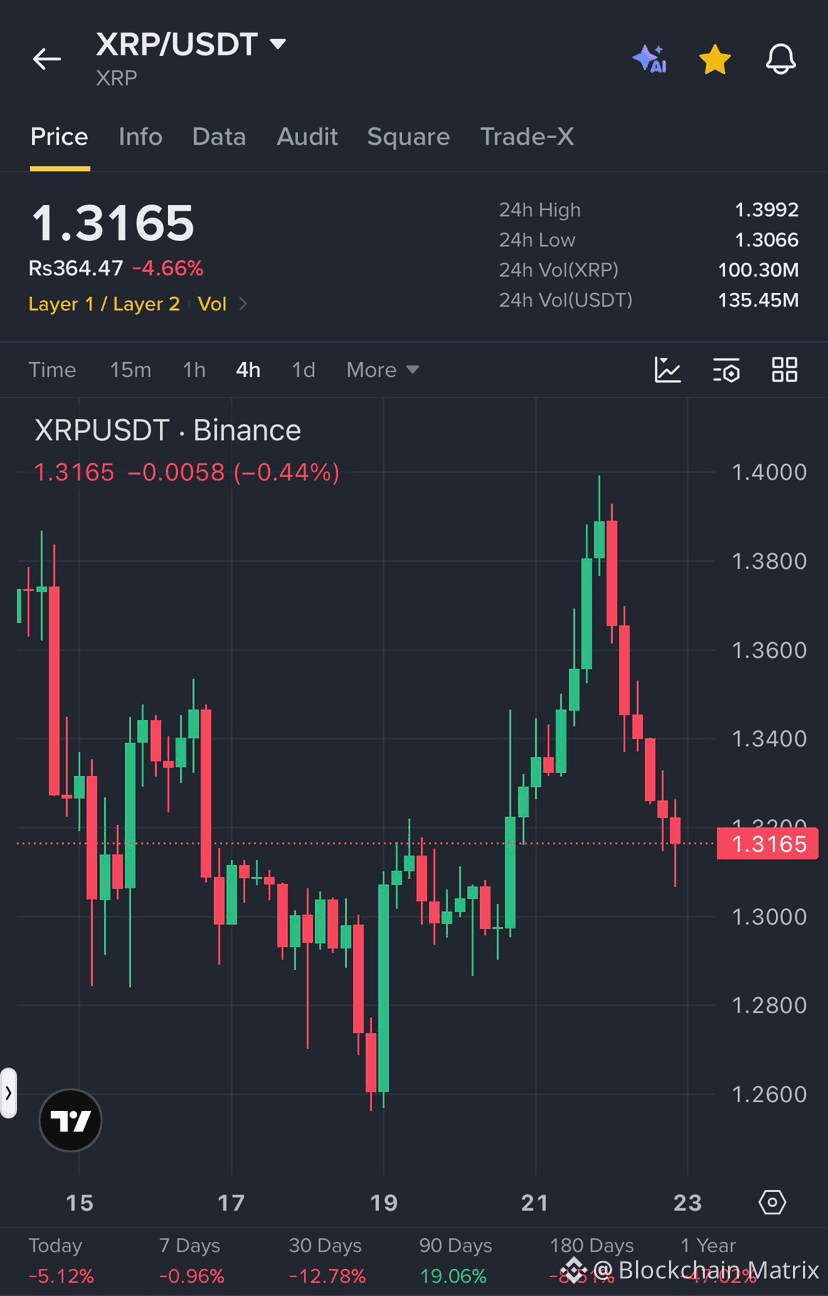
$XRP is showing strong bearish momentum on the 4H chart after facing rejection near $1.39. Sellers have taken control, and the price is now trading around $1.3165. A breakdown below $1.3060 could open the door for further downside.
$XRP SHORT TRADE SETUP
Entry Range: $1.3160 – $1.3250
Stop Loss: $1.3450
TP1: $1.3060
TP2: $1.2900
TP3: $1.2750
Market Analysis:
$XRP has dropped sharply from the $1.39 resistance zone, forming consecutive bearish candles on the 4H timeframe. The current price is approaching support around $1.3060, making this a critical level to watch. A confirmed breakdown could push the price toward $1.29 and $1.2750.
If buyers defend $1.3060 and reclaim $1.3450, selling pressure could weaken and the bearish setup may fail. Wait for confirmation before entering the trade.
Invalidation Level: $1.3450
{spot}(XRPUSDT)
#MatrixFamily listen to me carefully…
$XRP is showing strong bearish momentum on the 4H chart after facing rejection near $1.39. Sellers have taken control, and the price is now trading around $1.3165. A breakdown below $1.3060 could open the door for further downside.
$XRP SHORT TRADE SETUP
Entry Range: $1.3160 – $1.3250
Stop Loss: $1.3450
TP1: $1.3060
TP2: $1.2900
TP3: $1.2750
Market Analysis:
$XRP has dropped sharply from the $1.39 resistance zone, forming consecutive bearish candles on the 4H timeframe. The current price is approaching support around $1.3060, making this a critical level to watch. A confirmed breakdown could push the price toward $1.29 and $1.2750.
If buyers defend $1.3060 and reclaim $1.3450, selling pressure could weaken and the bearish setup may fail. Wait for confirmation before entering the trade.
Invalidation Level: $1.3450
89
#MatrixFamily listen to me carefully…💥💫
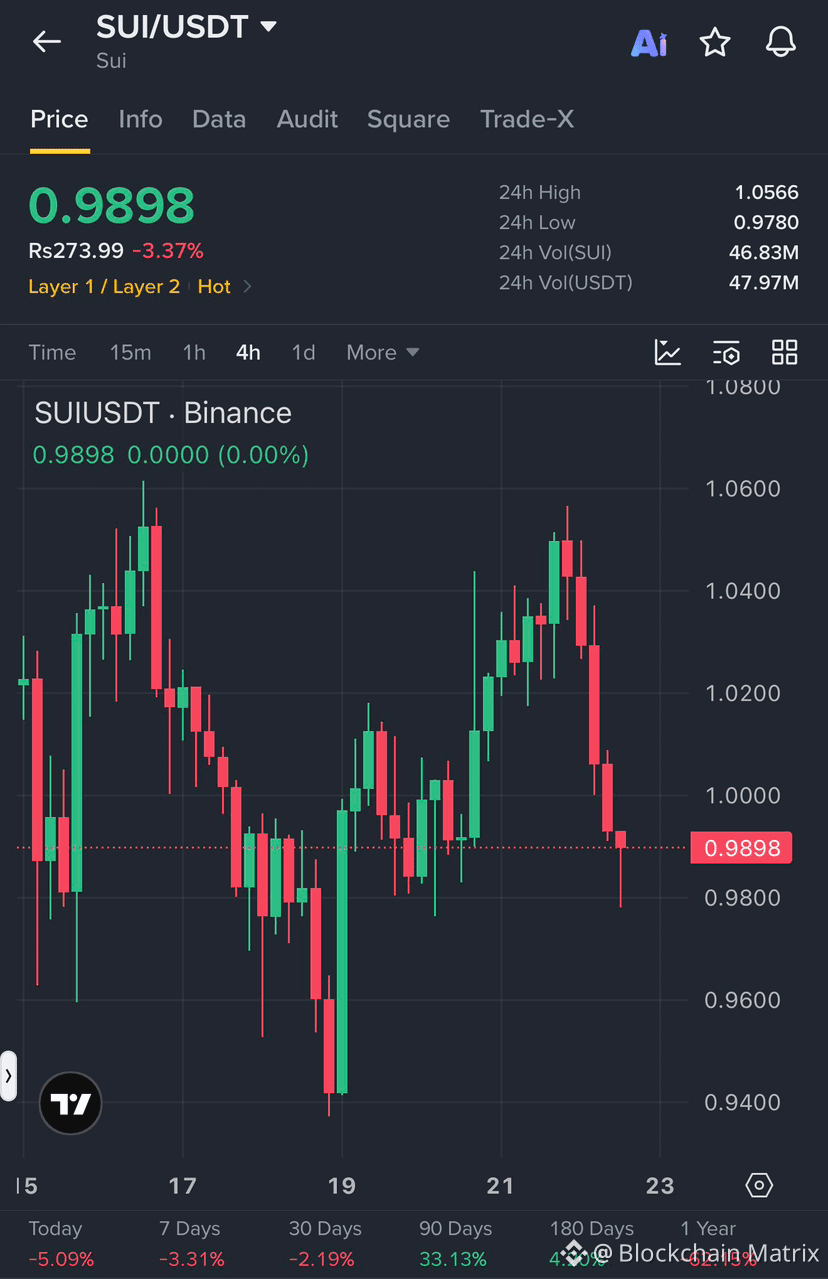
$SUI is showing strong bearish momentum as sellers take control on the 4H chart. The recent rejection near $1.0500 has triggered a sharp decline, and price is now testing the $0.9900 support zone.
$SUI Bearish Trade Setup
Entry Range: $0.9900 – $1.0050
Stop Loss: $1.0180
Targets:
TP1: $0.9800
TP2: $0.9650
TP3: $0.9450
Market Analysis
$SUI has dropped from the $1.0500 region with several consecutive bearish candles, showing increasing selling pressure. Price is approaching support around $0.9780–$0.9800, where buyers may attempt a recovery.
For continuation toward lower targets, a confirmed 4H close below $0.9780 would strengthen the bearish scenario. If price rebounds and reclaims $1.0050, sellers may lose momentum, so avoid entering blindly near support.
Invalidation: A strong 4H close above $1.0180 would weaken this bearish setup.
Wait for confirmation and manage risk carefully.
{spot}(SUIUSDT)
#MatrixFamily listen to me carefully…💥💫
$SUI is showing strong bearish momentum as sellers take control on the 4H chart. The recent rejection near $1.0500 has triggered a sharp decline, and price is now testing the $0.9900 support zone.
$SUI Bearish Trade Setup
Entry Range: $0.9900 – $1.0050
Stop Loss: $1.0180
Targets:
TP1: $0.9800
TP2: $0.9650
TP3: $0.9450
Market Analysis
$SUI has dropped from the $1.0500 region with several consecutive bearish candles, showing increasing selling pressure. Price is approaching support around $0.9780–$0.9800, where buyers may attempt a recovery.
For continuation toward lower targets, a confirmed 4H close below $0.9780 would strengthen the bearish scenario. If price rebounds and reclaims $1.0050, sellers may lose momentum, so avoid entering blindly near support.
Invalidation: A strong 4H close above $1.0180 would weaken this bearish setup.
Wait for confirmation and manage risk carefully.
151
·
--
Bullish
#MatrixFamily listen to me carefully…
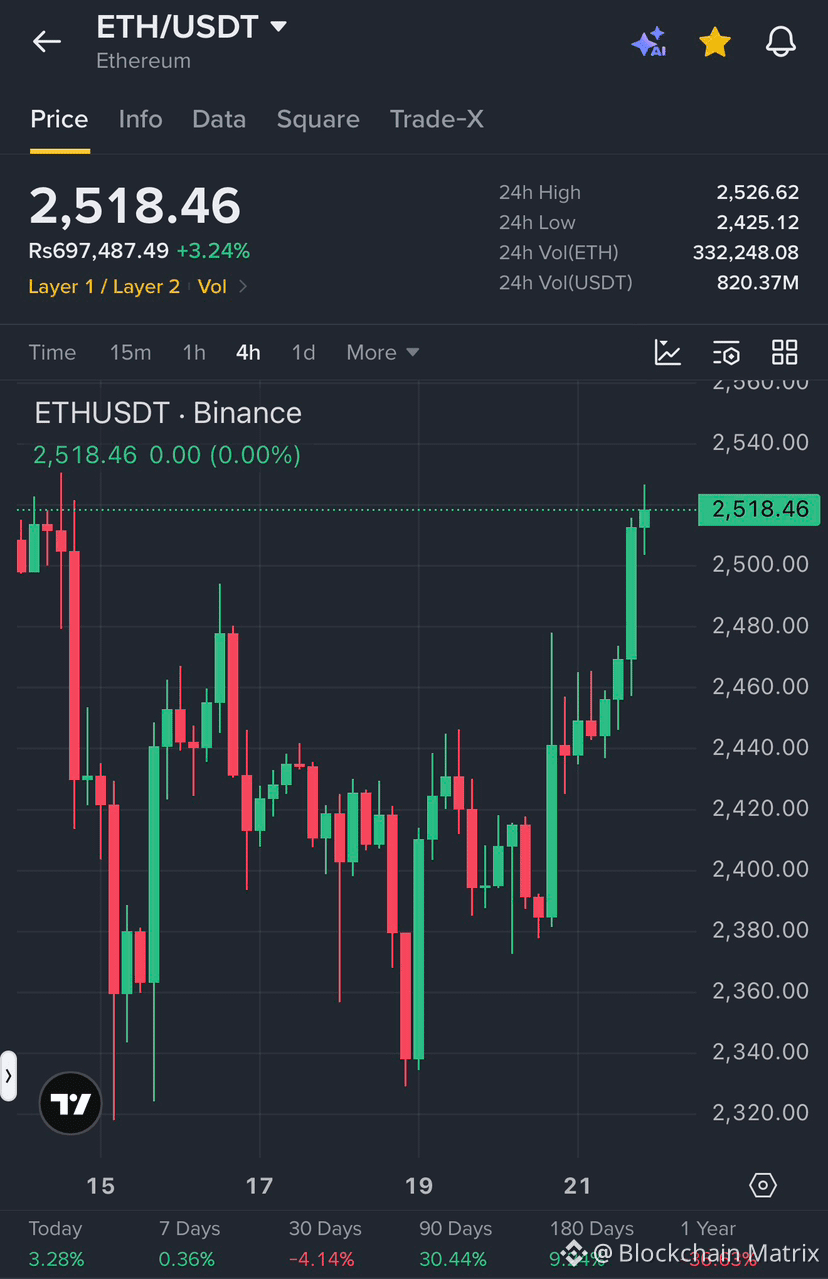
$ETH Bullish Breakout Setup: Buyers Are Taking Control
Entry Range: $2,500 – $2,518
Stop Loss: $2,465
Targets:
TP1: $2,540
TP2: $2,565
TP3: $2,600
$ETH is showing strong bullish momentum on the 4-hour chart after recovering from the $2,330–$2,380 support zone. Buyers have pushed the price above the previous consolidation area, with consecutive green candles signaling increasing buying pressure.
$ETH is now approaching resistance around $2,525–$2,540. A confirmed 4-hour close above this zone could open the way toward $2,565 and $2,600. If price gets rejected, a pullback toward $2,480–$2,500 could provide another test of support.
Invalidation: A 4-hour candle close below $2,465 would weaken the bullish structure.
{spot}(ETHUSDT)
#MatrixFamily listen to me carefully…
$ETH Bullish Breakout Setup: Buyers Are Taking Control
Entry Range: $2,500 – $2,518
Stop Loss: $2,465
Targets:
TP1: $2,540
TP2: $2,565
TP3: $2,600
$ETH is showing strong bullish momentum on the 4-hour chart after recovering from the $2,330–$2,380 support zone. Buyers have pushed the price above the previous consolidation area, with consecutive green candles signaling increasing buying pressure.
$ETH is now approaching resistance around $2,525–$2,540. A confirmed 4-hour close above this zone could open the way toward $2,565 and $2,600. If price gets rejected, a pullback toward $2,480–$2,500 could provide another test of support.
Invalidation: A 4-hour candle close below $2,465 would weaken the bullish structure.
1
162
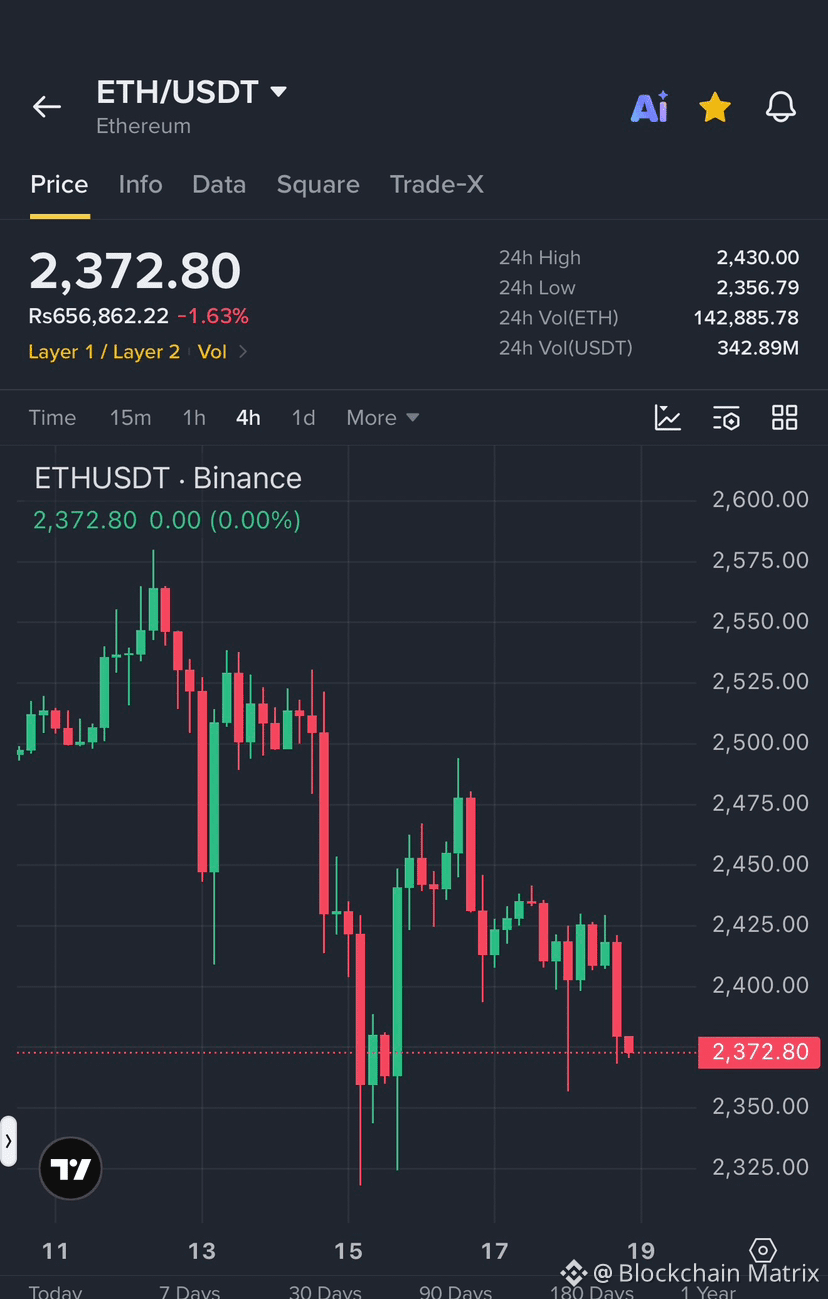
#MatrixFamily listen to me carefully… $ETH is breaking down, and bears are gaining control on the 4H chart.
Entry Range: $2,370 – $2,390
Stop Loss: $2,435
Targets:
TP1: $2,350
TP2: $2,325
TP3: $2,300
$ETH is showing a clear bearish structure with lower highs and continued selling pressure. After failing to sustain recovery attempts near $2,425, price has dropped toward $2,370, putting the $2,350 support zone under pressure.
If sellers maintain control and ETH breaks below $2,350, further downside toward $2,325 and $2,300 becomes possible. A rejection from the entry zone could provide another short opportunity, but confirmation is important before entering.
Invalidation: A strong 4H candle close above $2,435.
{spot}(ETHUSDT)
#MatrixFamily listen to me carefully… $ETH is breaking down, and bears are gaining control on the 4H chart.
Entry Range: $2,370 – $2,390
Stop Loss: $2,435
Targets:
TP1: $2,350
TP2: $2,325
TP3: $2,300
$ETH is showing a clear bearish structure with lower highs and continued selling pressure. After failing to sustain recovery attempts near $2,425, price has dropped toward $2,370, putting the $2,350 support zone under pressure.
If sellers maintain control and ETH breaks below $2,350, further downside toward $2,325 and $2,300 becomes possible. A rejection from the entry zone could provide another short opportunity, but confirmation is important before entering.
Invalidation: A strong 4H candle close above $2,435.
132
·
--
Bullish
#MatrixFamily listen to me carefully…
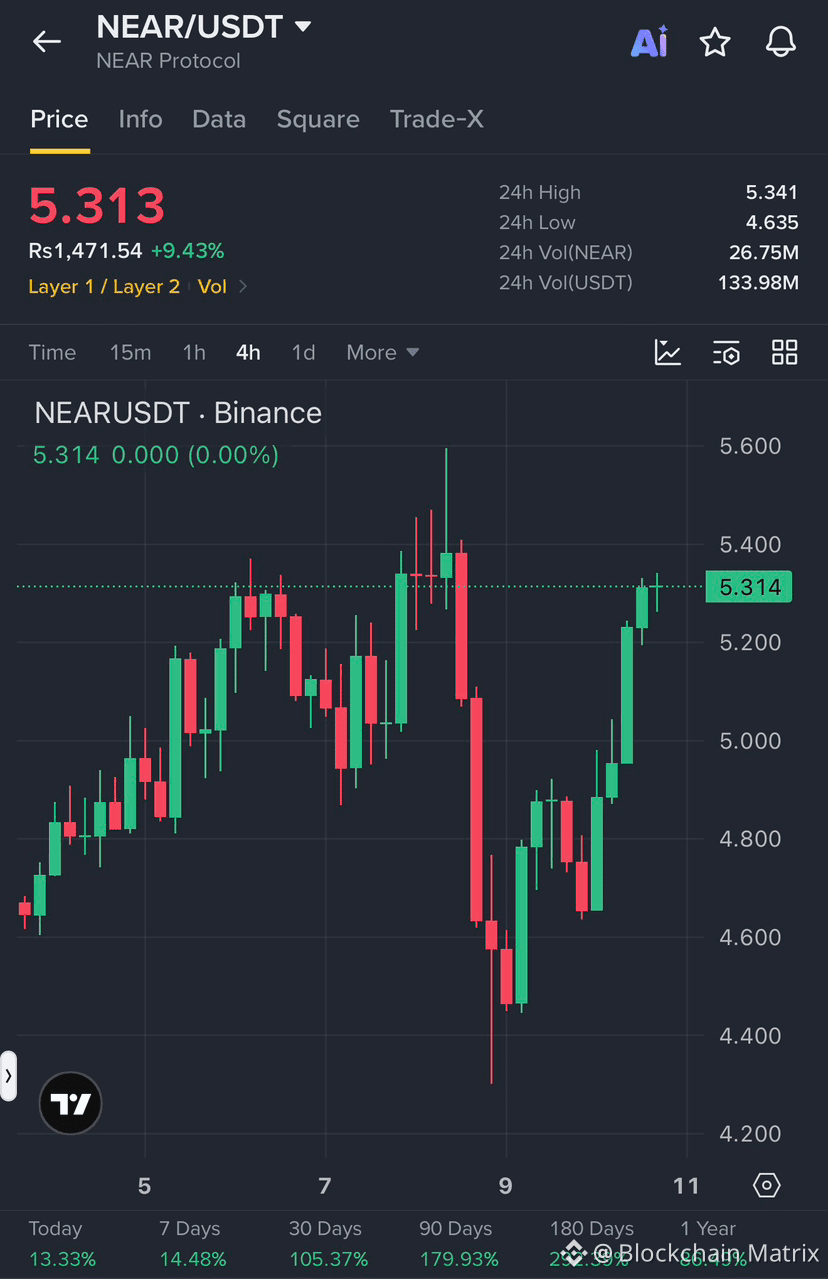
$NEAR is showing strong bullish momentum on the 4H chart after a sharp recovery from the $4.45 support zone. Buyers have pushed the price back toward $5.30, but resistance is approaching.
Entry Range: $5.25 – $5.31
Stop Loss: $5.08
Targets: TP1: $5.40 TP2: $5.50 TP3: $5.60
The recovery structure favors further upside if $NEAR holds above $5.20. A clean breakout above $5.40 could open the way toward $5.50 and $5.60. However, rejection near resistance could trigger a short-term pullback, so confirmation is important before entry.
Invalidation: Below $5.08.
{spot}(NEARUSDT)
#MatrixFamily listen to me carefully…
$NEAR is showing strong bullish momentum on the 4H chart after a sharp recovery from the $4.45 support zone. Buyers have pushed the price back toward $5.30, but resistance is approaching.
Entry Range: $5.25 – $5.31
Stop Loss: $5.08
Targets: TP1: $5.40 TP2: $5.50 TP3: $5.60
The recovery structure favors further upside if $NEAR holds above $5.20. A clean breakout above $5.40 could open the way toward $5.50 and $5.60. However, rejection near resistance could trigger a short-term pullback, so confirmation is important before entry.
Invalidation: Below $5.08.
167
#MatrixFamily listen to me carefully…
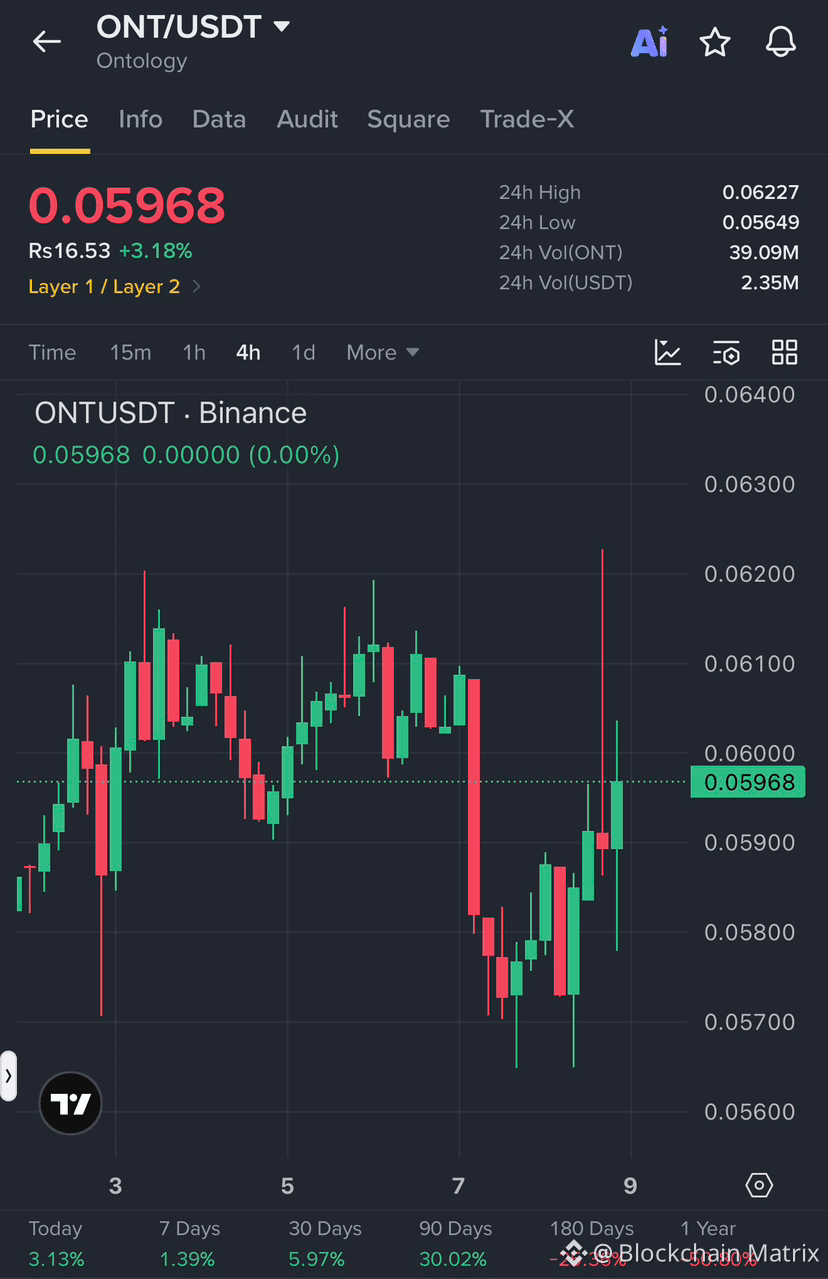
$ONT is showing a recovery setup on the 4H chart after holding the 0.05700–0.05800 support zone and pushing back above 0.05900.
Entry Range: 0.05900 – 0.05970
Stop Loss: 0.05700
Targets:
TP1: 0.06080
TP2: 0.06200
TP3: 0.06350
The recent rebound shows buyers stepping back in, and holding above 0.05900 could give the price room to retest the 0.06100–0.06200 resistance area. A clean breakout above 0.06200 would strengthen the bullish continuation.
Invalidation: Below 0.05700.
{spot}(ONTUSDT)
#MatrixFamily listen to me carefully…
$ONT is showing a recovery setup on the 4H chart after holding the 0.05700–0.05800 support zone and pushing back above 0.05900.
Entry Range: 0.05900 – 0.05970
Stop Loss: 0.05700
Targets:
TP1: 0.06080
TP2: 0.06200
TP3: 0.06350
The recent rebound shows buyers stepping back in, and holding above 0.05900 could give the price room to retest the 0.06100–0.06200 resistance area. A clean breakout above 0.06200 would strengthen the bullish continuation.
Invalidation: Below 0.05700.
182
·
--
Bullish
#MatrixFamily listen to me carefully…
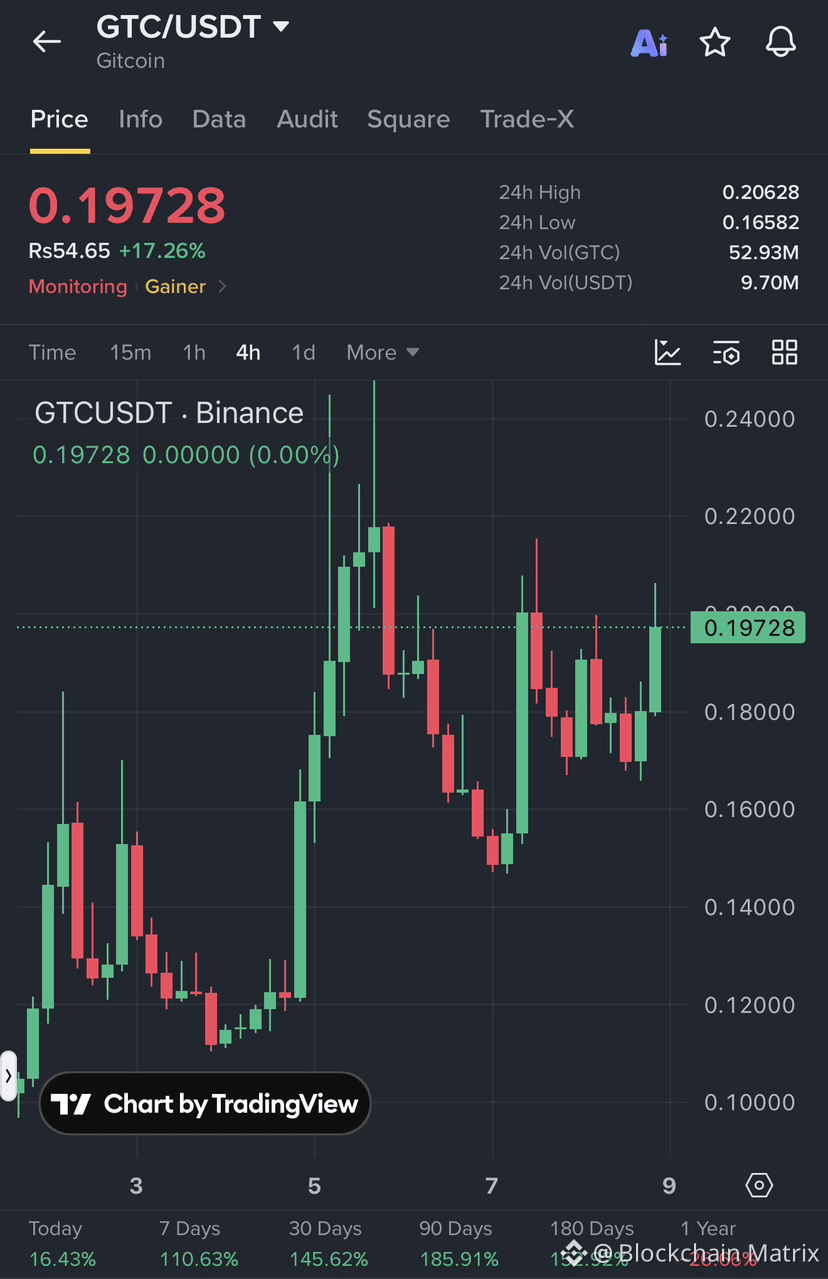
$GTC is showing strong bullish momentum on the 4H chart, with price reclaiming the 0.19 area and pushing back toward the recent resistance zone.
Entry Range: 0.19000 – 0.19700
Stop Loss: 0.17800
Targets:
TP1: 0.20600
TP2: 0.21800
TP3: 0.23000
The structure is turning bullish after the strong recovery from the 0.15 zone. Holding above 0.19 could keep buyers in control, while a clean breakout above 0.206 would open the path toward higher resistance levels.
Invalidation: Below 0.17800.
{spot}(GTCUSDT)
#MatrixFamily listen to me carefully…
$GTC is showing strong bullish momentum on the 4H chart, with price reclaiming the 0.19 area and pushing back toward the recent resistance zone.
Entry Range: 0.19000 – 0.19700
Stop Loss: 0.17800
Targets:
TP1: 0.20600
TP2: 0.21800
TP3: 0.23000
The structure is turning bullish after the strong recovery from the 0.15 zone. Holding above 0.19 could keep buyers in control, while a clean breakout above 0.206 would open the path toward higher resistance levels.
Invalidation: Below 0.17800.
2
295
#MatrixFamily listen to me carefully…
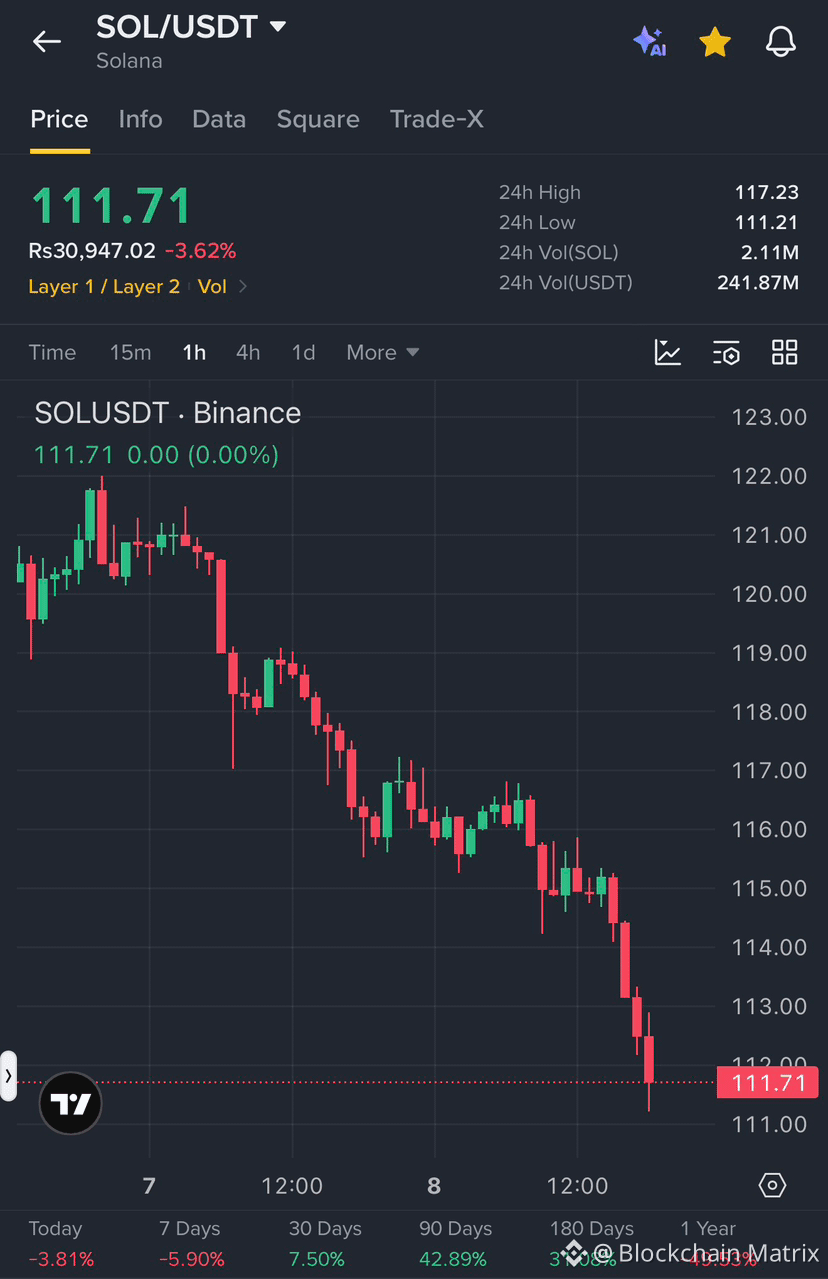
$SOL is showing strong bearish momentum on the 1H chart, with a clear lower-high and lower-low structure. Sellers are dominating after the breakdown from the 115–116 zone.
Entry: 111.70–112.20
Stop Loss: 114.00
Targets: 110.00 / 108.50 / 106.50
As long as $SOL remains below 114.00, the bearish structure remains valid and further downside can follow. A sustained move back above 114.00 would weaken this setup.
Invalidation: 114.00
{spot}(SOLUSDT)
#MatrixFamily listen to me carefully…
$SOL is showing strong bearish momentum on the 1H chart, with a clear lower-high and lower-low structure. Sellers are dominating after the breakdown from the 115–116 zone.
Entry: 111.70–112.20
Stop Loss: 114.00
Targets: 110.00 / 108.50 / 106.50
As long as $SOL remains below 114.00, the bearish structure remains valid and further downside can follow. A sustained move back above 114.00 would weaken this setup.
Invalidation: 114.00
125
#MatrixFamily listen to me carefully…
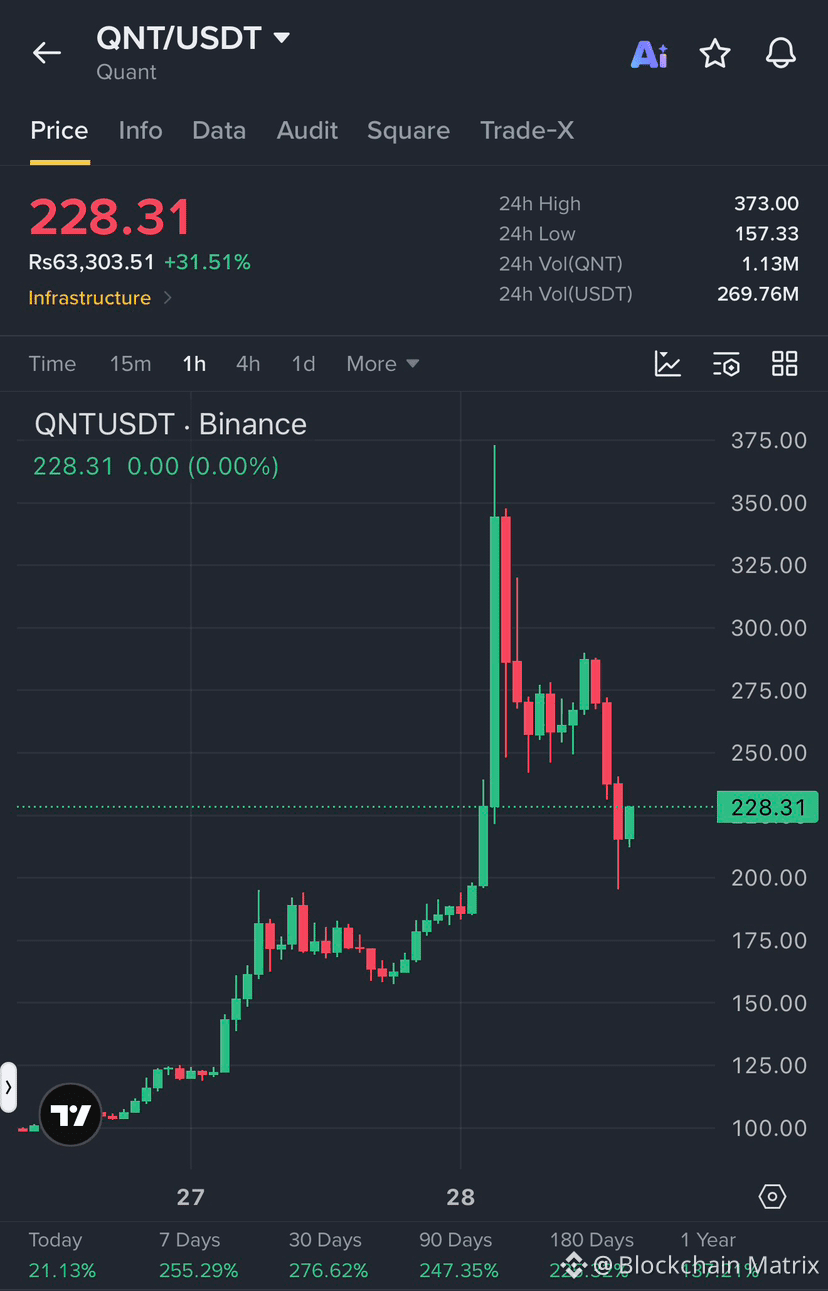
$QNT LONG SETUP — Buyers Are Defending the Pullback
Entry Range: 215–230
Stop Loss: 195
Targets:
TP1: 250
TP2: 275
TP3: 300
$QNT has seen a strong breakout followed by a sharp pullback. Price is now attempting to stabilize around the 215–230 zone. Holding this area and reclaiming 250 could open the way toward 275 and 300.
Invalidation: 195 breakdown.
{spot}(QNTUSDT)
#MatrixFamily listen to me carefully…
$QNT LONG SETUP — Buyers Are Defending the Pullback
Entry Range: 215–230
Stop Loss: 195
Targets:
TP1: 250
TP2: 275
TP3: 300
$QNT has seen a strong breakout followed by a sharp pullback. Price is now attempting to stabilize around the 215–230 zone. Holding this area and reclaiming 250 could open the way toward 275 and 300.
Invalidation: 195 breakdown.
1
378
·
--
Bullish
#MatrixFamily listen to me carefully…
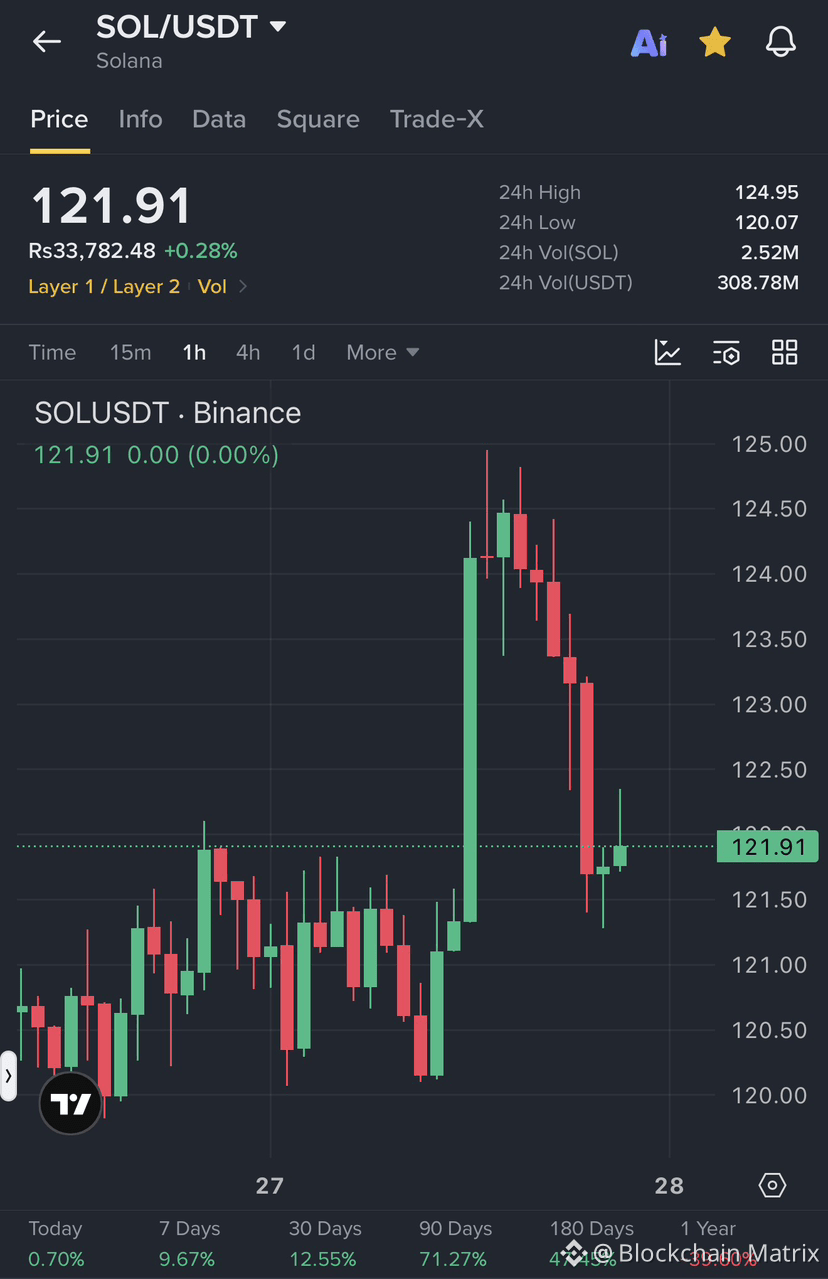
$SOL is showing a potential bullish recovery after holding the 121.50 support zone following a sharp pullback.
Entry Range: 121.70–122.00
Stop Loss: 120.70
Targets:
TP1: 123.50
TP2: 124.50
TP3: 125.00
The recent rejection from 124.50–125.00 brought SOL back toward support, where buyers are attempting to regain control. Holding above 121.50 can support another move toward the recent highs.
Invalidation: Below 120.70.
{spot}(SOLUSDT)
#MatrixFamily listen to me carefully…
$SOL is showing a potential bullish recovery after holding the 121.50 support zone following a sharp pullback.
Entry Range: 121.70–122.00
Stop Loss: 120.70
Targets:
TP1: 123.50
TP2: 124.50
TP3: 125.00
The recent rejection from 124.50–125.00 brought SOL back toward support, where buyers are attempting to regain control. Holding above 121.50 can support another move toward the recent highs.
Invalidation: Below 120.70.
143
#MatrixFamily listen to me carefully…🔥💥
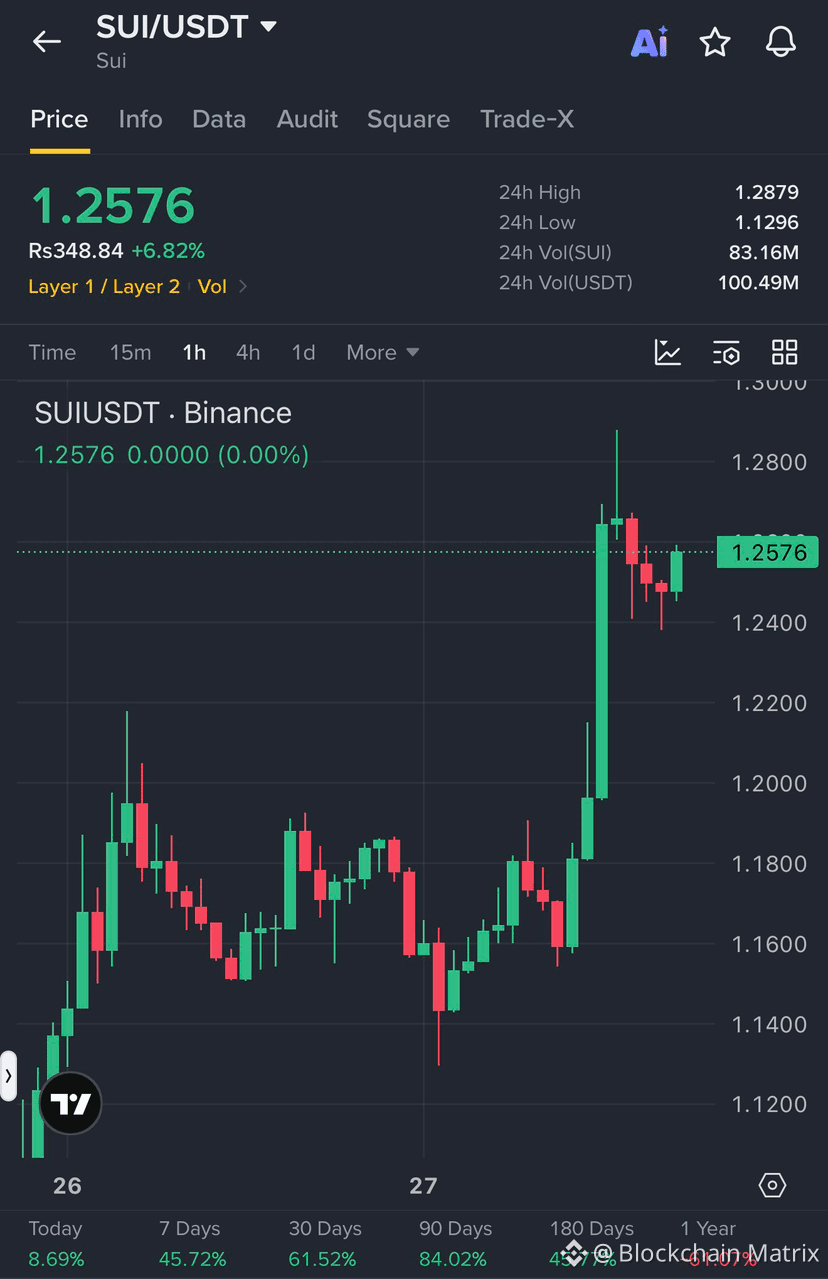
$SUI is holding strong after a powerful breakout on the 1H chart, with price consolidating above the 1.24 support zone.
Entry Range: 1.2500–1.2580
Stop Loss: 1.2380
Targets:
TP1: 1.2800
TP2: 1.3000
TP3: 1.3300
The breakout from the 1.20 area shows strong buying momentum. As long as SUI holds above 1.24, the structure remains bullish and another push toward the higher resistance levels is possible.
Invalidation: Below 1.2380.
{spot}(SUIUSDT)
#MatrixFamily listen to me carefully…🔥💥
$SUI is holding strong after a powerful breakout on the 1H chart, with price consolidating above the 1.24 support zone.
Entry Range: 1.2500–1.2580
Stop Loss: 1.2380
Targets:
TP1: 1.2800
TP2: 1.3000
TP3: 1.3300
The breakout from the 1.20 area shows strong buying momentum. As long as SUI holds above 1.24, the structure remains bullish and another push toward the higher resistance levels is possible.
Invalidation: Below 1.2380.
117
Log in to explore more content
Join global crypto users on Binance Square
⚡️ Get latest and useful information about crypto.
💬 Trusted by the world’s largest crypto exchange.
👍 Discover real insights from verified creators.
Email / Phone number
Trending Topics
1
#FedWatch
16.2M views
38,016 Discussing
2
#SolidusLabsReportsSuspected$170MSpoofingOnHyperliquidOilContracts
0 views
2 Discussing
3
#StanDruckenmillerBecomesInvestorInTradeXYZ
6 views
8 Discussing
4
#RussiaProposedNonCustodialWalletLimitsExcludeIntlSettlements
340 views
21 Discussing
5
#AlphabetSharesSlide10%InLateTrading
2,777 views
79 Discussing
6
#HyperliquidPermanentlyBurns49.87MillionHYPE
0 views
5 Discussing
7
#Nasdaq100FuturesFall0.9%
4,477 views
156 Discussing
8
#BitcoinCore32.1RaisesPeerConnectionLimit
24,897 views
492 Discussing
9
#VisaStablecoinSettlementTops$25BAnnualized
505 views
20 Discussing
10
#WestpacToCapCryptoPaymentsAtAUD10KPerMonth
6,713 views
163 Discussing