

#eth
eth
4.5G views
26.6M Discussing
Hot
Latest

·
--
shaahji:
Boss iska to bap b jaye ga :)
8
1
10
878


·
--
Bullish
$ETH could be preparing for something BIG. 👀
Ethereum is forming a bullish Inverse Head & Shoulders pattern on the weekly chart, and this is a setup worth watching closely.
The pattern shows a possible shift in market direction. After weeks or months of pressure, buyers may be starting to gain control.
Here’s what makes it interesting:
🔥 The left shoulder shows the first attempt to find a bottom.
🔥 The head marks a deeper drop, where sellers push the price lower but fail to keep control.
🔥 The right shoulder suggests that selling pressure may be getting weaker, with buyers stepping in at higher levels.
Now, all eyes are on the neckline.
If ETH breaks above it with strong volume and holds the breakout, this pattern could open the door to a much bigger move. A successful breakout may attract fresh buyers and bring new momentum into the market.
And because this is forming on the weekly chart, the potential move could play out over time rather than in a single day.
But here’s the key: confirmation matters. Until ETH breaks the neckline, the pattern is still developing, and a failed breakout or a drop below support could change the whole picture.
Ethereum has been through a lot, but if bulls take control here, the next chapter could get very interesting.
The setup is building. The neckline is the level to watch. And if the breakout comes, ETH could have a lot more room to run.
Will Ethereum make its next big move, or will the bulls need more time?
#ETH #CFTCAdvancesVoluntaryRegCAMFramework #BankOfRussiaSaysSelfCustodyBanStartsJuly2027 #ChinaQ3GDPGrowthQuickensTo4.5% #KOSPIOpens3.17%Lower
Abu Fahadأ:
💛
1
1
266

·
--
$ETH 🚀 BULLISH REVERSAL? ETHEREUM REBOUNDS TOWARD $2,440! 🔥
Ethereum is showing signs of recovery on the 4H chart after bouncing strongly from the $2,329 support zone. $ETH is currently trading around $2,429.68 (+0.78%), with buyers pushing the price toward the recent high of $2,438.40. The price has moved above the MA(7) at $2,401 and is testing the MA(25) near $2,419 — a positive short-term signal. 📈
🎯 Key Levels to Watch: 🟢 Resistance: $2,438–$2,467
🚀 Bullish breakout: A strong 4H close above $2,438 could open the path toward $2,467 and potentially $2,500.
🔴 Support: $2,400–$2,419
⚠️ Major downside level: $2,329
My Take: $ETH bulls are gaining momentum, but confirmation is still needed. The MA(99) near $2,535 and the Parabolic SAR near $2,484 remain overhead resistance signals. A rejection near $2,438 could trigger another pullback, while a confirmed breakout with strong volume would strengthen the bullish setup.
👀 Will ETH break above $2,440 and target $2,500 next, or will sellers step in again?
💬 Share your prediction below!
#Ethereum #ETH #BinanceSquare
#KOSPIOpens3.17%Lower
#CFTCAdvancesVoluntaryRegCAMFramework
{spot}(ETHUSDT)
$ETH 🚀 BULLISH REVERSAL? ETHEREUM REBOUNDS TOWARD $2,440! 🔥
Ethereum is showing signs of recovery on the 4H chart after bouncing strongly from the $2,329 support zone. $ETH is currently trading around $2,429.68 (+0.78%), with buyers pushing the price toward the recent high of $2,438.40. The price has moved above the MA(7) at $2,401 and is testing the MA(25) near $2,419 — a positive short-term signal. 📈
🎯 Key Levels to Watch: 🟢 Resistance: $2,438–$2,467
🚀 Bullish breakout: A strong 4H close above $2,438 could open the path toward $2,467 and potentially $2,500.
🔴 Support: $2,400–$2,419
⚠️ Major downside level: $2,329
My Take: $ETH bulls are gaining momentum, but confirmation is still needed. The MA(99) near $2,535 and the Parabolic SAR near $2,484 remain overhead resistance signals. A rejection near $2,438 could trigger another pullback, while a confirmed breakout with strong volume would strengthen the bullish setup.
👀 Will ETH break above $2,440 and target $2,500 next, or will sellers step in again?
💬 Share your prediction below!
#Ethereum #ETH #BinanceSquare
#KOSPIOpens3.17%Lower
#CFTCAdvancesVoluntaryRegCAMFramework
2
195

·
--
Bullish
Ethereum (ETH) Price Prediction: Can ETH Break Above $2,450?
Ethereum is trading around $2,434 today, showing a modest recovery. However, the next move will depend on whether buyers can push the price above the $2,448–$2,450 resistance zone.
Market Analysis:
$ETH is showing short-term recovery momentum, but the market remains volatile. A breakout above $2,450 could open the door toward $2,490. On the downside, $2,378 is an important support level to watch.
Potential Trade Setup:
* Current Price: Around $2,434
* Entry Zone: $2,420–$2,430
* Take Profit 1 (TP1): $2,450
* Take Profit 2 (TP2): $2,490
* Stop Loss (SL): $2,375
Bullish Scenario: If ETH breaks above $2,450 with strong buying volume, further upside may follow.
Bearish Scenario: If ETH loses the $2,378 support level, selling pressure could increase.
My Outlook: I remain cautiously bullish on ETH, but I would prefer confirmation above resistance before considering a long position. Entering without confirmation carries additional risk.
What do you think? Will ETH break above $2,450 or revisit the $2,378 support zone first?
Share your analysis in the comments.
#Ethereum #ETH #CryptoAnalysis #BinanceSquare
{future}(ETHUSDT)
Ethereum (ETH) Price Prediction: Can ETH Break Above $2,450?
Ethereum is trading around $2,434 today, showing a modest recovery. However, the next move will depend on whether buyers can push the price above the $2,448–$2,450 resistance zone.
Market Analysis:
$ETH is showing short-term recovery momentum, but the market remains volatile. A breakout above $2,450 could open the door toward $2,490. On the downside, $2,378 is an important support level to watch.
Potential Trade Setup:
* Current Price: Around $2,434
* Entry Zone: $2,420–$2,430
* Take Profit 1 (TP1): $2,450
* Take Profit 2 (TP2): $2,490
* Stop Loss (SL): $2,375
Bullish Scenario: If ETH breaks above $2,450 with strong buying volume, further upside may follow.
Bearish Scenario: If ETH loses the $2,378 support level, selling pressure could increase.
My Outlook: I remain cautiously bullish on ETH, but I would prefer confirmation above resistance before considering a long position. Entering without confirmation carries additional risk.
What do you think? Will ETH break above $2,450 or revisit the $2,378 support zone first?
Share your analysis in the comments.
#Ethereum #ETH #CryptoAnalysis #BinanceSquare
130

ETHUSDT is starting to look more constructive after buyers stepped in aggressively from the 2,318–2,330 demand zone.
What matters here is the reaction from support. Price did not simply hold the area — it bounced with enough strength to push back toward 2,420, showing that demand is still active around the lows.
As long as ETH continues to hold above this base, the current recovery has room to develop further. 2,500 is the first important upside objective, while a stronger continuation could bring 2,600 back into focus.
For now, buyers have the advantage, but the quality of the move will depend on whether ETH can keep building above the recent rebound rather than slipping back into the demand zone.
#ETH #eth #ETH🔥🔥🔥🔥🔥🔥 $ETH
{spot}(ETHUSDT)
ETHUSDT is starting to look more constructive after buyers stepped in aggressively from the 2,318–2,330 demand zone.
What matters here is the reaction from support. Price did not simply hold the area — it bounced with enough strength to push back toward 2,420, showing that demand is still active around the lows.
As long as ETH continues to hold above this base, the current recovery has room to develop further. 2,500 is the first important upside objective, while a stronger continuation could bring 2,600 back into focus.
For now, buyers have the advantage, but the quality of the move will depend on whether ETH can keep building above the recent rebound rather than slipping back into the demand zone.
#ETH #eth #ETH🔥🔥🔥🔥🔥🔥 $ETH
287

JUST IN: Vitalik Buterin says Ethereum should move cryptography off-chain $ETH
He argues that heavy computations should be proved with STARKs off-chain and verified through EIP-8288, reducing blockchain data demands while letting developers use different cryptographic systems without adding more precompiles.
#ETH
He argues that heavy computations should be proved with STARKs off-chain and verified through EIP-8288, reducing blockchain data demands while letting developers use different cryptographic systems without adding more precompiles.
#ETH
1
250

$ETH tried again today and got stopped at 2446, right under the 4H EMA50 again 😅
That blue line has been the ceiling since the drop from 2700 earlier this month. Every bounce makes a lower high and sellers keep showing up in the same spot.
Now sitting around 2397 and it lost the EMA20 too. Sunday night it swept 2329 and got bought fast so buyers are there, I'll give them that.
For me 2330 to 2318 is the floor. A 4H close under that and honestly it can get ugly. Bulls need a clean close above 2450 and then 2494, before that it's just a range with a bearish lean.
Anyone actually long here or just waiting?
Not advice bro, trade your own plan
#ETH #Ethereum #CryptoMarket
203

·
--
Bearish
$ETH 4H timeframe remains bearish with lower highs and lower lows structure. However, 1H chart indicates a short-term recovery from 2329, currently testing immediate resistance at 2445
Safer approach is to short at major resistance or long at major support, avoiding the middle of the range.
$ETH Short Setup (Preferred 60%)
· Short Entry: 2450 - 2490
· SL: above 2540
· TP: 2350, 2320
Support me just Trade here👇#eth
{future}(ETHUSDT)
$ETH 4H timeframe remains bearish with lower highs and lower lows structure. However, 1H chart indicates a short-term recovery from 2329, currently testing immediate resistance at 2445
Safer approach is to short at major resistance or long at major support, avoiding the middle of the range.
$ETH Short Setup (Preferred 60%)
· Short Entry: 2450 - 2490
· SL: above 2540
· TP: 2350, 2320
Support me just Trade here👇#eth
Safer approach is to short at major resistance or long at major support, avoiding the middle of the range.
$ETH Short Setup (Preferred 60%)
· Short Entry: 2450 - 2490
· SL: above 2540
· TP: 2350, 2320
Support me just Trade here👇#eth
177

·
--
$ETH WEEKLY OUTLOOK | Week of Oct 19 📊
Ethereum is stuck in a range with no clear direction yet between $2,330 and $2,550. The balance is tilting bearish.
Fundamentals
US spot Ether ETFs lost another $320M last week, their third straight weekly outflow, bringing October withdrawals to roughly $955M. On the bright side, BitMine keeps accumulating with 6.04M $ETH held, and Glamsterdam moves to the Hoodi testnet on Oct 26, with no mainnet date set yet.
Technical read
A weekly doji is clearly visible, and the daily sits in a neutral zone inside the Kumo. The daily uptrend is still holding for now, but will bulls react strongly on it?
Resistances
$2,450 upper daily resistance
$2,550 upper level
Supports
$2,350 and the daily uptrend
$2,200 next downside
$2,150 to $2,210 (50% Fib daily area)
Scenario
Lose $2,350 and the uptrend on a daily basis, and $2,200 will follow.
Break above $2,450 on D1, and $2,550 is probably next.
My take: price and Ichimoku structure don't look good under the weekly Kumo. Same as $BTC, I feel more bearish here, especially under $2,550.
What do you see next? 👇
NFA
#ETH
1
2
463

🚨 ETHEREUM ALERT: BULLISH REVERSAL OR ANOTHER DIP? 📉📈
$ETH is trading around $2,420 as Ethereum tests an important support zone. Buyers are trying to defend the $2,360–$2,440 area, but selling pressure remains a concern.
🔥 KEY LEVELS TO WATCH 🟢 Support: $2,360–$2,400 🔴 Resistance: $2,450–$2,500 🚀 A strong breakout above resistance could improve bullish momentum. ⚠️ A breakdown below support could open the door to further downside.
💡 Ethereum is at a critical point. Bulls need to step in with strong buying volume to confirm a recovery. Until then, patience and risk management are essential.
🎯 YOUR TURN! Will $ETH reach $2,600 next, or will we see $2,300 first?
👇 Comment your target! ❤️ Like, share, and follow for more crypto market updates.
#ETH #Ethereum #Crypto #BinanceSquare #altcoins
4
151

·
--
> *Vitalik: EIP-8288 Could Be The End of New Precompiles* #ETH
>
> Big idea from Vitalik Buterin.
>
> He explains EIP-8288 as a better way to handle multiple crypto schemes on Ethereum.
>
> How it works: Users create any signature type locally on their device, generate a STARK proof for it, and then a STARK aggregator includes only the aggregated proof on-chain. No heavy calldata needed.
>
> If this works, Ethereum may never need to add new precompiles for every new signature scheme again.
>
> This is huge for post-quantum signatures and privacy.
>
> What do you think about this approach?
>
> #Ethereum #ETH #VitalikButerin #EPTCOIN 8288 #STARK #CryptoNews
{future}(ETHUSDT)
> *Vitalik: EIP-8288 Could Be The End of New Precompiles* #ETH
>
> Big idea from Vitalik Buterin.
>
> He explains EIP-8288 as a better way to handle multiple crypto schemes on Ethereum.
>
> How it works: Users create any signature type locally on their device, generate a STARK proof for it, and then a STARK aggregator includes only the aggregated proof on-chain. No heavy calldata needed.
>
> If this works, Ethereum may never need to add new precompiles for every new signature scheme again.
>
> This is huge for post-quantum signatures and privacy.
>
> What do you think about this approach?
>
> #Ethereum #ETH #VitalikButerin #EPTCOIN 8288 #STARK #CryptoNews
>
> Big idea from Vitalik Buterin.
>
> He explains EIP-8288 as a better way to handle multiple crypto schemes on Ethereum.
>
> How it works: Users create any signature type locally on their device, generate a STARK proof for it, and then a STARK aggregator includes only the aggregated proof on-chain. No heavy calldata needed.
>
> If this works, Ethereum may never need to add new precompiles for every new signature scheme again.
>
> This is huge for post-quantum signatures and privacy.
>
> What do you think about this approach?
>
> #Ethereum #ETH #VitalikButerin #EPTCOIN 8288 #STARK #CryptoNews
79

·
--
Article
*ETH Short Analysis - Rebound at $2,403 but Stuck Below $2,$ETH *Current:* ∼$2,403 (+1.7% today), intraday range $2,329 - $2,446 5c95
*What the candles show:*
- *Downtrend to Bounce:* ETH dropped from ∼$2,500 on Oct 10 to $2,329 low on Oct 17-18, then bounced with a big green bullish engulfing candle on Oct 18. Today is a small indecisive candle (long upper wick) - shows sellers at top.
- *Key Levels:*
- *Support:* $2,350 (recent low) and $2,150 (200-day MA long-term floor)
- *Resistance:* $2,547 - $2,552 cluster (20-day + 50-day MA) - ETH is still trading BELOW this, so medium-term pressure remains.
- *Momentum:* RSI is 27.2 - oversold, MACD negative. Means selling was overdone, bounce expected but not confirmed as reversal. 4f8668a5
*Short-term view:* Range-bound $2,350 - $2,530. If ETH holds above $2,430, it can test $2,530. If it breaks below $2,329, risk of drop to $2,200. 9319
This is not financial advice - for that NVDAB $1 voucher you showed, ETH move of 1-2% is normal volatility.
#ETH #cryptouniverseofficial
*ETH Short Analysis - Rebound at $2,403 but Stuck Below $2,
$ETH *Current:* ∼$2,403 (+1.7% today), intraday range $2,329 - $2,446 5c95
*What the candles show:*
- *Downtrend to Bounce:* ETH dropped from ∼$2,500 on Oct 10 to $2,329 low on Oct 17-18, then bounced with a big green bullish engulfing candle on Oct 18. Today is a small indecisive candle (long upper wick) - shows sellers at top.
- *Key Levels:*
- *Support:* $2,350 (recent low) and $2,150 (200-day MA long-term floor)
- *Resistance:* $2,547 - $2,552 cluster (20-day + 50-day MA) - ETH is still trading BELOW this, so medium-term pressure remains.
- *Momentum:* RSI is 27.2 - oversold, MACD negative. Means selling was overdone, bounce expected but not confirmed as reversal. 4f8668a5
*Short-term view:* Range-bound $2,350 - $2,530. If ETH holds above $2,430, it can test $2,530. If it breaks below $2,329, risk of drop to $2,200. 9319
This is not financial advice - for that NVDAB $1 voucher you showed, ETH move of 1-2% is normal volatility.
#ETH #cryptouniverseofficial
101


·
--
🚀 $ETH — WATCH THIS LONG SETUP! 📈
👀 Entry Zone: $2,430–$2,370
🛑 Stop Loss: $2,350
🎯 Take Profit: $2,460–$2,489
ETH— Current Market Outlook 🔥
ETH closed its weekly candle above $2,386, successfully defending this key support zone.
If buyers continue to hold this level, ETH could potentially move higher toward $2,750–$2,800.
📊 Keep an eye on price action around support and wait for confirmation before entering a trade.
⚠️ Crypto is volatile. This is a market outlook, not a guaranteed profit signal. Always manage your risk."CLICK ON THE BELOW YELLOW COIN TAG TO GO TO DESIRED TRADING PAGE TO GET BENEFIT TRADE"$ETH
{spot}(ETHUSDT)
#ETH #Ethereum #CryptoAnalysis #altcoins
🚀 $ETH — WATCH THIS LONG SETUP! 📈
👀 Entry Zone: $2,430–$2,370
🛑 Stop Loss: $2,350
🎯 Take Profit: $2,460–$2,489
ETH— Current Market Outlook 🔥
ETH closed its weekly candle above $2,386, successfully defending this key support zone.
If buyers continue to hold this level, ETH could potentially move higher toward $2,750–$2,800.
📊 Keep an eye on price action around support and wait for confirmation before entering a trade.
⚠️ Crypto is volatile. This is a market outlook, not a guaranteed profit signal. Always manage your risk."CLICK ON THE BELOW YELLOW COIN TAG TO GO TO DESIRED TRADING PAGE TO GET BENEFIT TRADE"$ETH
#ETH #Ethereum #CryptoAnalysis #altcoins
1
124

🚨 $ETH REJECTED HARD AT KEY RESISTANCE AS BEARS EYE A FLIP TOWARD $2,350! 📉
Entry: 2,418 - 2,430 ⚡
Target: 2,350 🎯
Stop Loss: 2,447 🛑
Sellers aggressively defended the $2,440 ceiling, leaving upper wicks that signal immediate exhaustion among buyers. 📌 Once $2,400 breaks, order book depth thins out rapidly down toward $2,380 and $2,350.
Momentum is rolling over swiftly as aggressive bids dry up beneath the current distribution shelf. 🌊 If sellers maintain pressure below resistance, downside velocity will take the wheel. 💬 Are you front-running this breakdown or waiting for a reclaim? 👇
⚠️ Not financial advice. Always manage your risk. 🛡️
🏷️ #ETH #ShortSetup #Ethereum #CryptoTrading
🐻 🎯
38

ETH just bounced off the $2,350 area and is trading near $2,400 now
That $2,350 zone lines up with recent lows and the 100-day EMA around $2,355 where buyers stepped in before
The $2,500 target sits right at a heavy resistance cluster with the 50-day EMA near $2,496 and the 20-day EMA at $2,552
But there is a catch
Volume profile data shows rejection at the $2,505 node with a vacuum below price pointing toward $2,347 as the next shelf if momentum fails
So the setup is real but the $2,500 reclaim needs a clean break and close above that zone or the bounce fades back into the lower volume shelf
$ETH $AGT $Q #ETH #Crypto
{future}(QUSDT)
{alpha}(560x5dbde81fce337ff4bcaaee4ca3466c00aecae274)
{future}(ETHUSDT)
ETH just bounced off the $2,350 area and is trading near $2,400 now
That $2,350 zone lines up with recent lows and the 100-day EMA around $2,355 where buyers stepped in before
The $2,500 target sits right at a heavy resistance cluster with the 50-day EMA near $2,496 and the 20-day EMA at $2,552
But there is a catch
Volume profile data shows rejection at the $2,505 node with a vacuum below price pointing toward $2,347 as the next shelf if momentum fails
So the setup is real but the $2,500 reclaim needs a clean break and close above that zone or the bounce fades back into the lower volume shelf
$ETH $AGT $Q #ETH #Crypto
488

$ETH is 2,440.99 on the 4h, bouncing from the 2,318.94 low. RSI(6) is 61.7 and MACD is turning up. I'm holding with conviction.
$ETH
{future}(ETHUSDT)
#ETH
$ETH is 2,440.99 on the 4h, bouncing from the 2,318.94 low. RSI(6) is 61.7 and MACD is turning up. I'm holding with conviction.
$ETH
#ETH
$ETH
#ETH
1
32

·
--
$ETH : ONE MORE BUYING OPPORTUNITY BELOW $2,000?
Ethereum Is Testing A Critical Structural Zone On The HTF Chart.
🔹 Resistance: $3,000
🔹 Major Support: $1,800–$1,950
🔹 Bullish OB + FVG: Potential Demand Zone
🔹 Key Structure: Higher Highs (HH) & Higher Lows (HL)
If #ETH Maintains The HH/HL Pattern, A Pullback Below $2,000 Could Offer Another Buying Opportunity Before The Next Leg Up.
Invalidation: Failure To Hold The Key Demand Zone.
NFA. Always DYOR.
{future}(ETHUSDT)
$ETH : ONE MORE BUYING OPPORTUNITY BELOW $2,000?
Ethereum Is Testing A Critical Structural Zone On The HTF Chart.
🔹 Resistance: $3,000
🔹 Major Support: $1,800–$1,950
🔹 Bullish OB + FVG: Potential Demand Zone
🔹 Key Structure: Higher Highs (HH) & Higher Lows (HL)
If #ETH Maintains The HH/HL Pattern, A Pullback Below $2,000 Could Offer Another Buying Opportunity Before The Next Leg Up.
Invalidation: Failure To Hold The Key Demand Zone.
NFA. Always DYOR.
186
·
--
Bullish
📊 ETH/USDT — Key Levels
🟢 Support: $2,378 | $2,324
🔴 Resistance: $2,448 | $2,490
🚀 Breakout above $2,448 could open the way toward $2,557.
⚠️ Below $2,378, downside risk increases.
#ETH #Ethereum #ETHUSDT #BinanceSquare
$ETH
{spot}(ETHUSDT)
📊 ETH/USDT — Key Levels
🟢 Support: $2,378 | $2,324
🔴 Resistance: $2,448 | $2,490
🚀 Breakout above $2,448 could open the way toward $2,557.
⚠️ Below $2,378, downside risk increases.
#ETH #Ethereum #ETHUSDT #BinanceSquare
$ETH
🟢 Support: $2,378 | $2,324
🔴 Resistance: $2,448 | $2,490
🚀 Breakout above $2,448 could open the way toward $2,557.
⚠️ Below $2,378, downside risk increases.
#ETH #Ethereum #ETHUSDT #BinanceSquare
$ETH
1
90

·
--
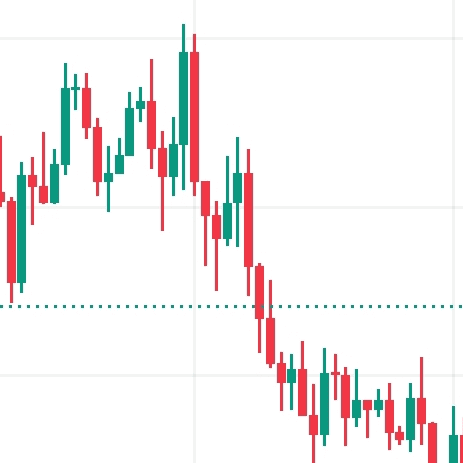
#ETH has rebounded from recent lows, but the short-term trend remains uncertain. Daily technical levels show support near $2,378 and resistance near $2,448.
Support: $2,378, then $2,324.
Resistance: $2,448, then $2,490.
Bullish scenario: A confirmed break above $2,448 may strengthen buying momentum.
Bearish scenario: A break below $2,378 may increase selling pressure.
Risk management: Wait for candle-close confirmation; avoid high leverage.ETH Candlestick Chart
The chart above is a schematic 15-minute chart, not a verified live Binance candle feed. The support and resistance levels are based on the daily technical analysis, so they are reference levels rather than confirmed 15-minute signals.
View the actual chart here: ETH/USDT on Binance.
My view: Watch $2,448 for a breakout and $2,378 for support. Wait for confirmation before entering a trade; neither direction is guaranteed.#ZcashNU7ProposalWouldFreezeSproutSpending #ChinaQ3GDPGrowthQuickensTo4.5%
65
Log in to explore more content
Join global crypto users on Binance Square
⚡️ Get latest and useful information about crypto.
💬 Trusted by the world’s largest crypto exchange.
👍 Discover real insights from verified creators.
Email / Phone number
Trending Topics
1
#CryptoVaultDepositsTop$10Billion
2,639 views
87 Discussing
2
#BitcoinSurpasses$83,000
2,403 views
20 Discussing
3
#USD1StablecoinLoses$400MMarketCapInTwoWeeks
1,280 views
44 Discussing
4
#JapanFSAPublishesOnChainFinanceForumMinutes
72,877 views
890 Discussing
5
#BitcoinReboundsAbove$82,000
5,764 views
19 Discussing
6
#BankOfRussiaSaysSelfCustodyBanStartsJuly2027
70,749 views
881 Discussing
7
#CFTCAdvancesVoluntaryRegCAMFramework
76,473 views
1,044 Discussing
8
#ChinaQ3GDPGrowthQuickensTo4.5%
36,156 views
721 Discussing
9
#ZcashNU7ProposalWouldFreezeSproutSpending
50,095 views
725 Discussing
10
#KOSPIOpens3.17%Lower
42,027 views
578 Discussing