
#exports
exports
10,491 views
44 Discussing
Hot
Latest



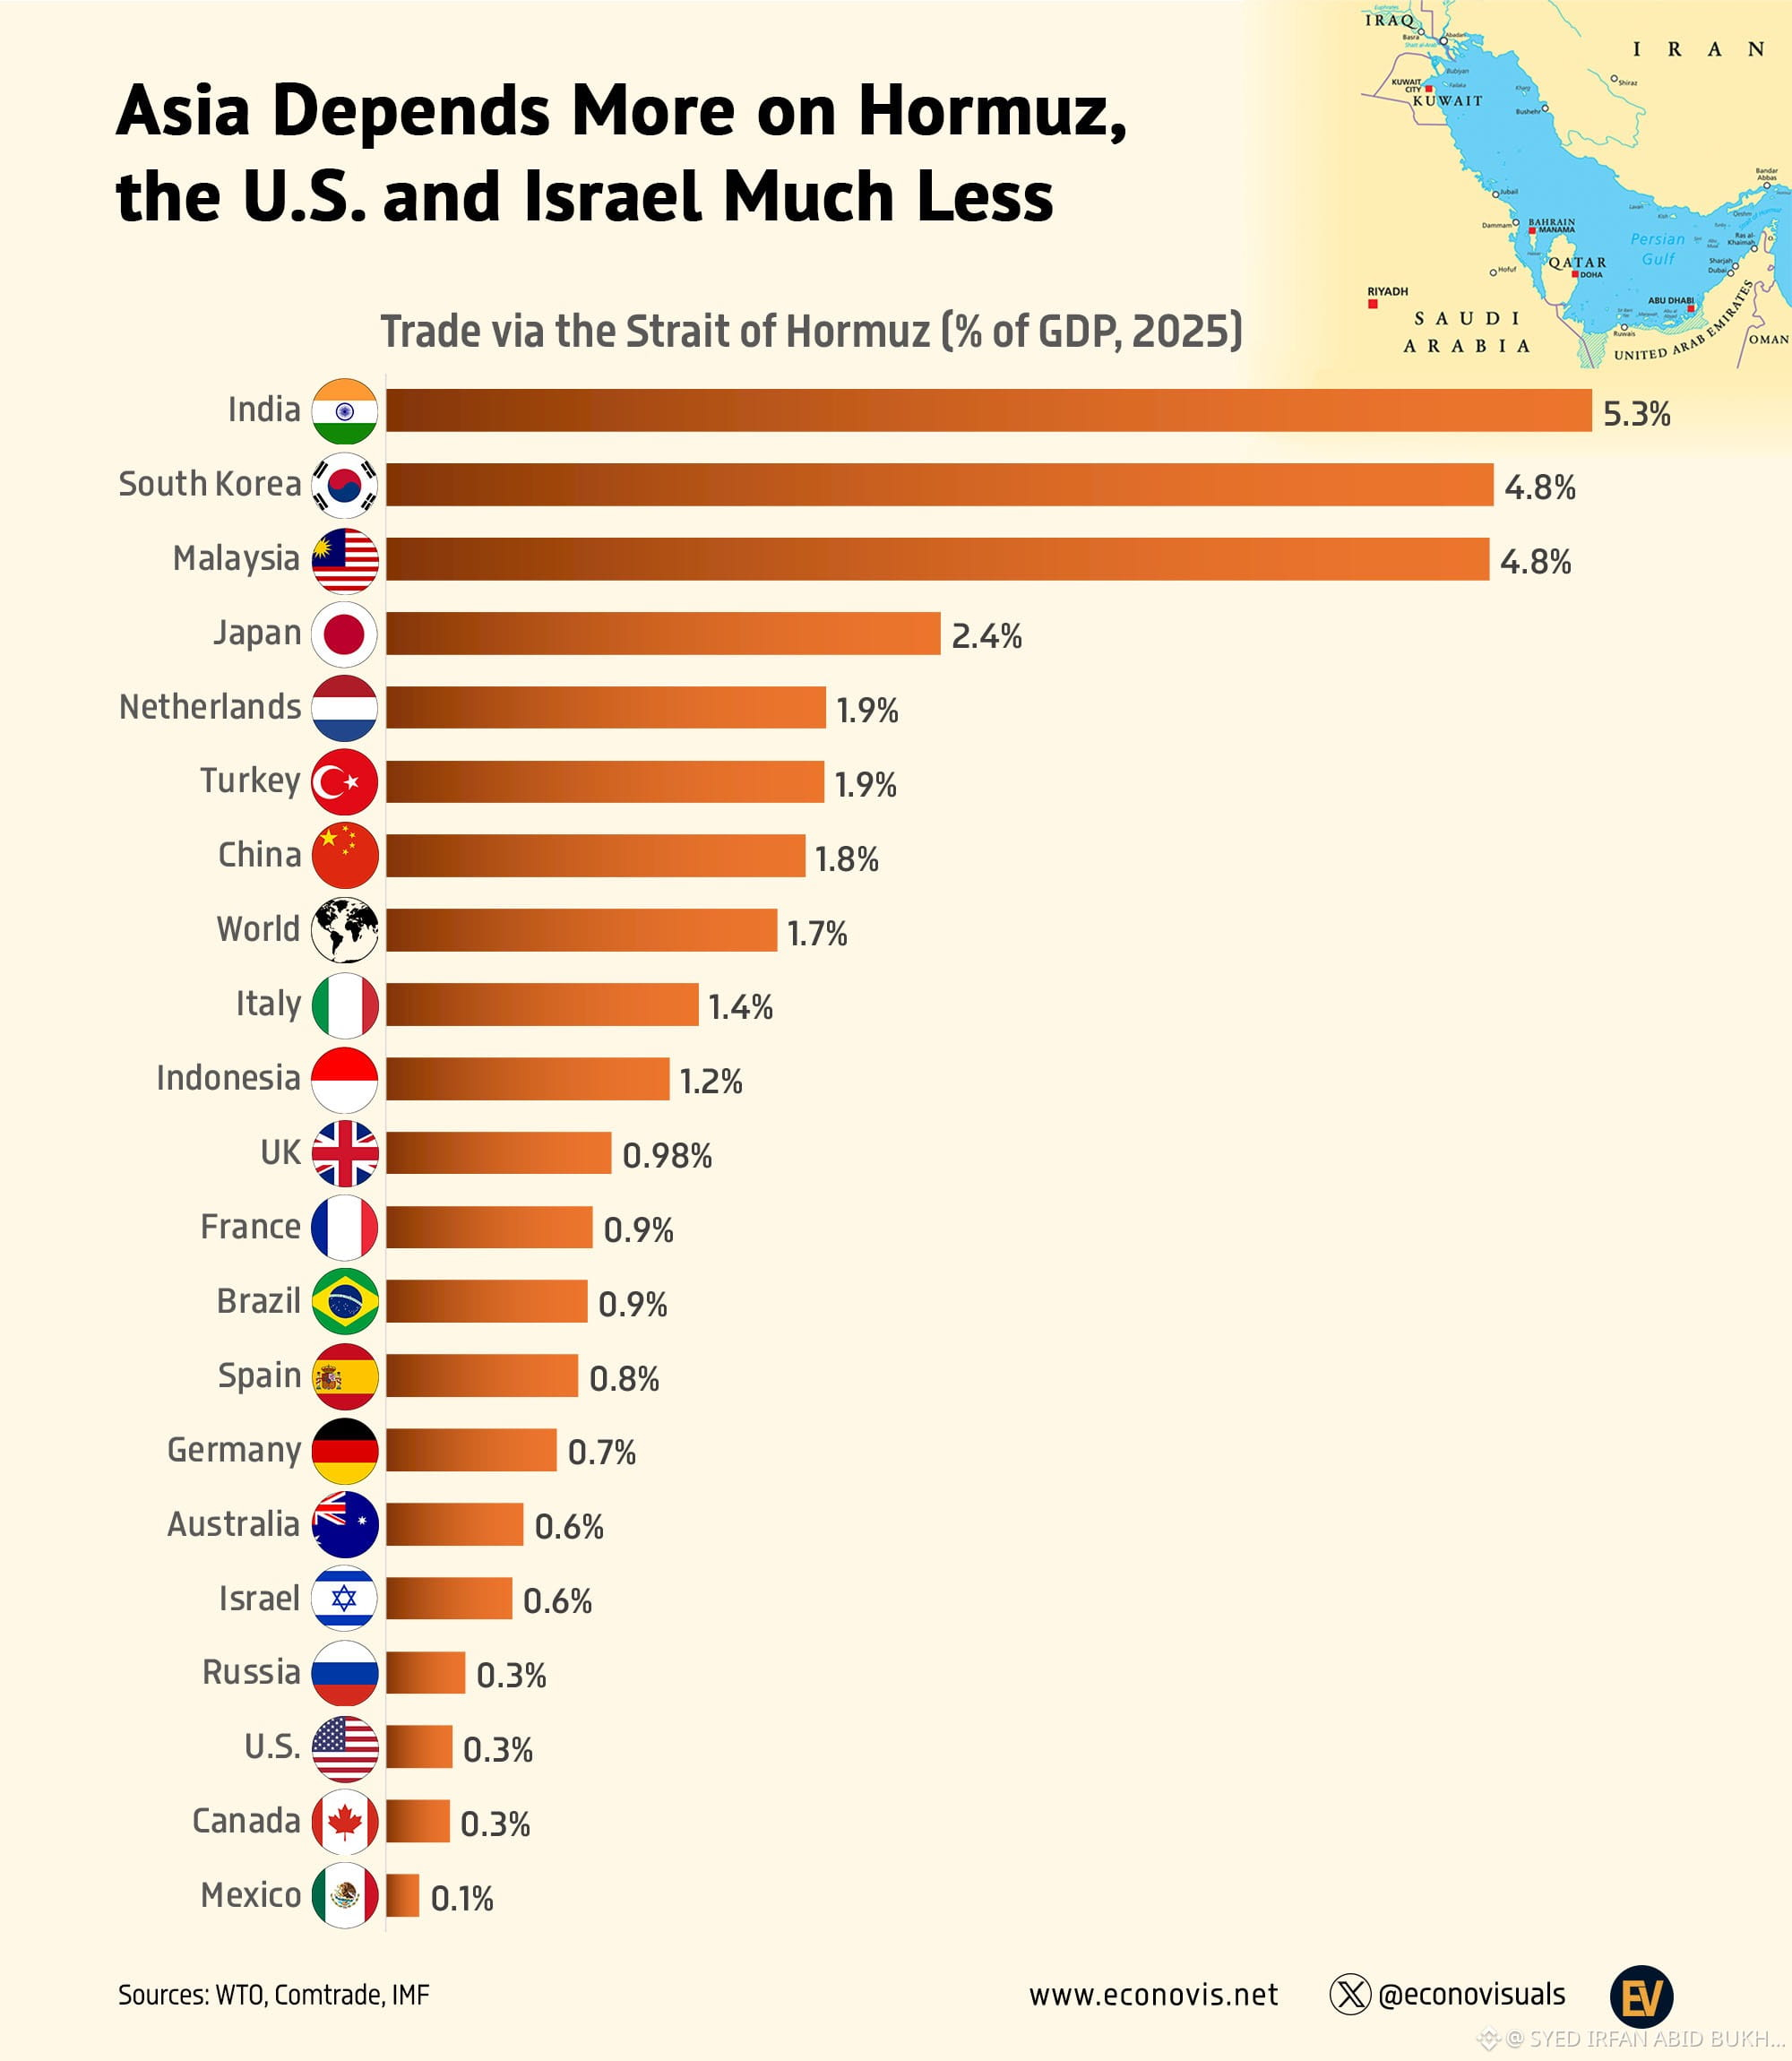
📈 Global Trade Skims Hormuz (3.8%)—Iran Depends on It (81%)
Global trade dependence on flows through the Strait of Hormuz is significantly lower than its critical role in energy markets. In 2025, only 3.8% of total world trade passed through the strait.
Dependence is notably higher across Asian economies. India shows the greatest exposure, with 18.1% of its total trade linked to Hormuz transit, followed by Japan (6.9%), South Korea (6.7%), and China (5.6%).
By contrast, Western economies exhibit relatively limited reliance. Trade flows through the strait account for just 2.1%–2.6% of total trade for the United Kingdom, Italy, and France, while the Netherlands (1.4%) and Germany (1.1%) show even lower exposure. The United States (1.6%) and Israel (2.2%) also maintain modest dependence.
In stark contrast, Iran remains overwhelmingly reliant on the strait, with approximately 81% of its total trade passing through Hormuz.
#USA #Iran #Israel #HormuzStrait #Hormuz #war #trade #exports #imports
Global trade dependence on flows through the Strait of Hormuz is significantly lower than its critical role in energy markets. In 2025, only 3.8% of total world trade passed through the strait.
Dependence is notably higher across Asian economies. India shows the greatest exposure, with 18.1% of its total trade linked to Hormuz transit, followed by Japan (6.9%), South Korea (6.7%), and China (5.6%).
By contrast, Western economies exhibit relatively limited reliance. Trade flows through the strait account for just 2.1%–2.6% of total trade for the United Kingdom, Italy, and France, while the Netherlands (1.4%) and Germany (1.1%) show even lower exposure. The United States (1.6%) and Israel (2.2%) also maintain modest dependence.
In stark contrast, Iran remains overwhelmingly reliant on the strait, with approximately 81% of its total trade passing through Hormuz.
#USA #Iran #Israel #HormuzStrait #Hormuz #war #trade #exports #imports
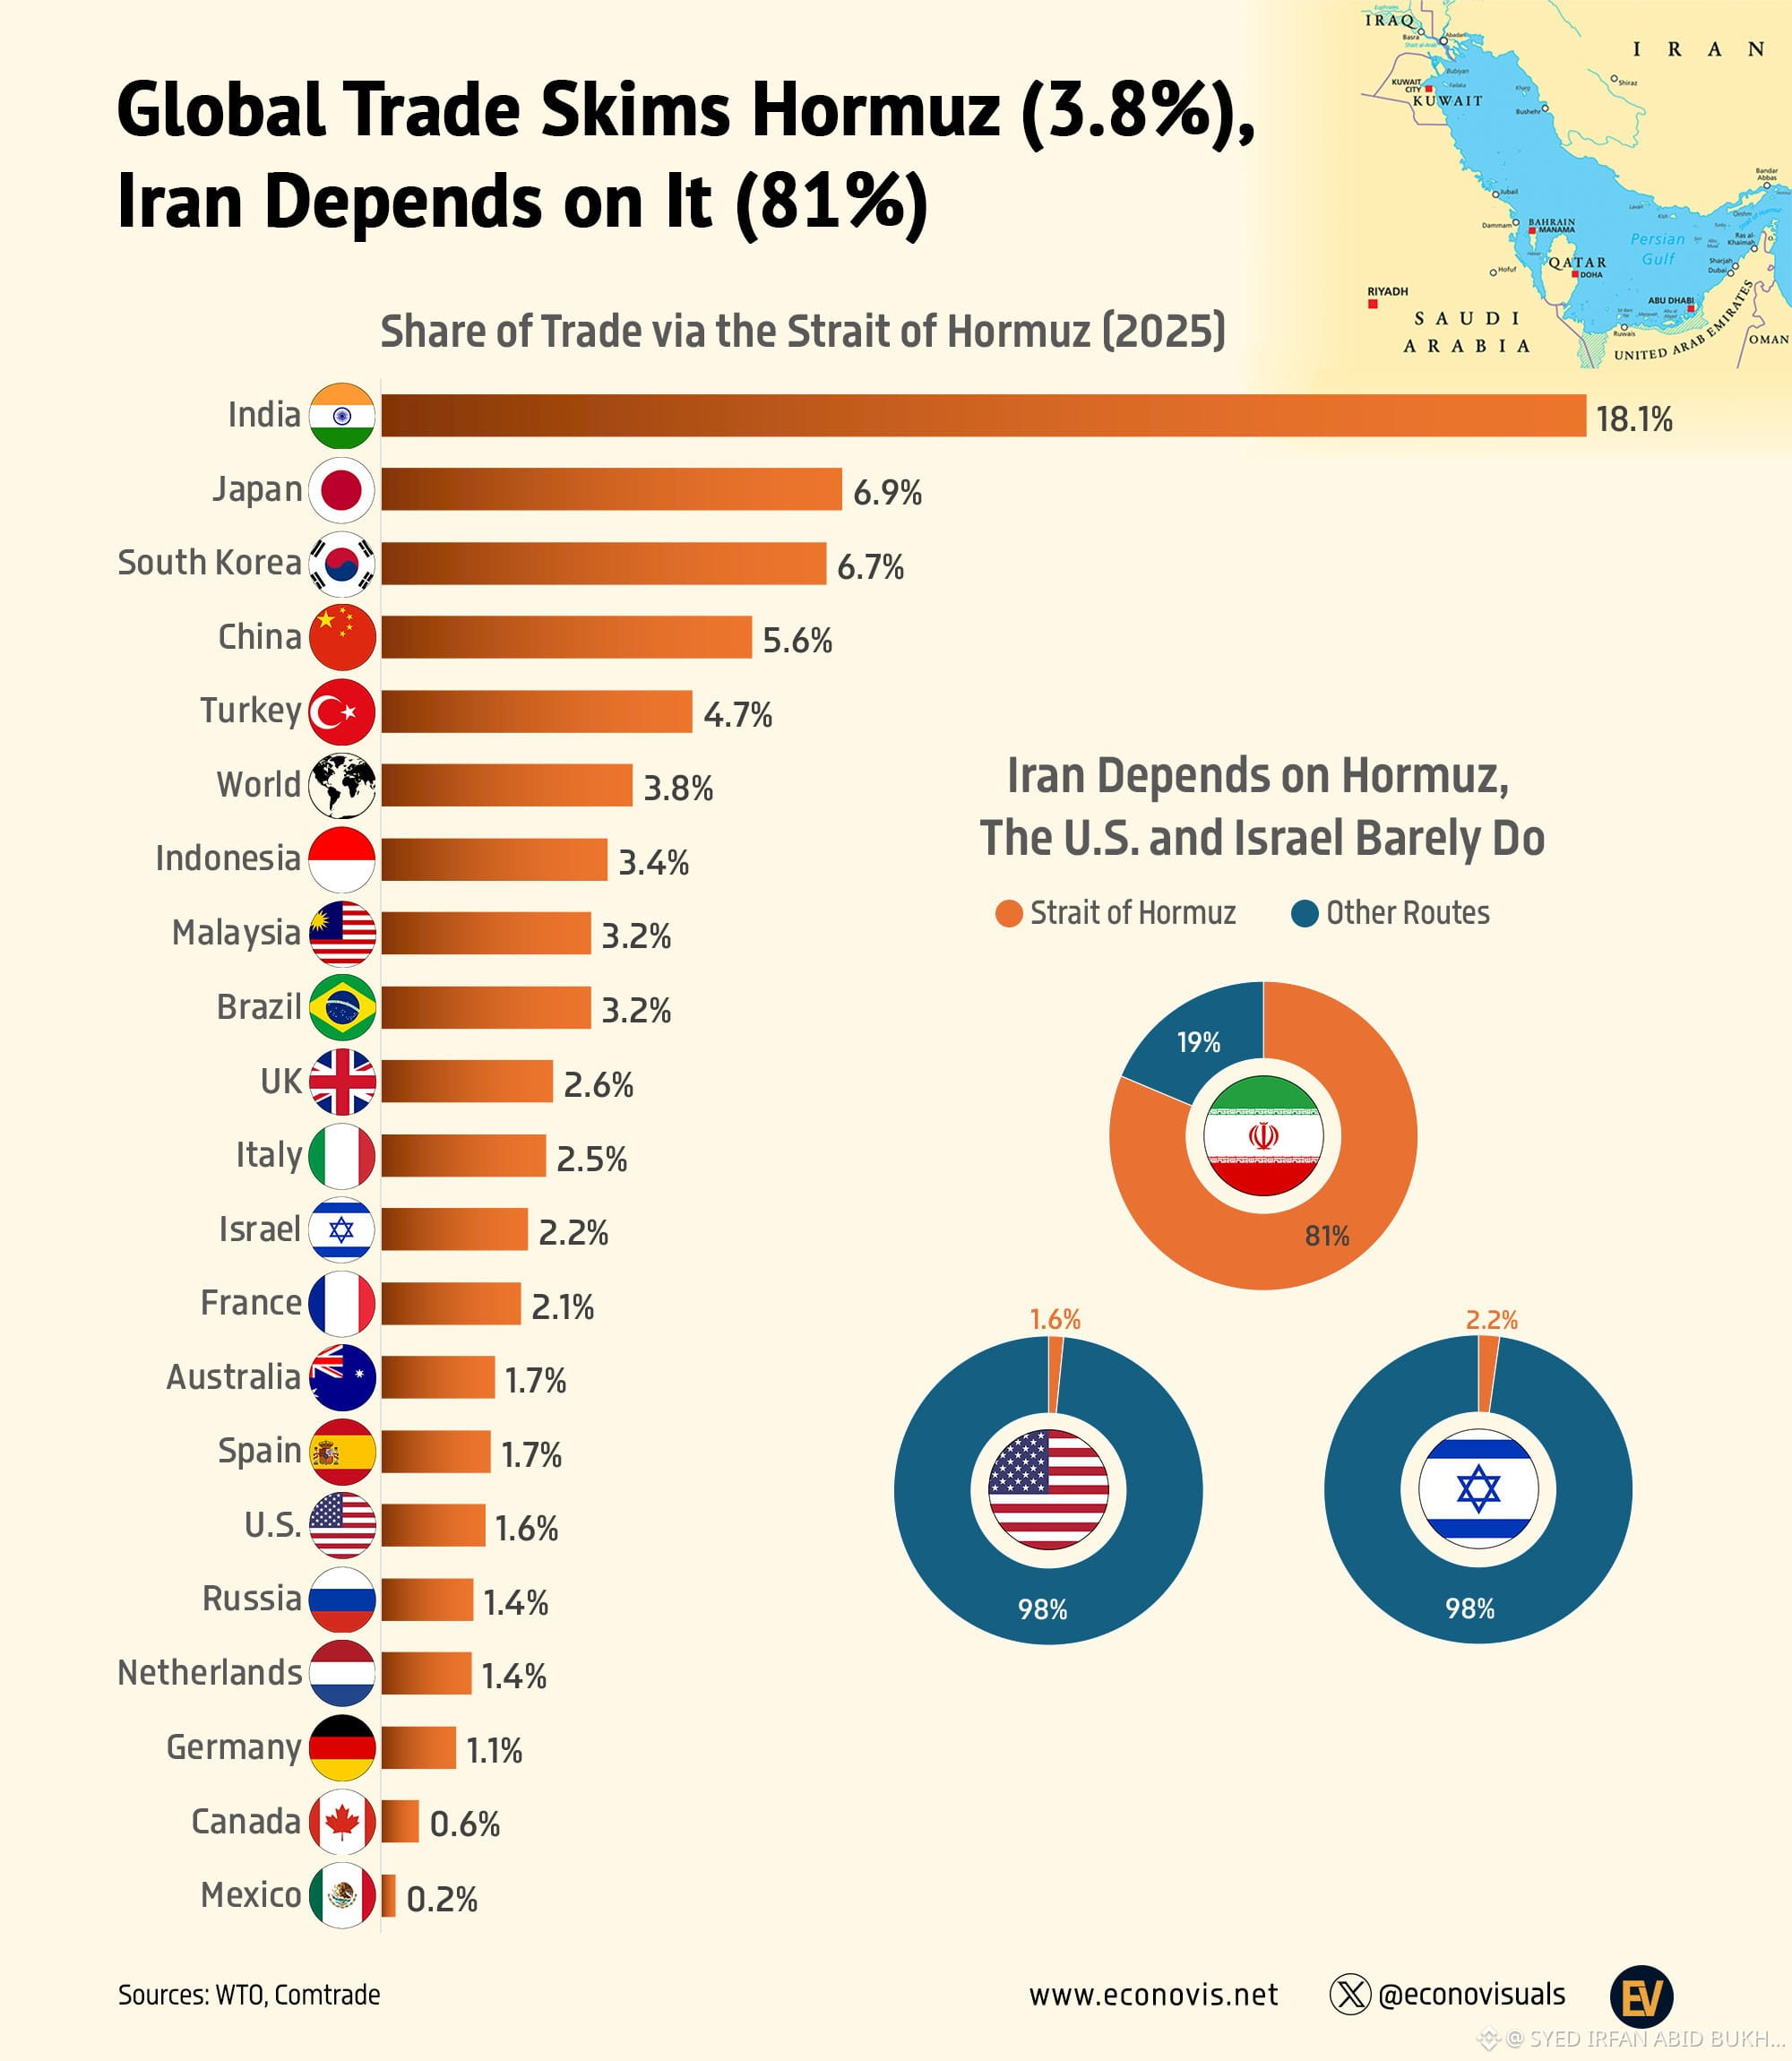
📈 Asia Depends More on Hormuz, the U.S. and Israel Much Less
The global economy’s dependence on trade flows through the Strait of Hormuz is significantly lower than its reliance on energy shipments. In 2025, goods trade transiting the strait accounted for just 1.7% of global GDP (equivalent to 3.8% of total world trade).
Economic exposure is more pronounced in Asia. India shows the highest dependence, with Hormuz-linked trade equal to 5.3% of GDP, followed by South Korea and Malaysia (both 4.8%), Japan (2.4%), and China (1.8%).
In contrast, Western economies exhibit relatively limited exposure. The Netherlands (1.9%) and Italy (1.4%) show moderate dependence, while the United Kingdom, France, Spain, and Germany each remain below 1% of GDP. The United States (0.3%) and Israel (0.6%) have even lower economic reliance on Hormuz trade flows.
By comparison, Iran stands out as highly dependent, with approximately 40% of its GDP tied to trade passing through the strait.
#USA #Iran #Israel #HormuzStrait #Hormuz #war #trade #exports #imports
The global economy’s dependence on trade flows through the Strait of Hormuz is significantly lower than its reliance on energy shipments. In 2025, goods trade transiting the strait accounted for just 1.7% of global GDP (equivalent to 3.8% of total world trade).
Economic exposure is more pronounced in Asia. India shows the highest dependence, with Hormuz-linked trade equal to 5.3% of GDP, followed by South Korea and Malaysia (both 4.8%), Japan (2.4%), and China (1.8%).
In contrast, Western economies exhibit relatively limited exposure. The Netherlands (1.9%) and Italy (1.4%) show moderate dependence, while the United Kingdom, France, Spain, and Germany each remain below 1% of GDP. The United States (0.3%) and Israel (0.6%) have even lower economic reliance on Hormuz trade flows.
By comparison, Iran stands out as highly dependent, with approximately 40% of its GDP tied to trade passing through the strait.
#USA #Iran #Israel #HormuzStrait #Hormuz #war #trade #exports #imports

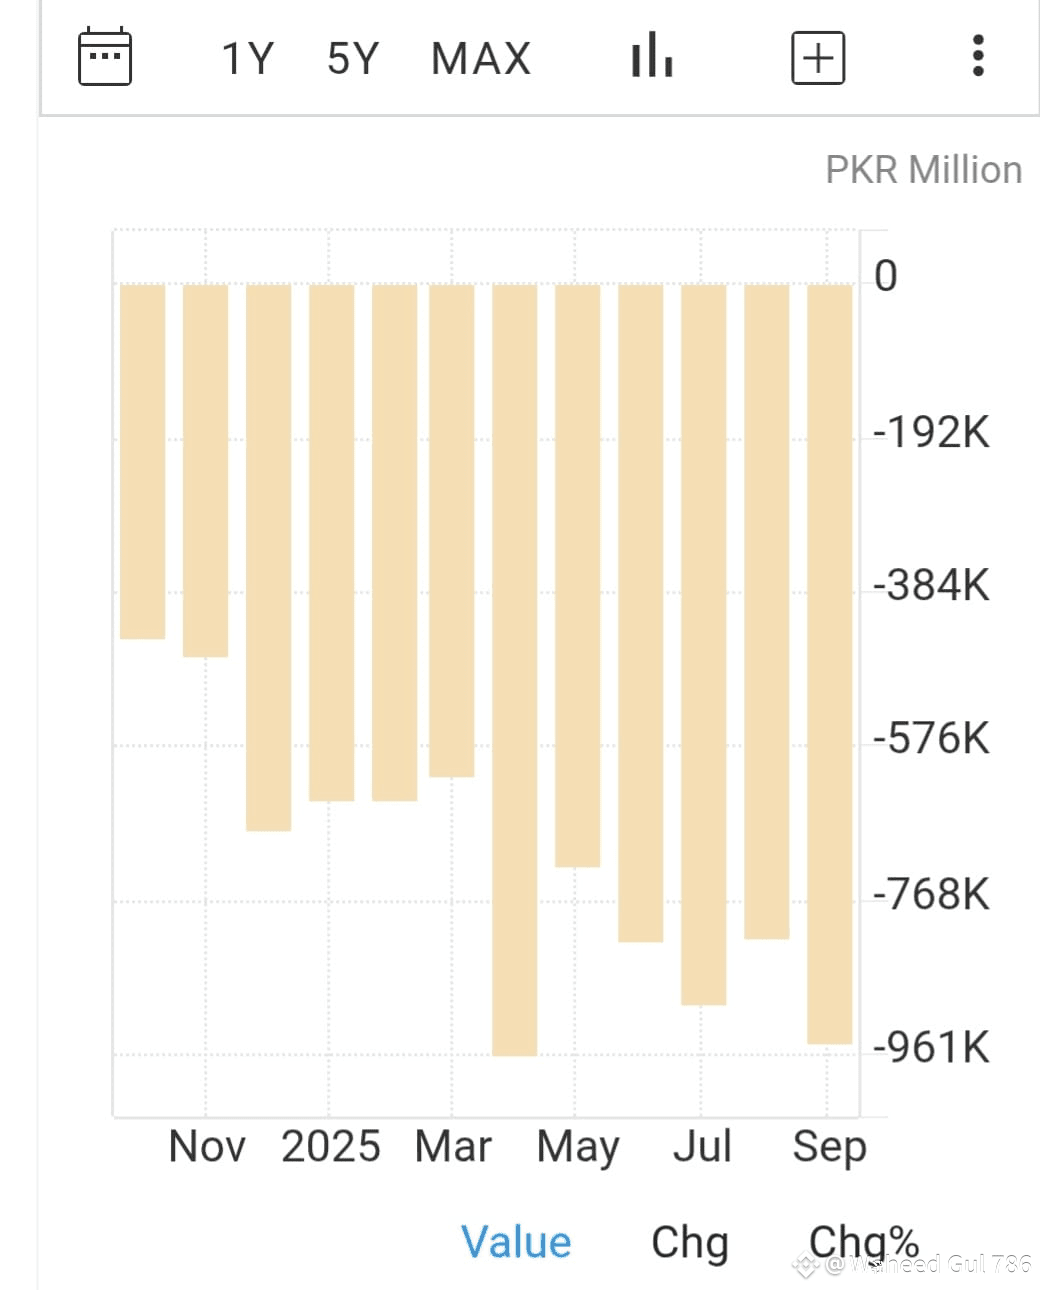
📉 BREAKING: Pakistan Records PKR 943,067 Million Trade Deficit in Sept 2025
According to the Pakistan Bureau of Statistics, Pakistan registered a trade deficit of PKR 943.07 billion in September 2025. Historically, the country's Balance of Trade has averaged -88,415.95 million PKR from 1957 to 2025, reflecting a persistent trade imbalance. The highest trade surplus was recorded in June 2003 at PKR 6,457 million, while the largest deficit occurred in June 2022, reaching -PKR 1,013,894 million. This recent figure highlights ongoing economic challenges, including rising imports and pressure on foreign reserves. Policymakers may need to implement stronger trade and fiscal reforms to stabilize the economy.
#PakistanEconomy #TradeDeficit #PBS #Imports #Exports
According to the Pakistan Bureau of Statistics, Pakistan registered a trade deficit of PKR 943.07 billion in September 2025. Historically, the country's Balance of Trade has averaged -88,415.95 million PKR from 1957 to 2025, reflecting a persistent trade imbalance. The highest trade surplus was recorded in June 2003 at PKR 6,457 million, while the largest deficit occurred in June 2022, reaching -PKR 1,013,894 million. This recent figure highlights ongoing economic challenges, including rising imports and pressure on foreign reserves. Policymakers may need to implement stronger trade and fiscal reforms to stabilize the economy.
#PakistanEconomy #TradeDeficit #PBS #Imports #Exports

🛢️ *GULF OIL EXPORTS PLUNGE* 🌍
- Shipments from 8 Gulf producers fell ∼61% week of Mar 15 vs. Feb average
- 9.71M bpd vs. 25.13M bpd in February (Kpler data)
- Covers Saudi Arabia, Iran, Iraq, UAE, Kuwait, Qatar, Oman, Bahrain
- Before conflict, they made up 36% of global seaborne oil exports
#Energy. #MiddleEastCrisis #GulfNews #Exports #Jin10
- Shipments from 8 Gulf producers fell ∼61% week of Mar 15 vs. Feb average
- 9.71M bpd vs. 25.13M bpd in February (Kpler data)
- Covers Saudi Arabia, Iran, Iraq, UAE, Kuwait, Qatar, Oman, Bahrain
- Before conflict, they made up 36% of global seaborne oil exports
#Energy. #MiddleEastCrisis #GulfNews #Exports #Jin10



Log in to explore more content