

#bitcoinetfstake
bitcoinetfstake
584 views
19 Discussing
Hot
Latest

Most people treat Bitcoin ETFs like a one-way vault that only ever takes $BTC off the market.
You FOMO in after another week of inflows, convinced supply is getting locked up for good, then get wrecked when redemptions start and the same coins hit the order books overnight.
I've been tracking the creation and redemption data like it's on-chain because it basically is. Authorized participants can create shares by delivering BTC or redeem them and take the coins back to sell. That's the part the timeline skips. With Fear and Greed sitting at 69, everyone is greedy and assuming the bid never leaves. But look at the macro. Ten-year yields pushing toward 5% and a strong dollar historically kill risk appetite fast. When that happens, institutions don't hold for you. They redeem. Last time we saw a cluster of outflows, $BTC sold off hard and it dragged $ETH plus names like $AAVE down with it.
The part that actually matters is concentration. A handful of ETFs now control a massive slice of liquid supply. One large redemption doesn't look like a random whale. It looks like coordinated selling pressure that retail never sees coming until the candles are already red.
Where do you think this goes if yields keep grinding higher from here?
#BitcoinETFsTake #US10YearYieldNears5 #DollarIndexHitsHighestSinceMay2025
Most people treat Bitcoin ETFs like a one-way vault that only ever takes $BTC off the market.
You FOMO in after another week of inflows, convinced supply is getting locked up for good, then get wrecked when redemptions start and the same coins hit the order books overnight.
I've been tracking the creation and redemption data like it's on-chain because it basically is. Authorized participants can create shares by delivering BTC or redeem them and take the coins back to sell. That's the part the timeline skips. With Fear and Greed sitting at 69, everyone is greedy and assuming the bid never leaves. But look at the macro. Ten-year yields pushing toward 5% and a strong dollar historically kill risk appetite fast. When that happens, institutions don't hold for you. They redeem. Last time we saw a cluster of outflows, $BTC sold off hard and it dragged $ETH plus names like $AAVE down with it.
The part that actually matters is concentration. A handful of ETFs now control a massive slice of liquid supply. One large redemption doesn't look like a random whale. It looks like coordinated selling pressure that retail never sees coming until the candles are already red.
Where do you think this goes if yields keep grinding higher from here?
#BitcoinETFsTake #US10YearYieldNears5 #DollarIndexHitsHighestSinceMay2025
You FOMO in after another week of inflows, convinced supply is getting locked up for good, then get wrecked when redemptions start and the same coins hit the order books overnight.
I've been tracking the creation and redemption data like it's on-chain because it basically is. Authorized participants can create shares by delivering BTC or redeem them and take the coins back to sell. That's the part the timeline skips. With Fear and Greed sitting at 69, everyone is greedy and assuming the bid never leaves. But look at the macro. Ten-year yields pushing toward 5% and a strong dollar historically kill risk appetite fast. When that happens, institutions don't hold for you. They redeem. Last time we saw a cluster of outflows, $BTC sold off hard and it dragged $ETH plus names like $AAVE down with it.
The part that actually matters is concentration. A handful of ETFs now control a massive slice of liquid supply. One large redemption doesn't look like a random whale. It looks like coordinated selling pressure that retail never sees coming until the candles are already red.
Where do you think this goes if yields keep grinding higher from here?
#BitcoinETFsTake #US10YearYieldNears5 #DollarIndexHitsHighestSinceMay2025
64

·
--
Everyone thinks institutional ETF inflows mean instant green candles across the entire market, but actually, they often mask aggressive spot distribution behind closed doors. Most retail investors rush to buy high-beta tokens like $NEAR or enter leveraged positions the moment they see positive flow headlines, only to end up trapped when liquidity suddenly thins out.
Think of an ETF vehicle less like a firehose of free cash and more like a slow-moving sponge. When institutions allocate capital, their hedging strategies and multi-day settlement cycles operate on a completely different rhythm than typical retail order books. While billions quietly settle into $BTC funds, that capital rarely rotates down the risk curve into other assets the way traders assume it will during a classic run.
Instead of chasing momentum every time an inflow report drops, watching net liquidity in $USDT and tracking real spot market depth will give you a far more honest picture of where things stand. Where do you think this institutional dynamic takes retail liquidity from here?
#BitcoinETFsTake #DollarIndexHitsHighestSinceMay2025 #US10YearYieldNears5
Everyone thinks institutional ETF inflows mean instant green candles across the entire market, but actually, they often mask aggressive spot distribution behind closed doors. Most retail investors rush to buy high-beta tokens like $NEAR or enter leveraged positions the moment they see positive flow headlines, only to end up trapped when liquidity suddenly thins out.
Think of an ETF vehicle less like a firehose of free cash and more like a slow-moving sponge. When institutions allocate capital, their hedging strategies and multi-day settlement cycles operate on a completely different rhythm than typical retail order books. While billions quietly settle into $BTC funds, that capital rarely rotates down the risk curve into other assets the way traders assume it will during a classic run.
Instead of chasing momentum every time an inflow report drops, watching net liquidity in $USDT and tracking real spot market depth will give you a far more honest picture of where things stand. Where do you think this institutional dynamic takes retail liquidity from here?
#BitcoinETFsTake #DollarIndexHitsHighestSinceMay2025 #US10YearYieldNears5
Think of an ETF vehicle less like a firehose of free cash and more like a slow-moving sponge. When institutions allocate capital, their hedging strategies and multi-day settlement cycles operate on a completely different rhythm than typical retail order books. While billions quietly settle into $BTC funds, that capital rarely rotates down the risk curve into other assets the way traders assume it will during a classic run.
Instead of chasing momentum every time an inflow report drops, watching net liquidity in $USDT and tracking real spot market depth will give you a far more honest picture of where things stand. Where do you think this institutional dynamic takes retail liquidity from here?
#BitcoinETFsTake #DollarIndexHitsHighestSinceMay2025 #US10YearYieldNears5
178

·
--
Bullish
#BitcoinETFsTake $6.34BillionInQ3
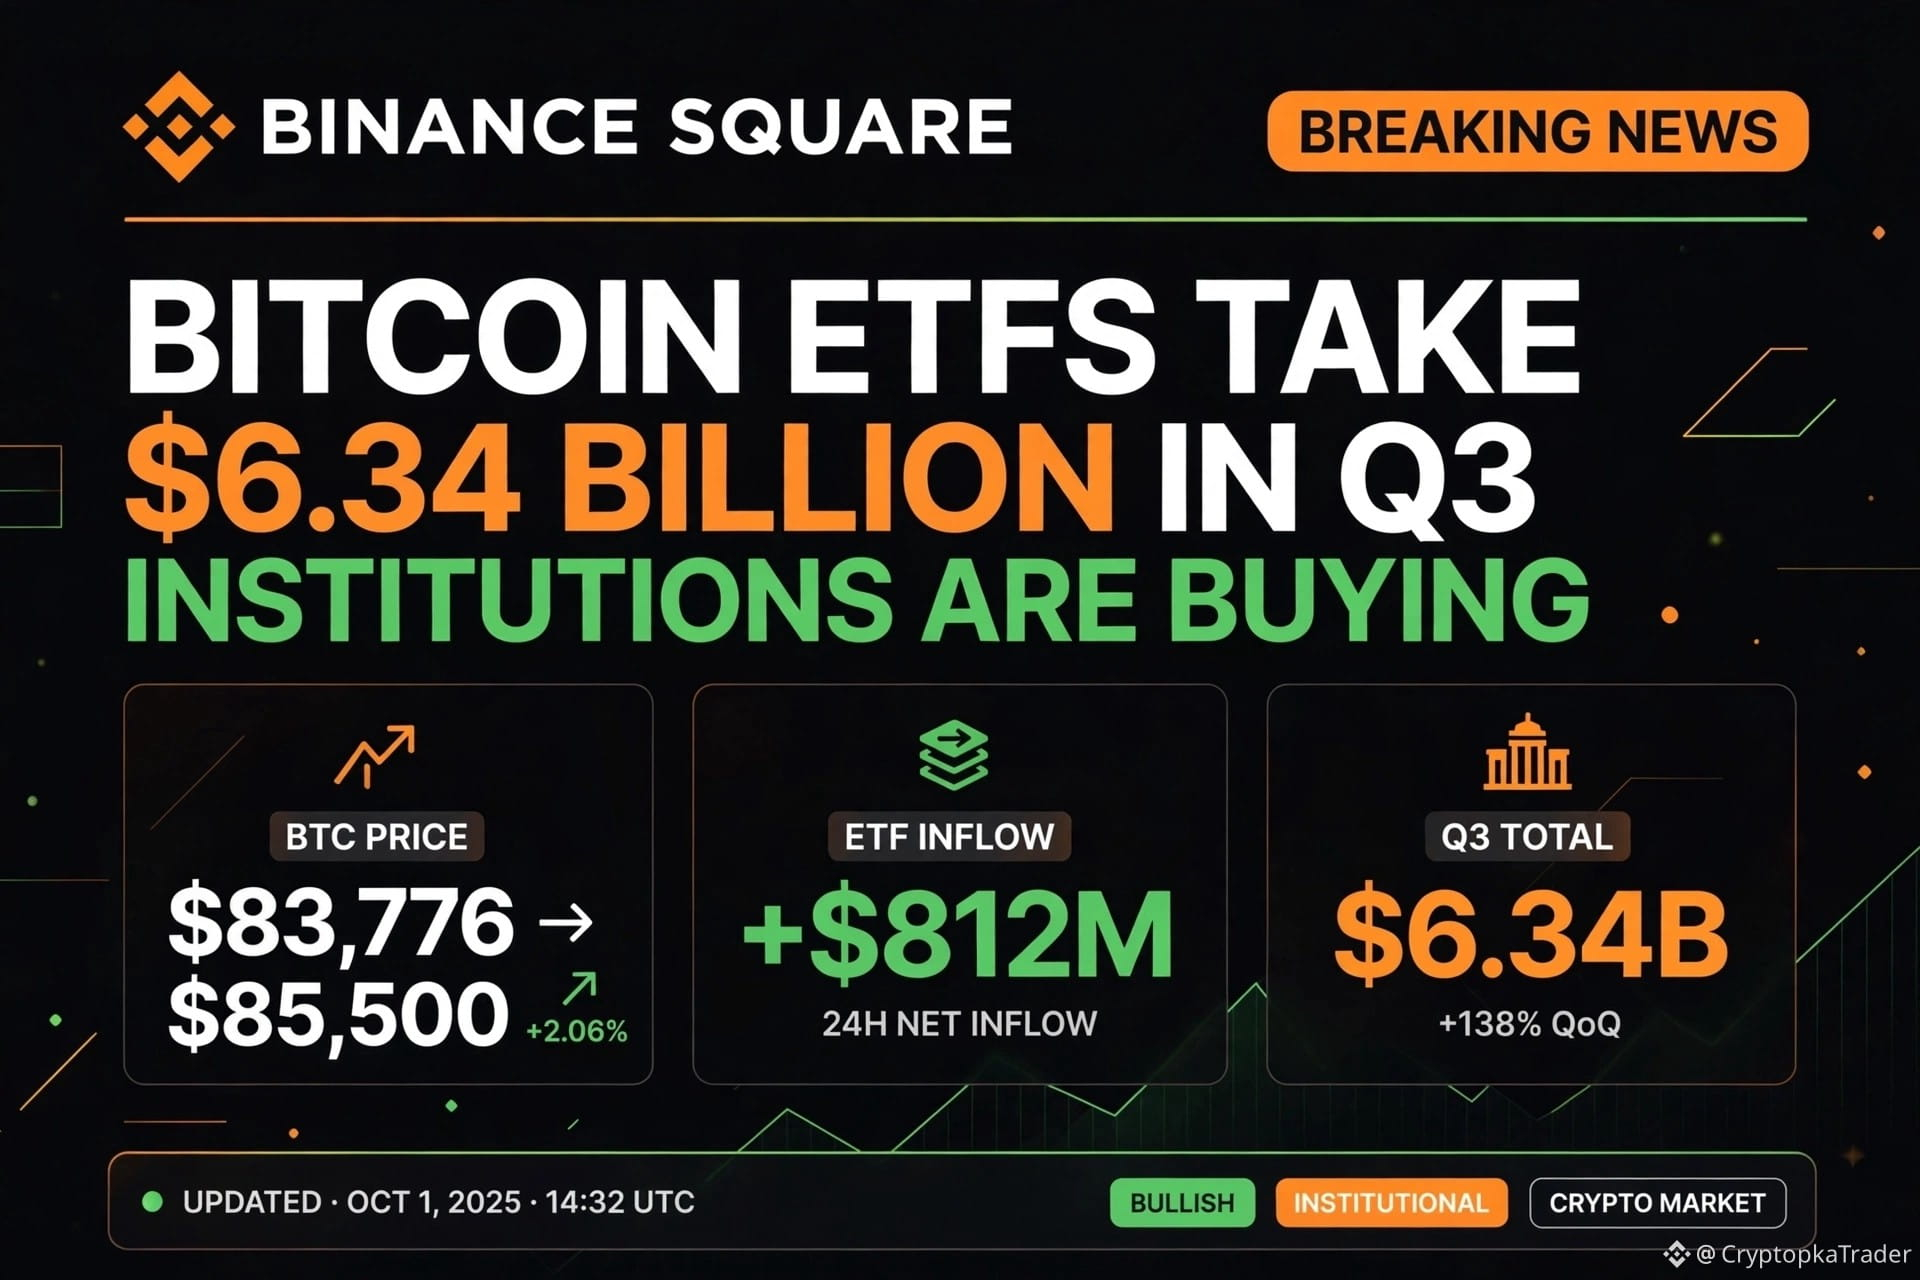
🚨 Bitcoin ETFs Take $6.34B in Q3 - INSTITUTIONS ARE BUYING!
Bitcoin ETFs took $6.34B in Q3 alone! 🏦
$BTC $83,776 → $85,500 after cooler PCE
ETFs +$812M this week, Volume 89.78B
Wall St is accumulating, retail is fearing US10Y Yield 5.3%
Who is bullish for Q4? 🚀👇
$BTC $ETH
#BitcoinETFsTake #BTC #Crypto
{spot}(ETHUSDT)
#BitcoinETFsTake $6.34BillionInQ3
🚨 Bitcoin ETFs Take $6.34B in Q3 - INSTITUTIONS ARE BUYING!
Bitcoin ETFs took $6.34B in Q3 alone! 🏦
$BTC $83,776 → $85,500 after cooler PCE
ETFs +$812M this week, Volume 89.78B
Wall St is accumulating, retail is fearing US10Y Yield 5.3%
Who is bullish for Q4? 🚀👇
$BTC $ETH
#BitcoinETFsTake #BTC #Crypto
🚨 Bitcoin ETFs Take $6.34B in Q3 - INSTITUTIONS ARE BUYING!
Bitcoin ETFs took $6.34B in Q3 alone! 🏦
$BTC $83,776 → $85,500 after cooler PCE
ETFs +$812M this week, Volume 89.78B
Wall St is accumulating, retail is fearing US10Y Yield 5.3%
Who is bullish for Q4? 🚀👇
$BTC $ETH
#BitcoinETFsTake #BTC #Crypto
20

·
--
Bullish
#BitcoinETFsTake $6.34BillionInQ3
💡 Unique Perspective: The real story behind Bitcoin ETF growth may be the gradual shift from retail-driven market activity toward a market where traditional finance plays a larger role. The important question is whether this demand can remain consistent beyond one quarter.
Is $6.34 billion in quarterly ETF inflows the beginning of a longer-term institutional trend, or just a temporary wave of market optimism?
$BTC
{future}(BTCUSDT)
#BitcoinETFsTake $6.34BillionInQ3
💡 Unique Perspective: The real story behind Bitcoin ETF growth may be the gradual shift from retail-driven market activity toward a market where traditional finance plays a larger role. The important question is whether this demand can remain consistent beyond one quarter.
Is $6.34 billion in quarterly ETF inflows the beginning of a longer-term institutional trend, or just a temporary wave of market optimism?
$BTC
💡 Unique Perspective: The real story behind Bitcoin ETF growth may be the gradual shift from retail-driven market activity toward a market where traditional finance plays a larger role. The important question is whether this demand can remain consistent beyond one quarter.
Is $6.34 billion in quarterly ETF inflows the beginning of a longer-term institutional trend, or just a temporary wave of market optimism?
$BTC
55

·
--
Bitcoin ETF Net Inflows Rank on the Hot List in Q3|Net Outflow on the Last Day of September|BTC at 835,000 yuan I don’t chase old funds
My stance is to acknowledge that institutional channels still matter, but in trading I only recognize new inflows and price confirmation—I won’t substitute today’s buy pressure with a cumulative figure from an entire quarter. The accurate trending topic on Binance Square right now is #BitcoinETFsTake$6.34BillionInQ3. Market reports cite SoSoValue’s numbers, saying U.S. spot Bitcoin ETFs saw net inflows of about $6.34 billion in Q3; it’s the total from July to September, not the amount到账 on a single day today, and not a comparable incremental addition that already exists in October. To verify the short-term direction, I checked Farside’s daily fund flow table: on September 29 the total net inflow was about $66.2 million, but on September 30 it flipped to a net outflow of about $148.7 million. Two data sources may differ due to update timestamps, which funds are included, and revised values—so the quarterly total should be stated with its methodology, and shouldn’t be treated as an exact real-time quote of exchange cash flow.
Mechanically, ETF subscriptions can create Bitcoin exposure demand through market-making and the creation/redemption chain involving authorized participants; redemptions may pass the effect in the opposite direction. But in the secondary market, trading volume, the rise in the fund’s NAV price, and actual net subscriptions are three different things. Quarterly inflows indicate that traditional accounts increased allocations over that period, but they don’t guarantee that marginal buying pressure continues today. A daily turn negative isn’t proof that institutions are fully withdrawing, and you also can’t infer that next quarter must be weaker from one day’s data. My key judgment is to watch whether net flows remain consistently positive (or at least stable) for several consecutive days, whether the price can re-stabilize around resistance, and whether U.S. Treasury yields and tomorrow night’s employment data change expectations for funding costs.
The market has already shown disagreement. When writing, Binance BTC/USDT is around $83,479, down about 2.15% over 24 hours, with a range of 83,186—85,563. The hot-list quarterly fund flows are historical cumulative figures, while the current price is clearly below this 24-hour session’s open at 85,311; both can be true at the same time—no contradiction. I won’t attribute the pullback entirely to the ETF outflow on September 30, and I also won’t say the quarterly funds have already disappeared. If later Farside updates show continued inflows, and BTC recovers 84,200 and can hold it, then today’s cautious judgment may be overturned. If it keeps falling below 83,180, even if the quarterly numbers look good, I will first respect the market price.
If I were trading this myself, I wouldn’t enter—I’d stay on the sidelines and keep position size at 0%. Only if within one hour the price reclaims 84,200, then pulls back to 83,900—84,200 and holds, and if on U.S. equity trading days the ETF net flow is no longer continuously negative, would I attempt a spot long with at most 1% of total funds, without leverage. First target: 85,200 (take half off). Second target: 86,200 (close the remaining position). After entering, if within one hour price falls back below 83,600 I’d take half off; set a hard stop at 83,150 and close all. If price loses 83,180 first, cancel the long plan—I won’t add just to chase a quarterly “hot list” figure. Fund daily data only becomes fully available after the U.S. market closes; if it hasn’t fully updated yet, I’ll write “pending confirmation” and won’t treat blank items as zero.
Source: Farside daily fund flow table for U.S. spot Bitcoin ETFs; Cointelegraph citing SoSoValue Q3 totals; Binance BTC/USDT live quotes. #BitcoinETFsTake$6.34BillionInQ3 #BTC
The above is only my personal market observation and does not constitute investment advice.
Bitcoin ETF Net Inflows Rank on the Hot List in Q3|Net Outflow on the Last Day of September|BTC at 835,000 yuan I don’t chase old funds
My stance is to acknowledge that institutional channels still matter, but in trading I only recognize new inflows and price confirmation—I won’t substitute today’s buy pressure with a cumulative figure from an entire quarter. The accurate trending topic on Binance Square right now is #BitcoinETFsTake$6.34BillionInQ3. Market reports cite SoSoValue’s numbers, saying U.S. spot Bitcoin ETFs saw net inflows of about $6.34 billion in Q3; it’s the total from July to September, not the amount到账 on a single day today, and not a comparable incremental addition that already exists in October. To verify the short-term direction, I checked Farside’s daily fund flow table: on September 29 the total net inflow was about $66.2 million, but on September 30 it flipped to a net outflow of about $148.7 million. Two data sources may differ due to update timestamps, which funds are included, and revised values—so the quarterly total should be stated with its methodology, and shouldn’t be treated as an exact real-time quote of exchange cash flow.
Mechanically, ETF subscriptions can create Bitcoin exposure demand through market-making and the creation/redemption chain involving authorized participants; redemptions may pass the effect in the opposite direction. But in the secondary market, trading volume, the rise in the fund’s NAV price, and actual net subscriptions are three different things. Quarterly inflows indicate that traditional accounts increased allocations over that period, but they don’t guarantee that marginal buying pressure continues today. A daily turn negative isn’t proof that institutions are fully withdrawing, and you also can’t infer that next quarter must be weaker from one day’s data. My key judgment is to watch whether net flows remain consistently positive (or at least stable) for several consecutive days, whether the price can re-stabilize around resistance, and whether U.S. Treasury yields and tomorrow night’s employment data change expectations for funding costs.
The market has already shown disagreement. When writing, Binance BTC/USDT is around $83,479, down about 2.15% over 24 hours, with a range of 83,186—85,563. The hot-list quarterly fund flows are historical cumulative figures, while the current price is clearly below this 24-hour session’s open at 85,311; both can be true at the same time—no contradiction. I won’t attribute the pullback entirely to the ETF outflow on September 30, and I also won’t say the quarterly funds have already disappeared. If later Farside updates show continued inflows, and BTC recovers 84,200 and can hold it, then today’s cautious judgment may be overturned. If it keeps falling below 83,180, even if the quarterly numbers look good, I will first respect the market price.
If I were trading this myself, I wouldn’t enter—I’d stay on the sidelines and keep position size at 0%. Only if within one hour the price reclaims 84,200, then pulls back to 83,900—84,200 and holds, and if on U.S. equity trading days the ETF net flow is no longer continuously negative, would I attempt a spot long with at most 1% of total funds, without leverage. First target: 85,200 (take half off). Second target: 86,200 (close the remaining position). After entering, if within one hour price falls back below 83,600 I’d take half off; set a hard stop at 83,150 and close all. If price loses 83,180 first, cancel the long plan—I won’t add just to chase a quarterly “hot list” figure. Fund daily data only becomes fully available after the U.S. market closes; if it hasn’t fully updated yet, I’ll write “pending confirmation” and won’t treat blank items as zero.
Source: Farside daily fund flow table for U.S. spot Bitcoin ETFs; Cointelegraph citing SoSoValue Q3 totals; Binance BTC/USDT live quotes. #BitcoinETFsTake$6.34BillionInQ3 #BTC
The above is only my personal market observation and does not constitute investment advice.
My stance is to acknowledge that institutional channels still matter, but in trading I only recognize new inflows and price confirmation—I won’t substitute today’s buy pressure with a cumulative figure from an entire quarter. The accurate trending topic on Binance Square right now is #BitcoinETFsTake$6.34BillionInQ3. Market reports cite SoSoValue’s numbers, saying U.S. spot Bitcoin ETFs saw net inflows of about $6.34 billion in Q3; it’s the total from July to September, not the amount到账 on a single day today, and not a comparable incremental addition that already exists in October. To verify the short-term direction, I checked Farside’s daily fund flow table: on September 29 the total net inflow was about $66.2 million, but on September 30 it flipped to a net outflow of about $148.7 million. Two data sources may differ due to update timestamps, which funds are included, and revised values—so the quarterly total should be stated with its methodology, and shouldn’t be treated as an exact real-time quote of exchange cash flow.
Mechanically, ETF subscriptions can create Bitcoin exposure demand through market-making and the creation/redemption chain involving authorized participants; redemptions may pass the effect in the opposite direction. But in the secondary market, trading volume, the rise in the fund’s NAV price, and actual net subscriptions are three different things. Quarterly inflows indicate that traditional accounts increased allocations over that period, but they don’t guarantee that marginal buying pressure continues today. A daily turn negative isn’t proof that institutions are fully withdrawing, and you also can’t infer that next quarter must be weaker from one day’s data. My key judgment is to watch whether net flows remain consistently positive (or at least stable) for several consecutive days, whether the price can re-stabilize around resistance, and whether U.S. Treasury yields and tomorrow night’s employment data change expectations for funding costs.
The market has already shown disagreement. When writing, Binance BTC/USDT is around $83,479, down about 2.15% over 24 hours, with a range of 83,186—85,563. The hot-list quarterly fund flows are historical cumulative figures, while the current price is clearly below this 24-hour session’s open at 85,311; both can be true at the same time—no contradiction. I won’t attribute the pullback entirely to the ETF outflow on September 30, and I also won’t say the quarterly funds have already disappeared. If later Farside updates show continued inflows, and BTC recovers 84,200 and can hold it, then today’s cautious judgment may be overturned. If it keeps falling below 83,180, even if the quarterly numbers look good, I will first respect the market price.
If I were trading this myself, I wouldn’t enter—I’d stay on the sidelines and keep position size at 0%. Only if within one hour the price reclaims 84,200, then pulls back to 83,900—84,200 and holds, and if on U.S. equity trading days the ETF net flow is no longer continuously negative, would I attempt a spot long with at most 1% of total funds, without leverage. First target: 85,200 (take half off). Second target: 86,200 (close the remaining position). After entering, if within one hour price falls back below 83,600 I’d take half off; set a hard stop at 83,150 and close all. If price loses 83,180 first, cancel the long plan—I won’t add just to chase a quarterly “hot list” figure. Fund daily data only becomes fully available after the U.S. market closes; if it hasn’t fully updated yet, I’ll write “pending confirmation” and won’t treat blank items as zero.
Source: Farside daily fund flow table for U.S. spot Bitcoin ETFs; Cointelegraph citing SoSoValue Q3 totals; Binance BTC/USDT live quotes. #BitcoinETFsTake$6.34BillionInQ3 #BTC
The above is only my personal market observation and does not constitute investment advice.

3
·
--
Here's what happened when the US 10-year yield last climbed toward 5 percent and almost nobody in this market treated it as a warning.
Traders kept buying every dip in $BTC because sentiment still looked fine. They had no exit plan for a world where Treasuries started paying more than the alts they were holding.
The 10-year is the global hurdle rate. When it nears 5 percent, holding non-yielding crypto becomes a choice, not a default. We watched this in 2022 and again through parts of 2023. Capital rotated into $USDT. Borrowing costs rose. Yields on $AAVE stopped looking special next to a Treasury paying close to 5 percent with no smart-contract risk. Price did not collapse in a day. It leaked. Failed rallies stacked up. Liquidity left first, then the narrative followed.
Most of the conversation is still sitting on a Fear and Greed reading of 69 and treating it like confirmation. That number lags. A sticky 5 percent yield plus a firm dollar has historically been enough to stall ETF inflows and turn the rest of the market into a slow bleed. You do not need a recession for that. You just need yields to stay elevated while everyone else stays fully risk-on.
Where do you think this goes from here if the 10-year actually prints 5?
#US10YearYieldNears5 #DollarIndexHitsHighestSinceMay2025 #BitcoinETFsTake
Here's what happened when the US 10-year yield last climbed toward 5 percent and almost nobody in this market treated it as a warning.
Traders kept buying every dip in $BTC because sentiment still looked fine. They had no exit plan for a world where Treasuries started paying more than the alts they were holding.
The 10-year is the global hurdle rate. When it nears 5 percent, holding non-yielding crypto becomes a choice, not a default. We watched this in 2022 and again through parts of 2023. Capital rotated into $USDT. Borrowing costs rose. Yields on $AAVE stopped looking special next to a Treasury paying close to 5 percent with no smart-contract risk. Price did not collapse in a day. It leaked. Failed rallies stacked up. Liquidity left first, then the narrative followed.
Most of the conversation is still sitting on a Fear and Greed reading of 69 and treating it like confirmation. That number lags. A sticky 5 percent yield plus a firm dollar has historically been enough to stall ETF inflows and turn the rest of the market into a slow bleed. You do not need a recession for that. You just need yields to stay elevated while everyone else stays fully risk-on.
Where do you think this goes from here if the 10-year actually prints 5?
#US10YearYieldNears5 #DollarIndexHitsHighestSinceMay2025 #BitcoinETFsTake
Traders kept buying every dip in $BTC because sentiment still looked fine. They had no exit plan for a world where Treasuries started paying more than the alts they were holding.
The 10-year is the global hurdle rate. When it nears 5 percent, holding non-yielding crypto becomes a choice, not a default. We watched this in 2022 and again through parts of 2023. Capital rotated into $USDT. Borrowing costs rose. Yields on $AAVE stopped looking special next to a Treasury paying close to 5 percent with no smart-contract risk. Price did not collapse in a day. It leaked. Failed rallies stacked up. Liquidity left first, then the narrative followed.
Most of the conversation is still sitting on a Fear and Greed reading of 69 and treating it like confirmation. That number lags. A sticky 5 percent yield plus a firm dollar has historically been enough to stall ETF inflows and turn the rest of the market into a slow bleed. You do not need a recession for that. You just need yields to stay elevated while everyone else stays fully risk-on.
Where do you think this goes from here if the 10-year actually prints 5?
#US10YearYieldNears5 #DollarIndexHitsHighestSinceMay2025 #BitcoinETFsTake

101
·
--
If you're still treating real-world asset tokenization like last cycle's vaporware, stop now.
Too many people got wrecked chasing random tokens that promised to put stocks and bonds on-chain, only to watch them fade while actual policy stayed stuck in committee. That kind of FOMO burns capital twice: once on the fake narrative, and again when the real catalyst finally shows up and you have no position.
Korea proposing to tokenize stocks and bonds actually feels different. This isn't a whitepaper from a team that disappeared after the last bull run. Compare it to the Bitcoin ETF saga. Years of "it'll never happen" until the US finally blinked, and now the market treats it as obvious. Korea has the capital markets depth and the tech stack to make this more than a press release, unlike some of the smaller-market experiments that never quite scaled. In a greed-heavy tape it is easy to shrug, but this is the kind of structural shift that tends to reprice entire sectors once it stops being theoretical.
It also sits right next to how $USDT already functions as the liquidity layer everyone actually uses. If Korean equities and bonds start living on-chain, the interoperability rails $QNT has been quietly building look a lot more useful. Even $AAVE could see new collateral that isn't just another volatile token pretending to be real.
Does this put Korea ahead of the US on RWAs, or is it still just another proposal that dies in committee? #KoreaProposesTokenizingStocksAndBonds #BitcoinETFsTake #TreasuryLetsStatesFileStablecoinCertificationsEarly
If you're still treating real-world asset tokenization like last cycle's vaporware, stop now.
Too many people got wrecked chasing random tokens that promised to put stocks and bonds on-chain, only to watch them fade while actual policy stayed stuck in committee. That kind of FOMO burns capital twice: once on the fake narrative, and again when the real catalyst finally shows up and you have no position.
Korea proposing to tokenize stocks and bonds actually feels different. This isn't a whitepaper from a team that disappeared after the last bull run. Compare it to the Bitcoin ETF saga. Years of "it'll never happen" until the US finally blinked, and now the market treats it as obvious. Korea has the capital markets depth and the tech stack to make this more than a press release, unlike some of the smaller-market experiments that never quite scaled. In a greed-heavy tape it is easy to shrug, but this is the kind of structural shift that tends to reprice entire sectors once it stops being theoretical.
It also sits right next to how $USDT already functions as the liquidity layer everyone actually uses. If Korean equities and bonds start living on-chain, the interoperability rails $QNT has been quietly building look a lot more useful. Even $AAVE could see new collateral that isn't just another volatile token pretending to be real.
Does this put Korea ahead of the US on RWAs, or is it still just another proposal that dies in committee? #KoreaProposesTokenizingStocksAndBonds #BitcoinETFsTake #TreasuryLetsStatesFileStablecoinCertificationsEarly
Too many people got wrecked chasing random tokens that promised to put stocks and bonds on-chain, only to watch them fade while actual policy stayed stuck in committee. That kind of FOMO burns capital twice: once on the fake narrative, and again when the real catalyst finally shows up and you have no position.
Korea proposing to tokenize stocks and bonds actually feels different. This isn't a whitepaper from a team that disappeared after the last bull run. Compare it to the Bitcoin ETF saga. Years of "it'll never happen" until the US finally blinked, and now the market treats it as obvious. Korea has the capital markets depth and the tech stack to make this more than a press release, unlike some of the smaller-market experiments that never quite scaled. In a greed-heavy tape it is easy to shrug, but this is the kind of structural shift that tends to reprice entire sectors once it stops being theoretical.
It also sits right next to how $USDT already functions as the liquidity layer everyone actually uses. If Korean equities and bonds start living on-chain, the interoperability rails $QNT has been quietly building look a lot more useful. Even $AAVE could see new collateral that isn't just another volatile token pretending to be real.
Does this put Korea ahead of the US on RWAs, or is it still just another proposal that dies in committee? #KoreaProposesTokenizingStocksAndBonds #BitcoinETFsTake #TreasuryLetsStatesFileStablecoinCertificationsEarly

243
Here's what happened when Ethereum quietly put together a 70 percent gain while most people were still debating whether any L1 besides Bitcoin even mattered.
The pain is familiar. You either sold too soon, missed the entry after months of sideways action, or now feel that itch to chase because sitting out a $ETH move like this stings more than a small loss.
This one reads like a case study in patience versus panic. The 70 percent stretch did not come from a single catalyst. Staking locked supply, L2 activity picked up, and some of the same institutions that piled into Bitcoin ETFs started treating Ethereum as the next liquid bet.
It looks closer to the 2020 grind than the 2021 mania, when everything went vertical at once. Compare that to $NEAR, which printed bigger daily candles but failed to hold the same kind of follow-through. Ethereum's move had more of a slow accumulation feel, which is why so many traders stayed on the sidelines until it was already up.
What we can take from similar past events is the checkpoint nature of a 70 percent run. In 2017 and again in 2020, these percentages often marked a pause rather than the end. With the Fear and Greed Index sitting at 69, greed is already in the room. $AAVE volumes and DeFi activity usually trail these ETH legs, so the next few weeks will tell us if this is rotation or just another relief bounce that fades when yields stay elevated.
Where do you think $ETH goes from here after stretching 70 percent like this?
#EtherGains70 #BitcoinETFsTake #US10YearYieldNears5
Here's what happened when Ethereum quietly put together a 70 percent gain while most people were still debating whether any L1 besides Bitcoin even mattered.
The pain is familiar. You either sold too soon, missed the entry after months of sideways action, or now feel that itch to chase because sitting out a $ETH move like this stings more than a small loss.
This one reads like a case study in patience versus panic. The 70 percent stretch did not come from a single catalyst. Staking locked supply, L2 activity picked up, and some of the same institutions that piled into Bitcoin ETFs started treating Ethereum as the next liquid bet.
It looks closer to the 2020 grind than the 2021 mania, when everything went vertical at once. Compare that to $NEAR , which printed bigger daily candles but failed to hold the same kind of follow-through. Ethereum's move had more of a slow accumulation feel, which is why so many traders stayed on the sidelines until it was already up.
What we can take from similar past events is the checkpoint nature of a 70 percent run. In 2017 and again in 2020, these percentages often marked a pause rather than the end. With the Fear and Greed Index sitting at 69, greed is already in the room. $AAVE volumes and DeFi activity usually trail these ETH legs, so the next few weeks will tell us if this is rotation or just another relief bounce that fades when yields stay elevated.
Where do you think $ETH goes from here after stretching 70 percent like this?
#EtherGains70 #BitcoinETFsTake #US10YearYieldNears5
The pain is familiar. You either sold too soon, missed the entry after months of sideways action, or now feel that itch to chase because sitting out a $ETH move like this stings more than a small loss.
This one reads like a case study in patience versus panic. The 70 percent stretch did not come from a single catalyst. Staking locked supply, L2 activity picked up, and some of the same institutions that piled into Bitcoin ETFs started treating Ethereum as the next liquid bet.
It looks closer to the 2020 grind than the 2021 mania, when everything went vertical at once. Compare that to $NEAR , which printed bigger daily candles but failed to hold the same kind of follow-through. Ethereum's move had more of a slow accumulation feel, which is why so many traders stayed on the sidelines until it was already up.
What we can take from similar past events is the checkpoint nature of a 70 percent run. In 2017 and again in 2020, these percentages often marked a pause rather than the end. With the Fear and Greed Index sitting at 69, greed is already in the room. $AAVE volumes and DeFi activity usually trail these ETH legs, so the next few weeks will tell us if this is rotation or just another relief bounce that fades when yields stay elevated.
Where do you think $ETH goes from here after stretching 70 percent like this?
#EtherGains70 #BitcoinETFsTake #US10YearYieldNears5
10
Picture this: the CFTC just submitted two event contract rules to the White House for review.
The real pain is never knowing when a regulator will suddenly reclassify a product you are trading, turning a solid position into losses or leaving you on the sidelines while others adapt.
This is a case study in how crypto regulation actually unfolds. Event contracts are essentially bets on real-world outcomes, and the CFTC has spent years drawing those lines after earlier clashes with prediction platforms and the more structured path it took with Bitcoin futures. Unlike those past enforcement-heavy moments, this submission looks more like an attempt to create a workable framework rather than another blanket restriction.
Traditional players spent years in court over similar products. Crypto versions moved faster but paid for it in fines and uncertainty. If these rules land, it could give DeFi protocols a clearer lane, something $AAVE has navigated before with complex products and $QNT has positioned itself around for years. $USDT would likely remain the settlement layer most people actually use.
We have seen this pattern before. Clarity after the initial noise often brings more participation, not less.
Where do you think this goes from here for on-chain event markets?
#CFTCSubmitsTwoEventContractRulesToWhiteHouse #TreasuryLetsStatesFileStablecoinCertificationsEarly #BitcoinETFsTake
Picture this: the CFTC just submitted two event contract rules to the White House for review.
The real pain is never knowing when a regulator will suddenly reclassify a product you are trading, turning a solid position into losses or leaving you on the sidelines while others adapt.
This is a case study in how crypto regulation actually unfolds. Event contracts are essentially bets on real-world outcomes, and the CFTC has spent years drawing those lines after earlier clashes with prediction platforms and the more structured path it took with Bitcoin futures. Unlike those past enforcement-heavy moments, this submission looks more like an attempt to create a workable framework rather than another blanket restriction.
Traditional players spent years in court over similar products. Crypto versions moved faster but paid for it in fines and uncertainty. If these rules land, it could give DeFi protocols a clearer lane, something $AAVE has navigated before with complex products and $QNT has positioned itself around for years. $USDT would likely remain the settlement layer most people actually use.
We have seen this pattern before. Clarity after the initial noise often brings more participation, not less.
Where do you think this goes from here for on-chain event markets?
#CFTCSubmitsTwoEventContractRulesToWhiteHouse #TreasuryLetsStatesFileStablecoinCertificationsEarly #BitcoinETFsTake
The real pain is never knowing when a regulator will suddenly reclassify a product you are trading, turning a solid position into losses or leaving you on the sidelines while others adapt.
This is a case study in how crypto regulation actually unfolds. Event contracts are essentially bets on real-world outcomes, and the CFTC has spent years drawing those lines after earlier clashes with prediction platforms and the more structured path it took with Bitcoin futures. Unlike those past enforcement-heavy moments, this submission looks more like an attempt to create a workable framework rather than another blanket restriction.
Traditional players spent years in court over similar products. Crypto versions moved faster but paid for it in fines and uncertainty. If these rules land, it could give DeFi protocols a clearer lane, something $AAVE has navigated before with complex products and $QNT has positioned itself around for years. $USDT would likely remain the settlement layer most people actually use.
We have seen this pattern before. Clarity after the initial noise often brings more participation, not less.
Where do you think this goes from here for on-chain event markets?
#CFTCSubmitsTwoEventContractRulesToWhiteHouse #TreasuryLetsStatesFileStablecoinCertificationsEarly #BitcoinETFsTake

292
If you're still treating semiconductor earnings as background noise for your crypto trades, stop now.
This is how people miss the real rotation and end up FOMO buying the top after the traditional names have already ripped. You sit through the dump or the sideways chop because you waited for crypto-native confirmation that never arrives on schedule.
Micron just beat earnings and lifted guidance on exploding AI demand for high-bandwidth memory. It has the same flavor as those NVIDIA prints that used to send the whole sector into overdrive. Last time around that kind of catalyst eventually found its way into storage narratives and $FIL caught a bid as people started connecting chips, data centers, and decentralized infrastructure. The comparison is not perfect this cycle. Competing names in compute and interoperability are already in play, $QNT is getting looks, and with greed sitting at 69 a lot of dry powder is still parked in $USDT waiting to see if the spillover actually happens.
Crypto still lags these traditional beats by a session or two, which is exactly when most of us get chopped trying to front-run a move that may already be priced.
Where do you think this actually lands in crypto from here?
#MicronBeatsEarningsLiftsGuidance #EtherGains70 #BitcoinETFsTake
If you're still treating semiconductor earnings as background noise for your crypto trades, stop now.
This is how people miss the real rotation and end up FOMO buying the top after the traditional names have already ripped. You sit through the dump or the sideways chop because you waited for crypto-native confirmation that never arrives on schedule.
Micron just beat earnings and lifted guidance on exploding AI demand for high-bandwidth memory. It has the same flavor as those NVIDIA prints that used to send the whole sector into overdrive. Last time around that kind of catalyst eventually found its way into storage narratives and $FIL caught a bid as people started connecting chips, data centers, and decentralized infrastructure. The comparison is not perfect this cycle. Competing names in compute and interoperability are already in play, $QNT is getting looks, and with greed sitting at 69 a lot of dry powder is still parked in $USDT waiting to see if the spillover actually happens.
Crypto still lags these traditional beats by a session or two, which is exactly when most of us get chopped trying to front-run a move that may already be priced.
Where do you think this actually lands in crypto from here?
#MicronBeatsEarningsLiftsGuidance #EtherGains70 #BitcoinETFsTake
This is how people miss the real rotation and end up FOMO buying the top after the traditional names have already ripped. You sit through the dump or the sideways chop because you waited for crypto-native confirmation that never arrives on schedule.
Micron just beat earnings and lifted guidance on exploding AI demand for high-bandwidth memory. It has the same flavor as those NVIDIA prints that used to send the whole sector into overdrive. Last time around that kind of catalyst eventually found its way into storage narratives and $FIL caught a bid as people started connecting chips, data centers, and decentralized infrastructure. The comparison is not perfect this cycle. Competing names in compute and interoperability are already in play, $QNT is getting looks, and with greed sitting at 69 a lot of dry powder is still parked in $USDT waiting to see if the spillover actually happens.
Crypto still lags these traditional beats by a session or two, which is exactly when most of us get chopped trying to front-run a move that may already be priced.
Where do you think this actually lands in crypto from here?
#MicronBeatsEarningsLiftsGuidance #EtherGains70 #BitcoinETFsTake

303
Log in to explore more content
Join global crypto users on Binance Square
⚡️ Get latest and useful information about crypto.
💬 Trusted by the world’s largest crypto exchange.
👍 Discover real insights from verified creators.
Email / Phone number
Trending Topics
1
#BitcoinRejectedAt$87K
19,515 views
53 Discussing
2
#FedOctoberRateHikeOddsFallTo17%
14,648 views
268 Discussing
3
#NvidiaHitsRecordHighUp2.4%
3,111 views
162 Discussing
4
#CanaryFilesAmendedS1ForPEPEETF
1,628 views
125 Discussing
5
#USRussiaUkraineTalksReportedlyIncludeLukoilOilDeal
10,306 views
204 Discussing
6
#BitcoinParesGainsAfterRallyTo$86.5K
36,434 views
139 Discussing
7
#CerebrasSinksNearly20%OnReportNvidiaToPowerOpenAI
77,579 views
791 Discussing
8
#SECProposesCryptoCustodyRules
101,258 views
988 Discussing
9
#SECApproves3xLongCryptoCommodityETPs
65,273 views
678 Discussing
10
#MASKHitsRecordMarketCapAbove$35M
4,089 views
35 Discussing