
#bitcoinetfoutflowshit1
bitcoinetfoutflowshit1
525 views
12 Discussing
Hot
Latest

·
--
Bitcoin ETFs have experienced significant outflows totaling $1.6 billion, marking a notable shift in investor sentiment. This substantial withdrawal suggests a potential cooling off or profit-taking following recent rallies. While outflows can signal short-term bearish pressure, they also present opportunities for strategic accumulation by long-term holders. The market will be closely watching if this trend continues or if institutional interest rebounds, influencing the price trajectory of $BTC.
As the market digests these figures, it's crucial to remember that ETF flows are just one piece of the complex crypto puzzle. Diversification and risk management remain paramount for navigating these dynamic periods.
This information is for educational purposes only and does not constitute investment advice.
#BitcoinETFOutflowsHit1.6B
Bitcoin ETFs have experienced significant outflows totaling $1.6 billion, marking a notable shift in investor sentiment. This substantial withdrawal suggests a potential cooling off or profit-taking following recent rallies. While outflows can signal short-term bearish pressure, they also present opportunities for strategic accumulation by long-term holders. The market will be closely watching if this trend continues or if institutional interest rebounds, influencing the price trajectory of $BTC .
As the market digests these figures, it's crucial to remember that ETF flows are just one piece of the complex crypto puzzle. Diversification and risk management remain paramount for navigating these dynamic periods.
This information is for educational purposes only and does not constitute investment advice.
#BitcoinETFOutflowsHit1.6B
As the market digests these figures, it's crucial to remember that ETF flows are just one piece of the complex crypto puzzle. Diversification and risk management remain paramount for navigating these dynamic periods.
This information is for educational purposes only and does not constitute investment advice.
#BitcoinETFOutflowsHit1.6B

69

·
--
Here's what happened when Jane Street nearly octupled its Fidelity Bitcoin ETF holdings last week while most of the market was looking the other way.
Most traders see a headline like this and pile into $BTC out of FOMO, then have no idea when to exit as the same institutions start rotating out.
Jane Street operates as a market maker, not a long-term holder. Increasing their stake in the Fidelity ETF this aggressively during extreme fear, with the index at 19, could be about capturing spreads or hedging other positions rather than a conviction bet. People are searching $USDT, $BTC and $ETH right now, looking for safety or the next move. This kind of positioning from a firm like Jane Street often precedes volatility, not a clean rally.
We have watched similar plays before. Large desks scale in quietly, the news leaks, retail follows, then the unwind happens faster than anyone prices in. Combined with falling net shorts on CME and lingering ETF outflows, the risk is that this looks bullish on the surface but becomes selling pressure if fear persists.
Anyone else seeing this as a warning rather than a green light?
#JaneStreetNearlyOctuplesFidelityBitcoinETFHoldings #BitcoinETFOutflowsHit1 #HedgeFundsCMEBitcoinNetShortsFall89
Here's what happened when Jane Street nearly octupled its Fidelity Bitcoin ETF holdings last week while most of the market was looking the other way.
Most traders see a headline like this and pile into $BTC out of FOMO, then have no idea when to exit as the same institutions start rotating out.
Jane Street operates as a market maker, not a long-term holder. Increasing their stake in the Fidelity ETF this aggressively during extreme fear, with the index at 19, could be about capturing spreads or hedging other positions rather than a conviction bet. People are searching $USDT, $BTC and $ETH right now, looking for safety or the next move. This kind of positioning from a firm like Jane Street often precedes volatility, not a clean rally.
We have watched similar plays before. Large desks scale in quietly, the news leaks, retail follows, then the unwind happens faster than anyone prices in. Combined with falling net shorts on CME and lingering ETF outflows, the risk is that this looks bullish on the surface but becomes selling pressure if fear persists.
Anyone else seeing this as a warning rather than a green light?
#JaneStreetNearlyOctuplesFidelityBitcoinETFHoldings #BitcoinETFOutflowsHit1 #HedgeFundsCMEBitcoinNetShortsFall89
Most traders see a headline like this and pile into $BTC out of FOMO, then have no idea when to exit as the same institutions start rotating out.
Jane Street operates as a market maker, not a long-term holder. Increasing their stake in the Fidelity ETF this aggressively during extreme fear, with the index at 19, could be about capturing spreads or hedging other positions rather than a conviction bet. People are searching $USDT, $BTC and $ETH right now, looking for safety or the next move. This kind of positioning from a firm like Jane Street often precedes volatility, not a clean rally.
We have watched similar plays before. Large desks scale in quietly, the news leaks, retail follows, then the unwind happens faster than anyone prices in. Combined with falling net shorts on CME and lingering ETF outflows, the risk is that this looks bullish on the surface but becomes selling pressure if fear persists.
Anyone else seeing this as a warning rather than a green light?
#JaneStreetNearlyOctuplesFidelityBitcoinETFHoldings #BitcoinETFOutflowsHit1 #HedgeFundsCMEBitcoinNetShortsFall89

57

The last time crypto and stocks shared the same liquidity driver this tightly, more people got wrecked on the way down than ever made money on the way up.
Traders keep buying $BTC and $ETH the second equities tick green, then watch both reverse when the next data print hits and perps start cascading. That FOMO-on-correlation trade is how people lose months of gains in a single session.
The real driver isn't some new narrative. It's whether USD liquidity is expanding or contracting, plus ETF flows and positioning. When that tap is on, $SOL rips with everything else.
When Fear and Greed is sitting at 19 and outflows show up, stocks can still find a floor in earnings while crypto just keeps bleeding because there's no bid underneath. Correlation looks perfect until the moment it becomes a one-way liquidation machine.
Anyone else seeing this setup as more of a warning than a buy signal, or do you think the next print actually unsticks both?
#WhatWillDriveCryptoandStocks #BitcoinETFOutflowsHit1 #HedgeFundsCMEBitcoinNetShortsFall89
The last time crypto and stocks shared the same liquidity driver this tightly, more people got wrecked on the way down than ever made money on the way up.
Traders keep buying $BTC and $ETH the second equities tick green, then watch both reverse when the next data print hits and perps start cascading. That FOMO-on-correlation trade is how people lose months of gains in a single session.
The real driver isn't some new narrative. It's whether USD liquidity is expanding or contracting, plus ETF flows and positioning. When that tap is on, $SOL rips with everything else.
When Fear and Greed is sitting at 19 and outflows show up, stocks can still find a floor in earnings while crypto just keeps bleeding because there's no bid underneath. Correlation looks perfect until the moment it becomes a one-way liquidation machine.
Anyone else seeing this setup as more of a warning than a buy signal, or do you think the next print actually unsticks both?
#WhatWillDriveCryptoandStocks #BitcoinETFOutflowsHit1 #HedgeFundsCMEBitcoinNetShortsFall89
Traders keep buying $BTC and $ETH the second equities tick green, then watch both reverse when the next data print hits and perps start cascading. That FOMO-on-correlation trade is how people lose months of gains in a single session.
The real driver isn't some new narrative. It's whether USD liquidity is expanding or contracting, plus ETF flows and positioning. When that tap is on, $SOL rips with everything else.
When Fear and Greed is sitting at 19 and outflows show up, stocks can still find a floor in earnings while crypto just keeps bleeding because there's no bid underneath. Correlation looks perfect until the moment it becomes a one-way liquidation machine.
Anyone else seeing this setup as more of a warning than a buy signal, or do you think the next print actually unsticks both?
#WhatWillDriveCryptoandStocks #BitcoinETFOutflowsHit1 #HedgeFundsCMEBitcoinNetShortsFall89
63
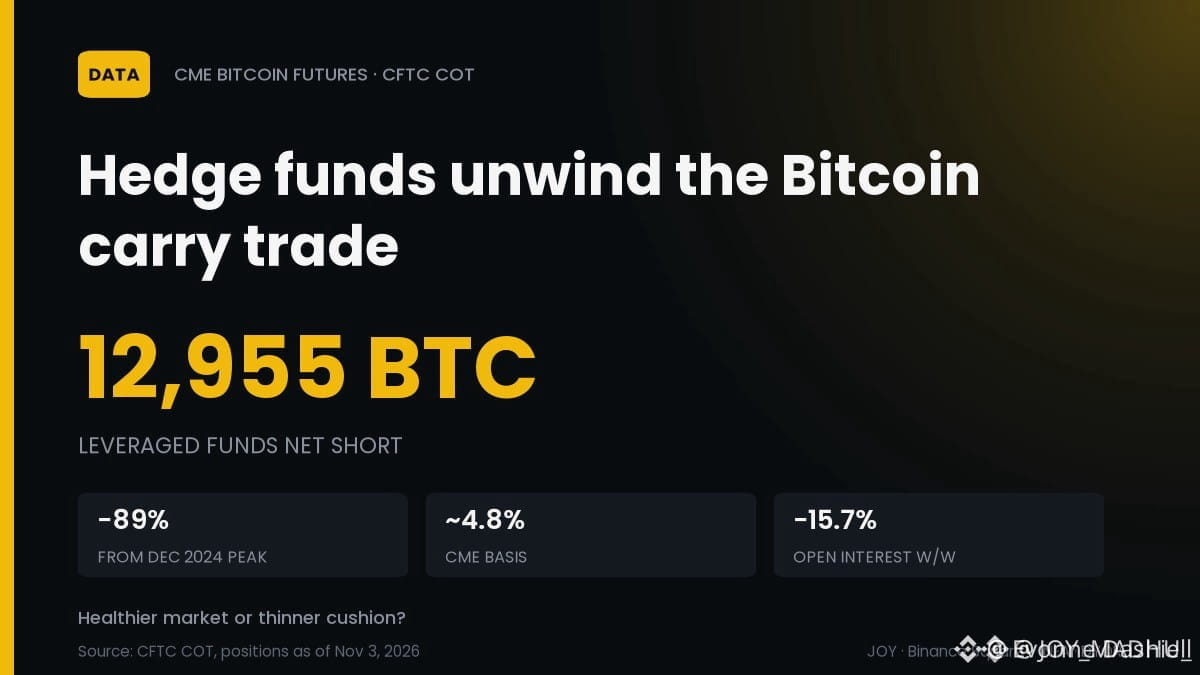
Everyone thinks hedge funds slashing their Bitcoin shorts by 89% means the smart money is turning bullish, but actually it often just means they're reducing bets in a market that's still full of uncertainty.
The pain is real when you see that headline and feel the FOMO. You buy $BTC only to watch it grind lower because you treated a positioning change as a buy signal while fear is still extreme.
Think of hedge funds covering those CME shorts like a bunch of poker players folding their hands mid-game. They are not suddenly all-in on the next hand. They might just be sitting out the volatility while Fear and Greed sits at 19. This kind of move can create a short squeeze that lifts prices temporarily, but it does not confirm a trend change. Traders pile into $ETH and $SOL expecting the same lift, forgetting that covering shorts is not the same as opening longs.
The bigger risk is assuming this clears the path for a rally when it could just be de-risking ahead of more news. Combined with what we are seeing in flows, it might leave $BTC vulnerable if retail follows the wrong signal.
What's your take on whether this covering actually changes anything?
#HedgeFundsCMEBitcoinNetShortsFall89 #WhatWillDriveCryptoandStocks #BitcoinETFOutflowsHit1
Everyone thinks hedge funds slashing their Bitcoin shorts by 89% means the smart money is turning bullish, but actually it often just means they're reducing bets in a market that's still full of uncertainty.
The pain is real when you see that headline and feel the FOMO. You buy $BTC only to watch it grind lower because you treated a positioning change as a buy signal while fear is still extreme.
Think of hedge funds covering those CME shorts like a bunch of poker players folding their hands mid-game. They are not suddenly all-in on the next hand. They might just be sitting out the volatility while Fear and Greed sits at 19. This kind of move can create a short squeeze that lifts prices temporarily, but it does not confirm a trend change. Traders pile into $ETH and $SOL expecting the same lift, forgetting that covering shorts is not the same as opening longs.
The bigger risk is assuming this clears the path for a rally when it could just be de-risking ahead of more news. Combined with what we are seeing in flows, it might leave $BTC vulnerable if retail follows the wrong signal.
What's your take on whether this covering actually changes anything?
#HedgeFundsCMEBitcoinNetShortsFall89 #WhatWillDriveCryptoandStocks #BitcoinETFOutflowsHit1
The pain is real when you see that headline and feel the FOMO. You buy $BTC only to watch it grind lower because you treated a positioning change as a buy signal while fear is still extreme.
Think of hedge funds covering those CME shorts like a bunch of poker players folding their hands mid-game. They are not suddenly all-in on the next hand. They might just be sitting out the volatility while Fear and Greed sits at 19. This kind of move can create a short squeeze that lifts prices temporarily, but it does not confirm a trend change. Traders pile into $ETH and $SOL expecting the same lift, forgetting that covering shorts is not the same as opening longs.
The bigger risk is assuming this clears the path for a rally when it could just be de-risking ahead of more news. Combined with what we are seeing in flows, it might leave $BTC vulnerable if retail follows the wrong signal.
What's your take on whether this covering actually changes anything?
#HedgeFundsCMEBitcoinNetShortsFall89 #WhatWillDriveCryptoandStocks #BitcoinETFOutflowsHit1
60

·
--
Volume is at its highest in a month—who's selling?
Yesterday morning, I wrote here that the ones hammering BTC were its own ETF buyers, not U.S. tech stocks. The condition I set was that DOGE's 24-hour trading volume would top 50 million dollars while its price continued to fall.
This morning, I checked: 38.9 million dollars. It didn't make it.
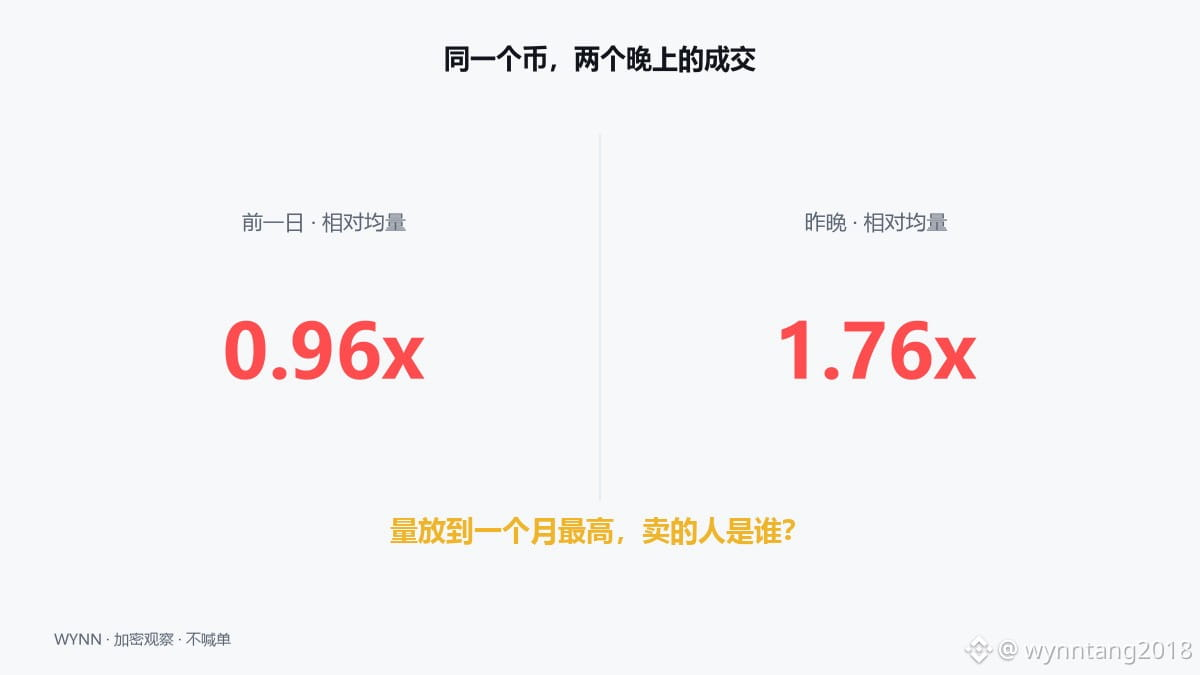
But I missed something. Using the same measure yesterday morning, BTC's 24-hour trading volume was 1105.8 million dollars, just 0.96 times its 30-day average. I said that meant buyers were pulling back, not sellers piling in. This morning, the figure was 2055 million dollars, or 1.76 times the average—the heaviest in a month.
A decline on low volume and a decline on high volume are often just the first and second stages of the same thing. First, no one steps in to buy, so the price moves lower to find buyers. Then, at some point, holders start giving up. I got the first stage right and thought that was the whole story. I've stayed on the sidelines these past few days because I couldn't tell the two stages apart.
Three names on the same screen; the only difference is volume. UNI is down 5.2%, with trading volume at 48.9 million dollars, or 1.15 times its 30-day average—the biggest drop, with volume least in line with the move. DOGE is down nearly 3%, with volume right at its average. XRP is down less than 3%, with volume at 1.27 times its average. All three are falling, and all have volume close to their averages.
For today's Asian session, I'm watching just one number: can BTC's hourly trading volume stay above 100 million dollars for two consecutive hours? If it can't, that means the holders who gave up last night have finished selling.
When you open the market screen, what do you look at first: price or trading volume?
$UNI $DOGE $XRP #BinanceSquare #Uniswap #BitcoinETFOutflowsHit1.6B
Crypto assets are high-risk. The above is my personal observation and does not constitute investment advice. Please make your own judgment (DYOR).
Volume is at its highest in a month—who's selling?
Yesterday morning, I wrote here that the ones hammering BTC were its own ETF buyers, not U.S. tech stocks. The condition I set was that DOGE's 24-hour trading volume would top 50 million dollars while its price continued to fall.
This morning, I checked: 38.9 million dollars. It didn't make it.
But I missed something. Using the same measure yesterday morning, BTC's 24-hour trading volume was 1105.8 million dollars, just 0.96 times its 30-day average. I said that meant buyers were pulling back, not sellers piling in. This morning, the figure was 2055 million dollars, or 1.76 times the average—the heaviest in a month.
A decline on low volume and a decline on high volume are often just the first and second stages of the same thing. First, no one steps in to buy, so the price moves lower to find buyers. Then, at some point, holders start giving up. I got the first stage right and thought that was the whole story. I've stayed on the sidelines these past few days because I couldn't tell the two stages apart.
Three names on the same screen; the only difference is volume. UNI is down 5.2%, with trading volume at 48.9 million dollars, or 1.15 times its 30-day average—the biggest drop, with volume least in line with the move. DOGE is down nearly 3%, with volume right at its average. XRP is down less than 3%, with volume at 1.27 times its average. All three are falling, and all have volume close to their averages.
For today's Asian session, I'm watching just one number: can BTC's hourly trading volume stay above 100 million dollars for two consecutive hours? If it can't, that means the holders who gave up last night have finished selling.
When you open the market screen, what do you look at first: price or trading volume?
$UNI $DOGE $XRP #BinanceSquare #Uniswap #BitcoinETFOutflowsHit1.6B
Crypto assets are high-risk. The above is my personal observation and does not constitute investment advice. Please make your own judgment (DYOR).
Yesterday morning, I wrote here that the ones hammering BTC were its own ETF buyers, not U.S. tech stocks. The condition I set was that DOGE's 24-hour trading volume would top 50 million dollars while its price continued to fall.
This morning, I checked: 38.9 million dollars. It didn't make it.
But I missed something. Using the same measure yesterday morning, BTC's 24-hour trading volume was 1105.8 million dollars, just 0.96 times its 30-day average. I said that meant buyers were pulling back, not sellers piling in. This morning, the figure was 2055 million dollars, or 1.76 times the average—the heaviest in a month.
A decline on low volume and a decline on high volume are often just the first and second stages of the same thing. First, no one steps in to buy, so the price moves lower to find buyers. Then, at some point, holders start giving up. I got the first stage right and thought that was the whole story. I've stayed on the sidelines these past few days because I couldn't tell the two stages apart.
Three names on the same screen; the only difference is volume. UNI is down 5.2%, with trading volume at 48.9 million dollars, or 1.15 times its 30-day average—the biggest drop, with volume least in line with the move. DOGE is down nearly 3%, with volume right at its average. XRP is down less than 3%, with volume at 1.27 times its average. All three are falling, and all have volume close to their averages.
For today's Asian session, I'm watching just one number: can BTC's hourly trading volume stay above 100 million dollars for two consecutive hours? If it can't, that means the holders who gave up last night have finished selling.
When you open the market screen, what do you look at first: price or trading volume?
$UNI $DOGE $XRP #BinanceSquare #Uniswap #BitcoinETFOutflowsHit1.6B
Crypto assets are high-risk. The above is my personal observation and does not constitute investment advice. Please make your own judgment (DYOR).
1
869

·
--
Article
After Bitcoin Falls Below $70,000: ETF Flows, Liquidations, and MSCI—Which Data Chain Must Let Up First for Bitcoin to Catch Its Breath?Early on November 13, Bitcoin fell below $70,000 for the first time in three months, touching an intraday low of $67,449. That’s about 46% below its all-time high of $126,000 on October 6. The same night, roughly $1.41 billion in positions were liquidated across the crypto market in 24 hours, 89% of them longs, forcing 173,000 traders to close their positions. This wasn’t triggered by any single headline. It was the culmination of a chain of data coming due: ETF money flowed out first, leveraged positions were liquidated next, and the MSCI decision still hangs in the balance.
1. ETF money: outflows lasted six days, but eased significantly on the sixth
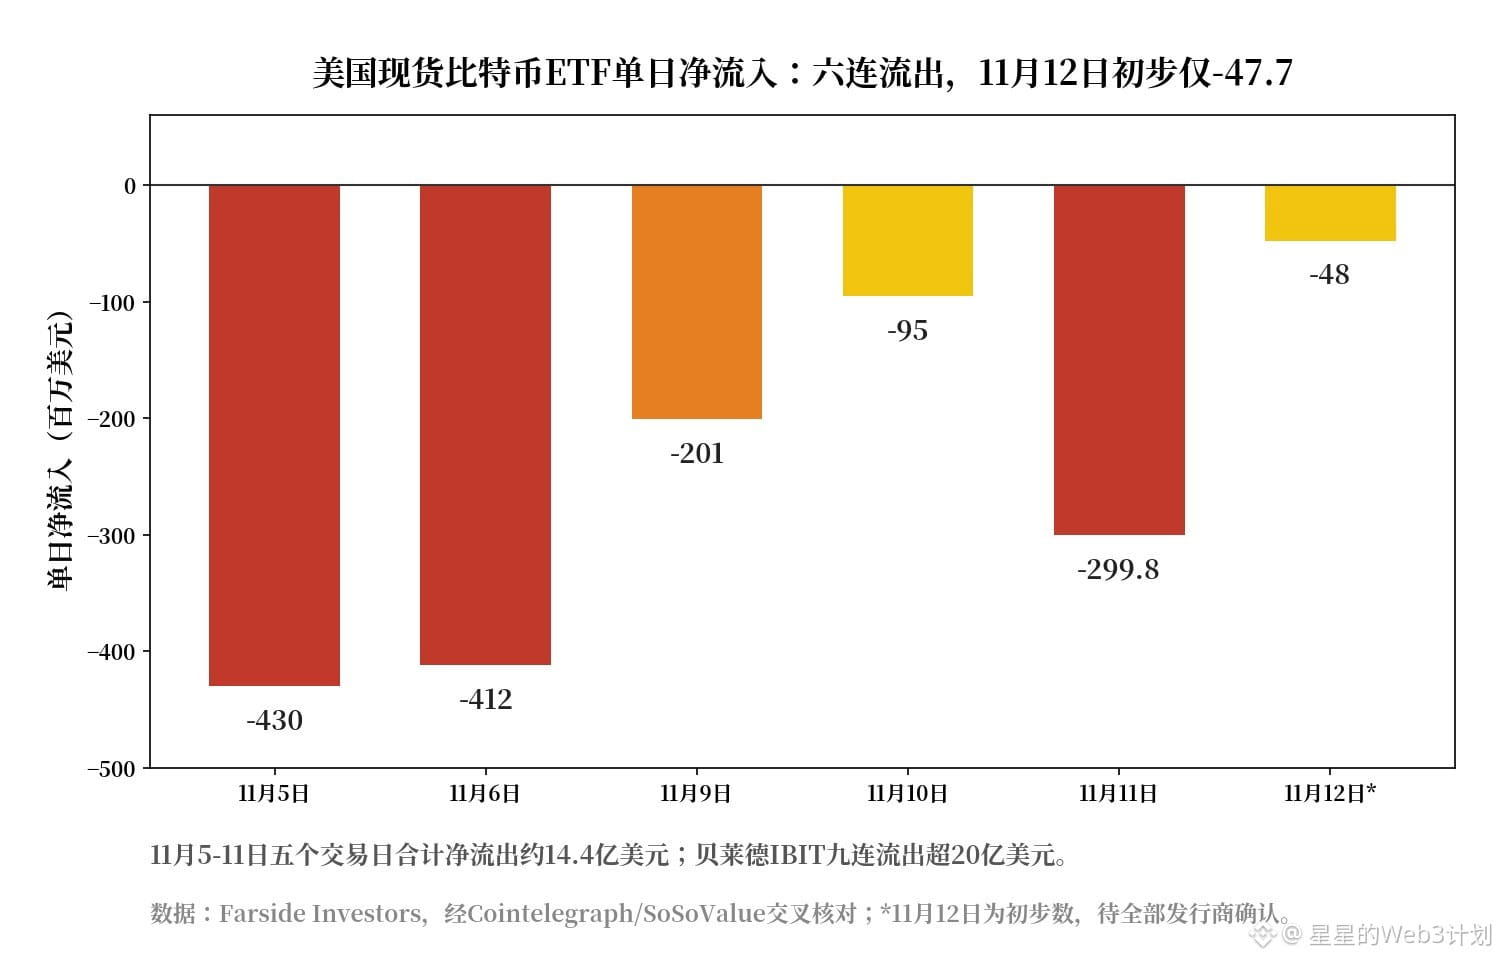
U.S. spot Bitcoin ETFs have recorded net outflows for six consecutive trading days. Across the five trading days from November 5 to 11, net outflows totaled about $1.44 billion. BlackRock’s IBIT saw outflows for nine straight days, totaling more than $2 billion. On November 11 alone, it saw $269.7 million in outflows, about 90% of the $299.8 million total market outflow that day.
After Bitcoin Falls Below $70,000: ETF Flows, Liquidations, and MSCI—Which Data Chain Must Let Up First for Bitcoin to Catch Its Breath?
Early on November 13, Bitcoin fell below $70,000 for the first time in three months, touching an intraday low of $67,449. That’s about 46% below its all-time high of $126,000 on October 6. The same night, roughly $1.41 billion in positions were liquidated across the crypto market in 24 hours, 89% of them longs, forcing 173,000 traders to close their positions. This wasn’t triggered by any single headline. It was the culmination of a chain of data coming due: ETF money flowed out first, leveraged positions were liquidated next, and the MSCI decision still hangs in the balance.
1. ETF money: outflows lasted six days, but eased significantly on the sixth
U.S. spot Bitcoin ETFs have recorded net outflows for six consecutive trading days. Across the five trading days from November 5 to 11, net outflows totaled about $1.44 billion. BlackRock’s IBIT saw outflows for nine straight days, totaling more than $2 billion. On November 11 alone, it saw $269.7 million in outflows, about 90% of the $299.8 million total market outflow that day.
1. ETF money: outflows lasted six days, but eased significantly on the sixth
U.S. spot Bitcoin ETFs have recorded net outflows for six consecutive trading days. Across the five trading days from November 5 to 11, net outflows totaled about $1.44 billion. BlackRock’s IBIT saw outflows for nine straight days, totaling more than $2 billion. On November 11 alone, it saw $269.7 million in outflows, about 90% of the $299.8 million total market outflow that day.
11
Log in to explore more content
Join global crypto users on Binance Square
⚡️ Get latest and useful information about crypto.
💬 Trusted by the world’s largest crypto exchange.
👍 Discover real insights from verified creators.
Email / Phone number
Trending Topics
1
#WhoWillSucceedJensenHuangatNvidia?
15,845 views
242 Discussing
2
#WhatWillDriveCryptoandStocks’NextRebound?
296,554 views
2,209 Discussing
3
#USPPIMissMayEaseBTCPressure
132,509 views
1,516 Discussing
4
#TONStrategyReports$23.97MQ3NetLoss
0 views
5 Discussing
5
#PolkadotCommunityApprovesNewStrategyWith97%Vote
0 views
25 Discussing
6
#dYdXPlansV9.9UpgradeToShiftUSDCToInjective
215 views
12 Discussing
7
#TradFiForBeginners
654,681 views
4,239 Discussing
8
#MANTRAPausesUnstakingFor7DaysAfterKeplrSecurityIncident
2,191 views
36 Discussing
9
#BitcoinCoreDisclosesTorTrafficVulnerability
61,928 views
892 Discussing
10
#BitcoinBreaksBelow200WeekMovingAverage
130,990 views
893 Discussing