
#bullaa
bullaa
1,975 views
18 Discussing
Hot
Latest


·
--
Bearish
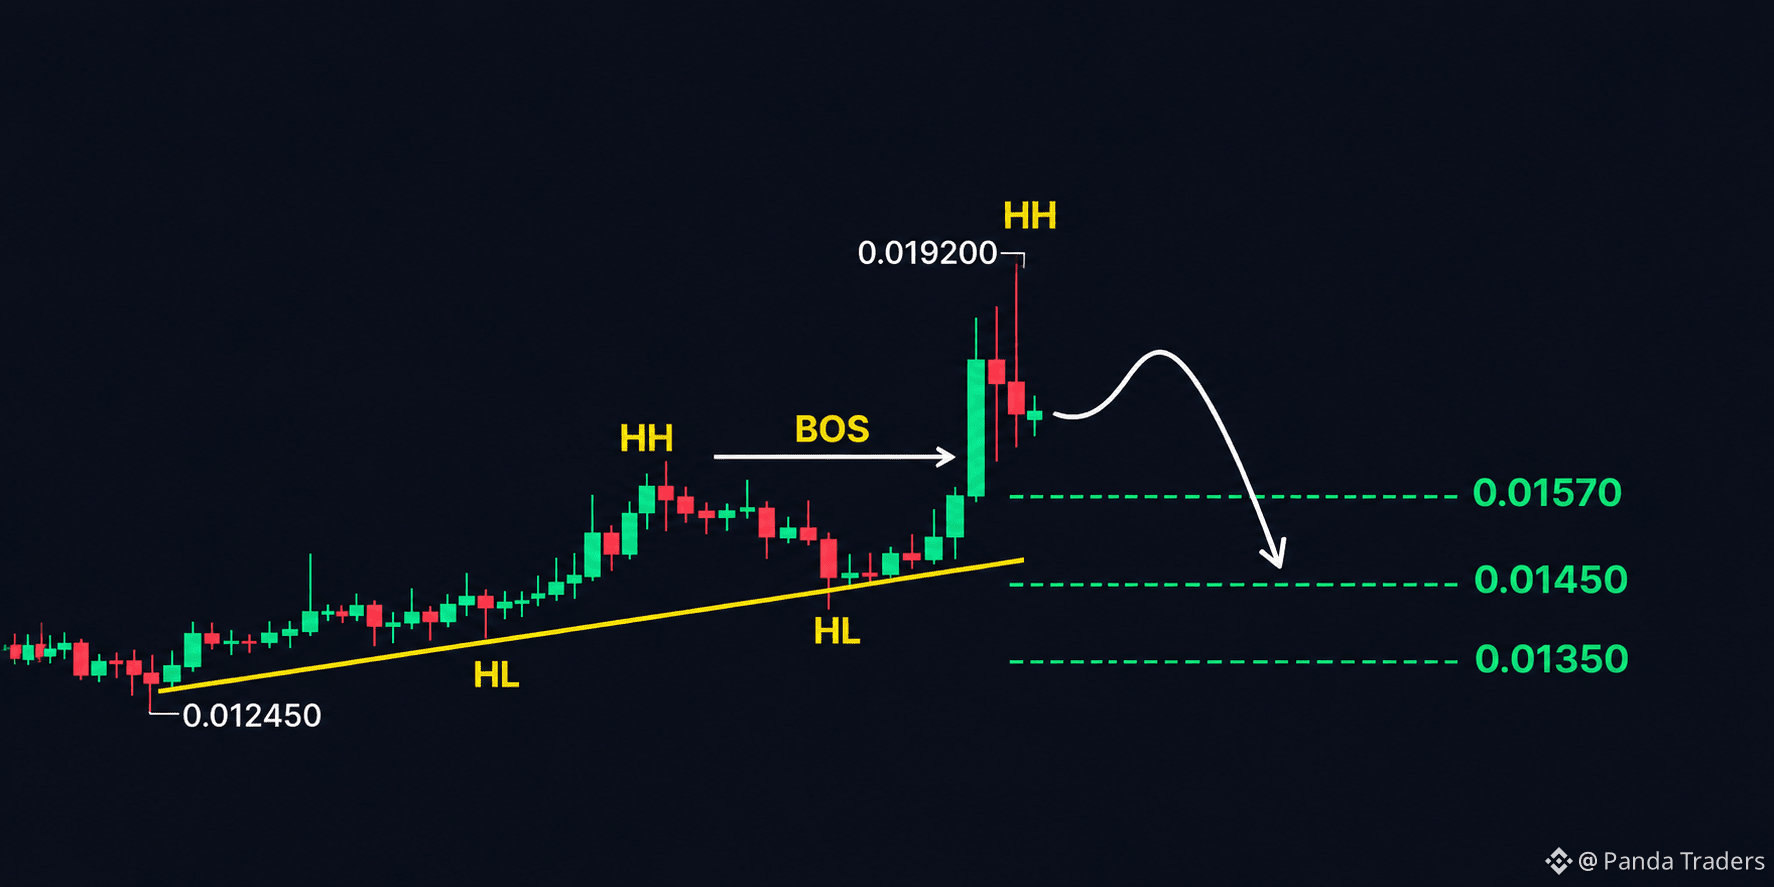
🚨 $BULLA /USDT is bearish..I'm taking short 📉
Entry: scale short Entry between current price upto 0.01800
SL: 0.02150
TP1: 0.01570
TP2: 0.01450
TP3: 0.01350
Use DCA, low leverage and proper risk management.
Always DYOR
Short now 👇
{future}(BULLAUSDT)
#BULLAA #SolanaSets2027RoadmapToDoubleComputeCapacity #BlackRockLaunchesHKDollarDigitalLiquidityFund #TwentyOneCapitalAdds172.25BTC
🚨 $BULLA /USDT is bearish..I'm taking short 📉
Entry: scale short Entry between current price upto 0.01800
SL: 0.02150
TP1: 0.01570
TP2: 0.01450
TP3: 0.01350
Use DCA, low leverage and proper risk management.
Always DYOR
Short now 👇
#BULLAA #SolanaSets2027RoadmapToDoubleComputeCapacity #BlackRockLaunchesHKDollarDigitalLiquidityFund #TwentyOneCapitalAdds172.25BTC
Entry: scale short Entry between current price upto 0.01800
SL: 0.02150
TP1: 0.01570
TP2: 0.01450
TP3: 0.01350
Use DCA, low leverage and proper risk management.
Always DYOR
Short now 👇
#BULLAA #SolanaSets2027RoadmapToDoubleComputeCapacity #BlackRockLaunchesHKDollarDigitalLiquidityFund #TwentyOneCapitalAdds172.25BTC
NancyLoner:
How sure?
2
2
1.5k

·
--
Bearish
Market Overview & Price Action
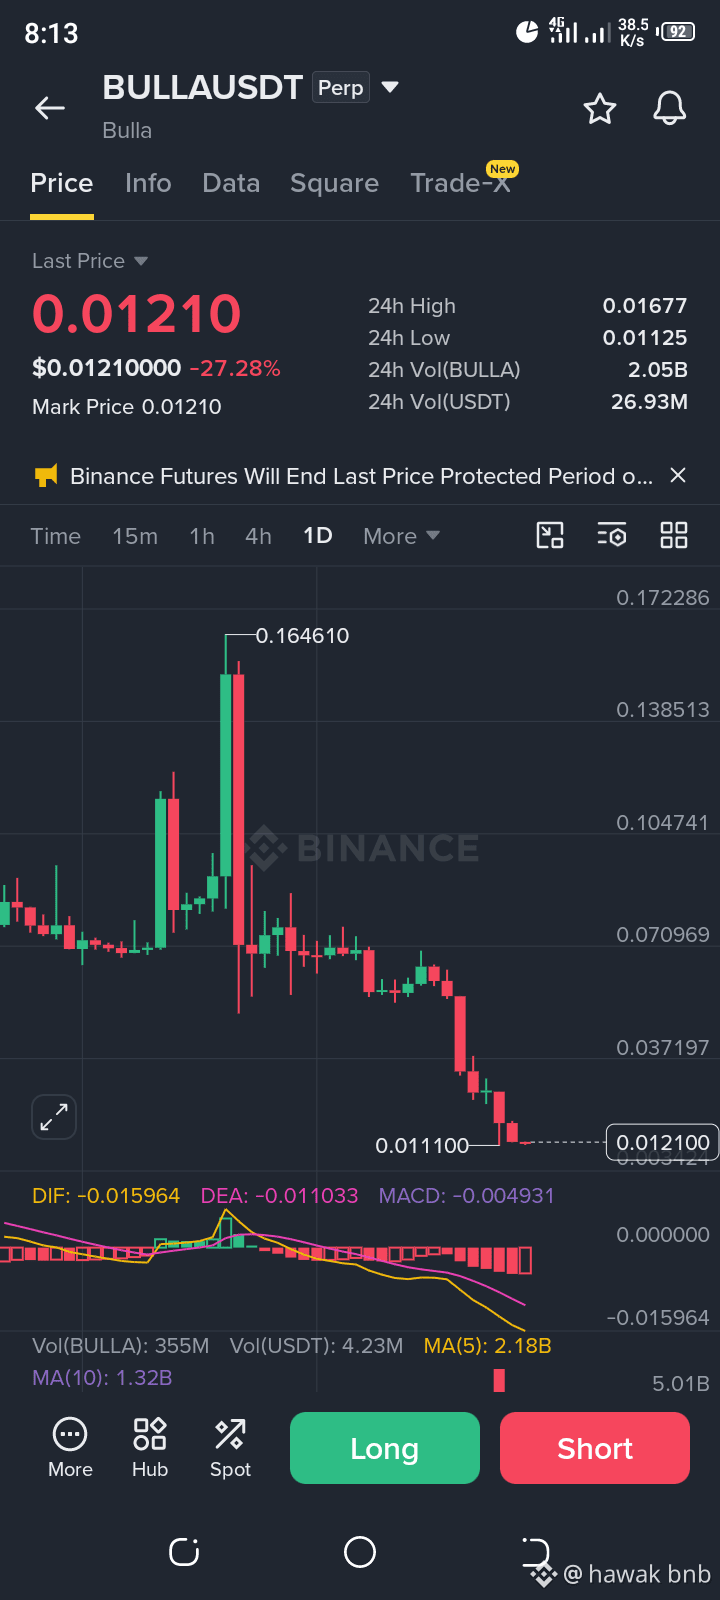
The screenshot displays a 1-day (1D) technical candlestick chart for BULLA/USDT on Binance. The current last traded price stands at $0.01210, reflecting a steep intraday decline of -27.28%. The macro structure of the chart reveals a heavy downward continuation following a sharp rejection from an earlier higher peak of $0.164610, indicating strong persistent bearish pressure.
24-Hour Range & Trading Volume
Over the past 24 hours, BULLA recorded a high of $0.01677 and a low of $0.01125 (with the chart wick dipping to a low of $0.011100). Market activity and liquidity remain active amidst the sell-off, supported by a 24-hour trading volume of 2.05B BULLA and 26.93M USDT. An announcement ticker at the top also notes ongoing exchange updates, indicating that Binance Futures will end the last price protected period for the contract. @Square-Creator-524215540 #BULLAA $BULLA
{future}(BULLAUSDT)
#CanNvidia’sDataCenterGrowthContinue? #NvidiaBoardNotConsideringHuang’sReturnasCEO #KOSPIFalls2.59%ToLowestCloseSinceFebruary #WhatInvestmentSignalsDo13FFilingsReveal?
Market Overview & Price Action
The screenshot displays a 1-day (1D) technical candlestick chart for BULLA/USDT on Binance. The current last traded price stands at $0.01210, reflecting a steep intraday decline of -27.28%. The macro structure of the chart reveals a heavy downward continuation following a sharp rejection from an earlier higher peak of $0.164610, indicating strong persistent bearish pressure.
24-Hour Range & Trading Volume
Over the past 24 hours, BULLA recorded a high of $0.01677 and a low of $0.01125 (with the chart wick dipping to a low of $0.011100). Market activity and liquidity remain active amidst the sell-off, supported by a 24-hour trading volume of 2.05B BULLA and 26.93M USDT. An announcement ticker at the top also notes ongoing exchange updates, indicating that Binance Futures will end the last price protected period for the contract. @Bulla #BULLAA $BULLA
#CanNvidia’sDataCenterGrowthContinue? #NvidiaBoardNotConsideringHuang’sReturnasCEO #KOSPIFalls2.59%ToLowestCloseSinceFebruary #WhatInvestmentSignalsDo13FFilingsReveal?
The screenshot displays a 1-day (1D) technical candlestick chart for BULLA/USDT on Binance. The current last traded price stands at $0.01210, reflecting a steep intraday decline of -27.28%. The macro structure of the chart reveals a heavy downward continuation following a sharp rejection from an earlier higher peak of $0.164610, indicating strong persistent bearish pressure.
24-Hour Range & Trading Volume
Over the past 24 hours, BULLA recorded a high of $0.01677 and a low of $0.01125 (with the chart wick dipping to a low of $0.011100). Market activity and liquidity remain active amidst the sell-off, supported by a 24-hour trading volume of 2.05B BULLA and 26.93M USDT. An announcement ticker at the top also notes ongoing exchange updates, indicating that Binance Futures will end the last price protected period for the contract. @Bulla #BULLAA $BULLA
#CanNvidia’sDataCenterGrowthContinue? #NvidiaBoardNotConsideringHuang’sReturnasCEO #KOSPIFalls2.59%ToLowestCloseSinceFebruary #WhatInvestmentSignalsDo13FFilingsReveal?
17

·
--
Bullish
🚨 $BULLA A PRICE UPDATE — BEARS STILL IN CONTROL? 📉📊
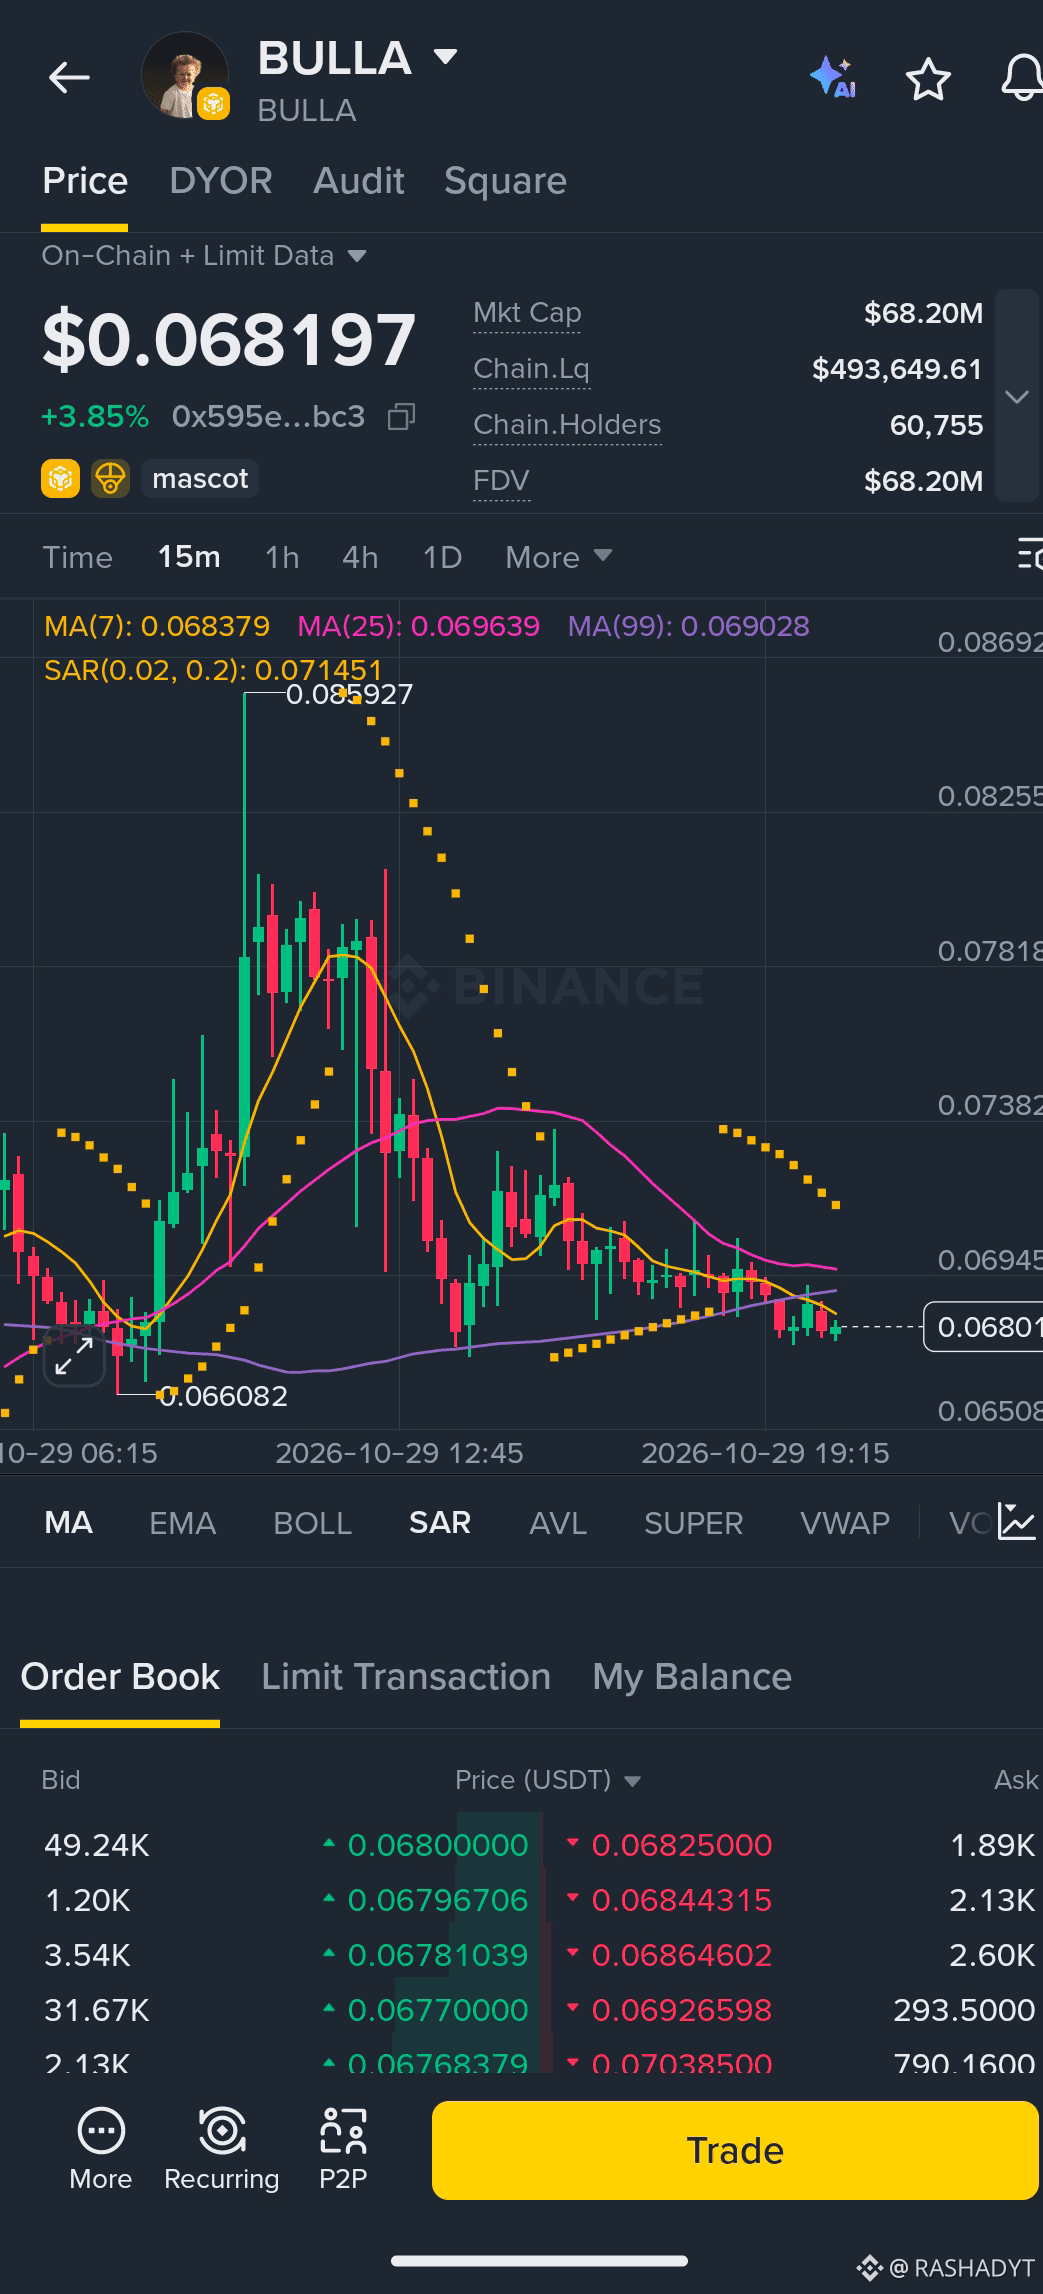
💰 Current Price: $0.068197
🟢 24H Momentum: +3.85%
💎 Market Cap: $68.20M
👥 Holders: 60,755
📊 Technical Analysis — 15M Chart
$BULLA is showing short-term weakness after being rejected from the $0.0859 high. The price is trading below MA(7), MA(25), and MA(99), while the SAR indicator remains above price, suggesting bearish pressure.
🔴 Key Support Levels
• $0.0680
• $0.0661
• $0.0651
🟢 Resistance Levels
• $0.0684
• $0.0695
• $0.0715
🚀 Bullish Scenario: A recovery above $0.0695 with stronger volume could improve short-term momentum.
⚠️ Bearish Scenario: A clear break below $0.0661 could lead to further downside.
💡 Watch price action and trading volume before confirming the next move. Always manage risk carefully.
#BULLAA
{future}(BULLAUSDT)
#CryptoAnalysis #CryptoMarket #Altcoins #Trading
🚨 $BULLA A PRICE UPDATE — BEARS STILL IN CONTROL? 📉📊
💰 Current Price: $0.068197
🟢 24H Momentum: +3.85%
💎 Market Cap: $68.20M
👥 Holders: 60,755
📊 Technical Analysis — 15M Chart
$BULLA is showing short-term weakness after being rejected from the $0.0859 high. The price is trading below MA(7), MA(25), and MA(99), while the SAR indicator remains above price, suggesting bearish pressure.
🔴 Key Support Levels
• $0.0680
• $0.0661
• $0.0651
🟢 Resistance Levels
• $0.0684
• $0.0695
• $0.0715
🚀 Bullish Scenario: A recovery above $0.0695 with stronger volume could improve short-term momentum.
⚠️ Bearish Scenario: A clear break below $0.0661 could lead to further downside.
💡 Watch price action and trading volume before confirming the next move. Always manage risk carefully.
#BULLAA
#CryptoAnalysis #CryptoMarket #Altcoins #Trading
💰 Current Price: $0.068197
🟢 24H Momentum: +3.85%
💎 Market Cap: $68.20M
👥 Holders: 60,755
📊 Technical Analysis — 15M Chart
$BULLA is showing short-term weakness after being rejected from the $0.0859 high. The price is trading below MA(7), MA(25), and MA(99), while the SAR indicator remains above price, suggesting bearish pressure.
🔴 Key Support Levels
• $0.0680
• $0.0661
• $0.0651
🟢 Resistance Levels
• $0.0684
• $0.0695
• $0.0715
🚀 Bullish Scenario: A recovery above $0.0695 with stronger volume could improve short-term momentum.
⚠️ Bearish Scenario: A clear break below $0.0661 could lead to further downside.
💡 Watch price action and trading volume before confirming the next move. Always manage risk carefully.
#BULLAA
#CryptoAnalysis #CryptoMarket #Altcoins #Trading
1
313

$BULLA non stop bullish 💹 candle by candle green line touch already 🔝 #BULLAA hit 0.025$ 🔜
{future}(BULLAUSDT)
$XRP
{future}(XRPUSDT)
$TRUMP
{future}(TRUMPUSDT)
$BULLA non stop bullish 💹 candle by candle green line touch already 🔝 #BULLAA hit 0.025$ 🔜
$XRP
$TRUMP
$XRP
$TRUMP
350

·
--
Bullish
🔥 SIGNAL | $BULLA
{future}(BULLAUSDT)
📈 LONG
📍 Entry: 0.01490 - 0.01550
🎯 TP1: 0.01620
🎯 TP2: 0.01700
🛑 SL: 0.01440
#BULLAA
⚠️ Proceed with caution · NFA
🔥 SIGNAL | $BULLA
📈 LONG
📍 Entry: 0.01490 - 0.01550
🎯 TP1: 0.01620
🎯 TP2: 0.01700
🛑 SL: 0.01440
#BULLAA
⚠️ Proceed with caution · NFA
📈 LONG
📍 Entry: 0.01490 - 0.01550
🎯 TP1: 0.01620
🎯 TP2: 0.01700
🛑 SL: 0.01440
#BULLAA
⚠️ Proceed with caution · NFA
1
630

·
--
Bullish
🔥 Two Trades
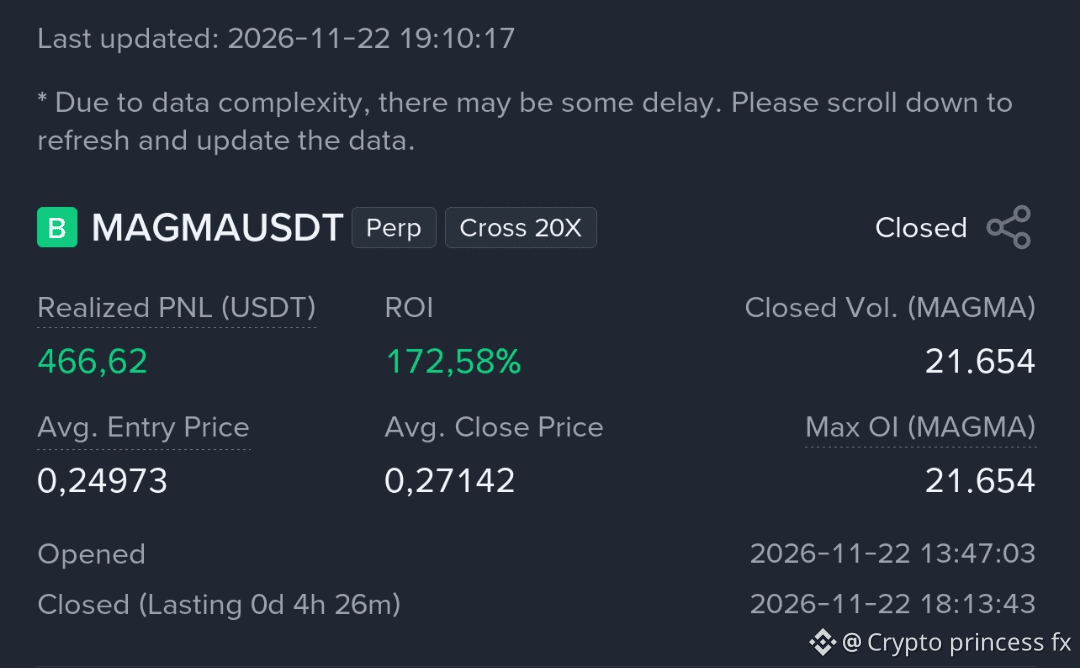
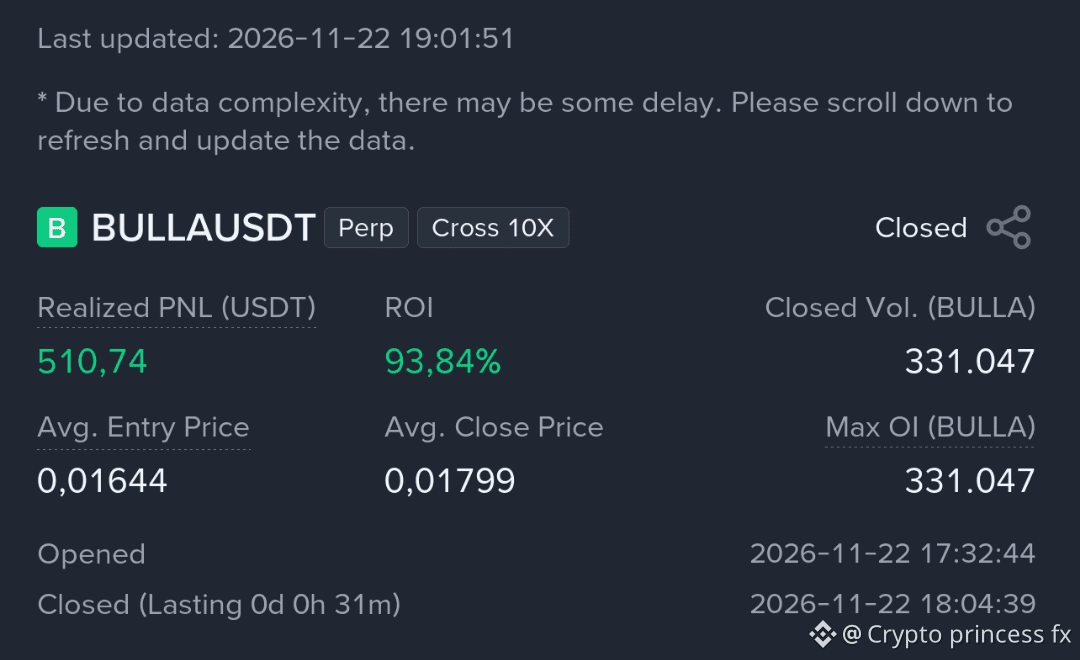
📈 MAGMAUSDT — +466.62 USDT
📈 BULLAUSDT — +510.74 USDT
💰 Combined Realized PNL: +977.36 USDT
Both positions are now closed. A good reminder that patience, market analysis, and disciplined risk management matter.
No FOMO. No guarantees. Always manage your risk.
#Crypto #TradingUpdate #MAGMA #BULLAA #BinanceSquare #DYOR
🔥 Two Trades
📈 MAGMAUSDT — +466.62 USDT
📈 BULLAUSDT — +510.74 USDT
💰 Combined Realized PNL: +977.36 USDT
Both positions are now closed. A good reminder that patience, market analysis, and disciplined risk management matter.
No FOMO. No guarantees. Always manage your risk.
#Crypto #TradingUpdate #MAGMA #BULLAA #BinanceSquare #DYOR
📈 MAGMAUSDT — +466.62 USDT
📈 BULLAUSDT — +510.74 USDT
💰 Combined Realized PNL: +977.36 USDT
Both positions are now closed. A good reminder that patience, market analysis, and disciplined risk management matter.
No FOMO. No guarantees. Always manage your risk.
#Crypto #TradingUpdate #MAGMA #BULLAA #BinanceSquare #DYOR

48



$BULLA – Long setup. Buyers are stepping in, and momentum looks ready to pick up. 🟢
$BULLA - LONG
📊 Trading plan:
🔹 Entry: $0.072930 – $0.073132
🛑 SL: $0.071718
🎯 Targets:
🎯 TP1: $0.074546
🎯 TP2: $0.075960
🎯 TP3: $0.077374
⚠️ Invalidation is clearly below $0.071718. If buyers lose ground, the setup is void.
✅ Active long setup
✅ Defined invalidation
✅ Clear bullish targets
Momentum is picking up: open a position now. Click below to trade now with $BULLA trade from here and support me
{future}(BULLAUSDT)
#BinanceUpdatesProofofReservesAddresses #BULLAA #BinanceSquareFamily
$BULLA – Long setup. Buyers are stepping in, and momentum looks ready to pick up. 🟢
$BULLA - LONG
📊 Trading plan:
🔹 Entry: $0.072930 – $0.073132
🛑 SL: $0.071718
🎯 Targets:
🎯 TP1: $0.074546
🎯 TP2: $0.075960
🎯 TP3: $0.077374
⚠️ Invalidation is clearly below $0.071718. If buyers lose ground, the setup is void.
✅ Active long setup
✅ Defined invalidation
✅ Clear bullish targets
Momentum is picking up: open a position now. Click below to trade now with $BULLA trade from here and support me
#BinanceUpdatesProofofReservesAddresses #BULLAA #BinanceSquareFamily
$BULLA - LONG
📊 Trading plan:
🔹 Entry: $0.072930 – $0.073132
🛑 SL: $0.071718
🎯 Targets:
🎯 TP1: $0.074546
🎯 TP2: $0.075960
🎯 TP3: $0.077374
⚠️ Invalidation is clearly below $0.071718. If buyers lose ground, the setup is void.
✅ Active long setup
✅ Defined invalidation
✅ Clear bullish targets
Momentum is picking up: open a position now. Click below to trade now with $BULLA trade from here and support me
#BinanceUpdatesProofofReservesAddresses #BULLAA #BinanceSquareFamily
502

·
--
Bullish
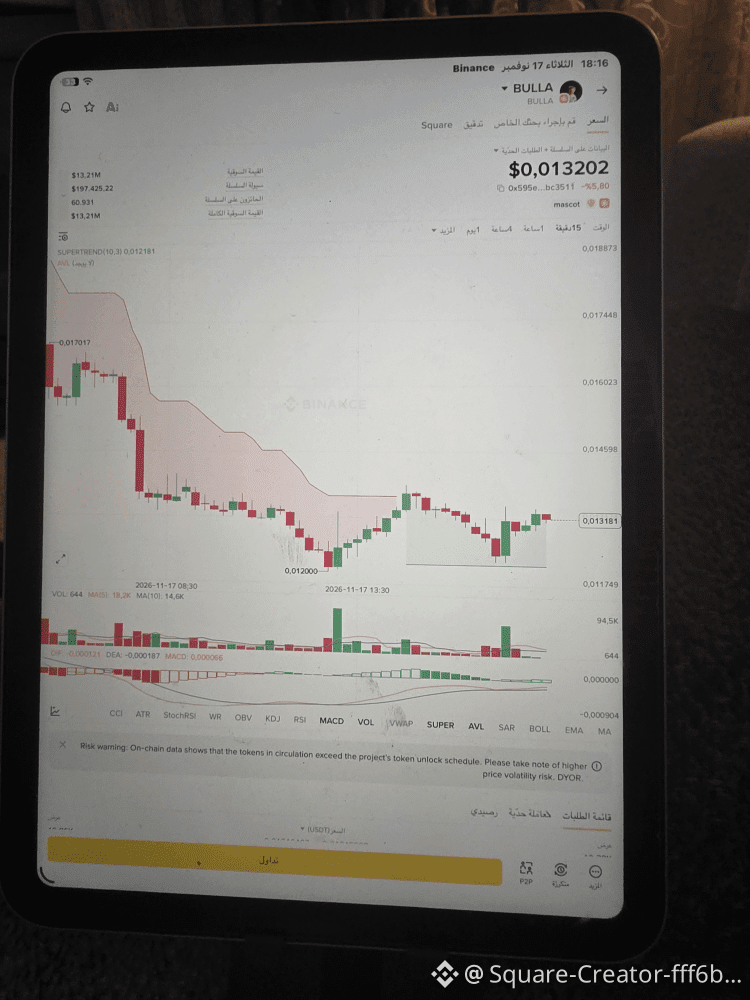
🔥The yellow indicator 🔥 is moving completely horizontally, right alongside the candles, which means that pressure and momentum are pushing very strongly within the current sideways range.
🔥It will go up🔥
But this is not financial advice. Do your own analysis, dear trader.
#BULLAA
#باينانس_فيوتشرز
#شكراً_ياBinance
🔥The yellow indicator 🔥 is moving completely horizontally, right alongside the candles, which means that pressure and momentum are pushing very strongly within the current sideways range.
🔥It will go up🔥
But this is not financial advice. Do your own analysis, dear trader.
#BULLAA
#باينانس_فيوتشرز
#شكراً_ياBinance
🔥It will go up🔥
But this is not financial advice. Do your own analysis, dear trader.
#BULLAA
#باينانس_فيوتشرز
#شكراً_ياBinance
2
1
153
·
--
Bearish
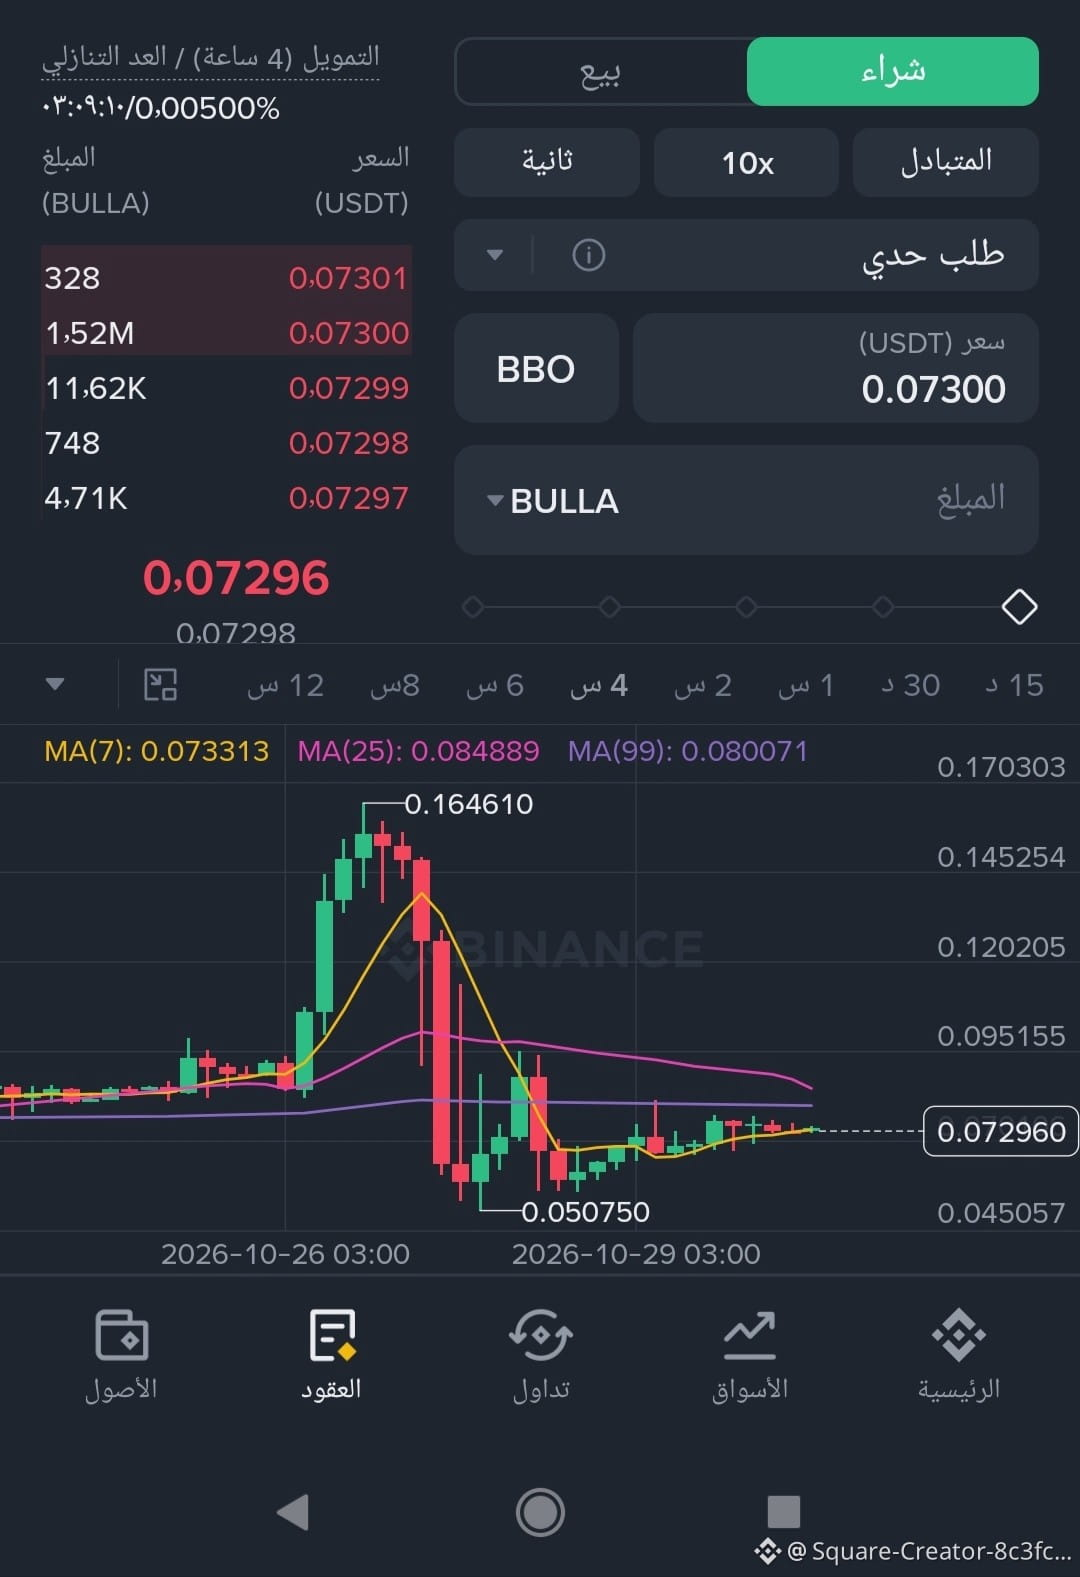
🔥🔥 Here's how you can profit starting with just 50 cents 🔥🔥
I haven't made any deposits,
I'm learning little by little,
after analyzing, applying what I've learned, and making excellent entries and exits.
#عقود_آجلة
#BULLAA
🔥🔥 Here's how you can profit starting with just 50 cents 🔥🔥
I haven't made any deposits,
I'm learning little by little,
after analyzing, applying what I've learned, and making excellent entries and exits.
#عقود_آجلة
#BULLAA
I haven't made any deposits,
I'm learning little by little,
after analyzing, applying what I've learned, and making excellent entries and exits.
#عقود_آجلة
#BULLAA
1
2
153

·
--
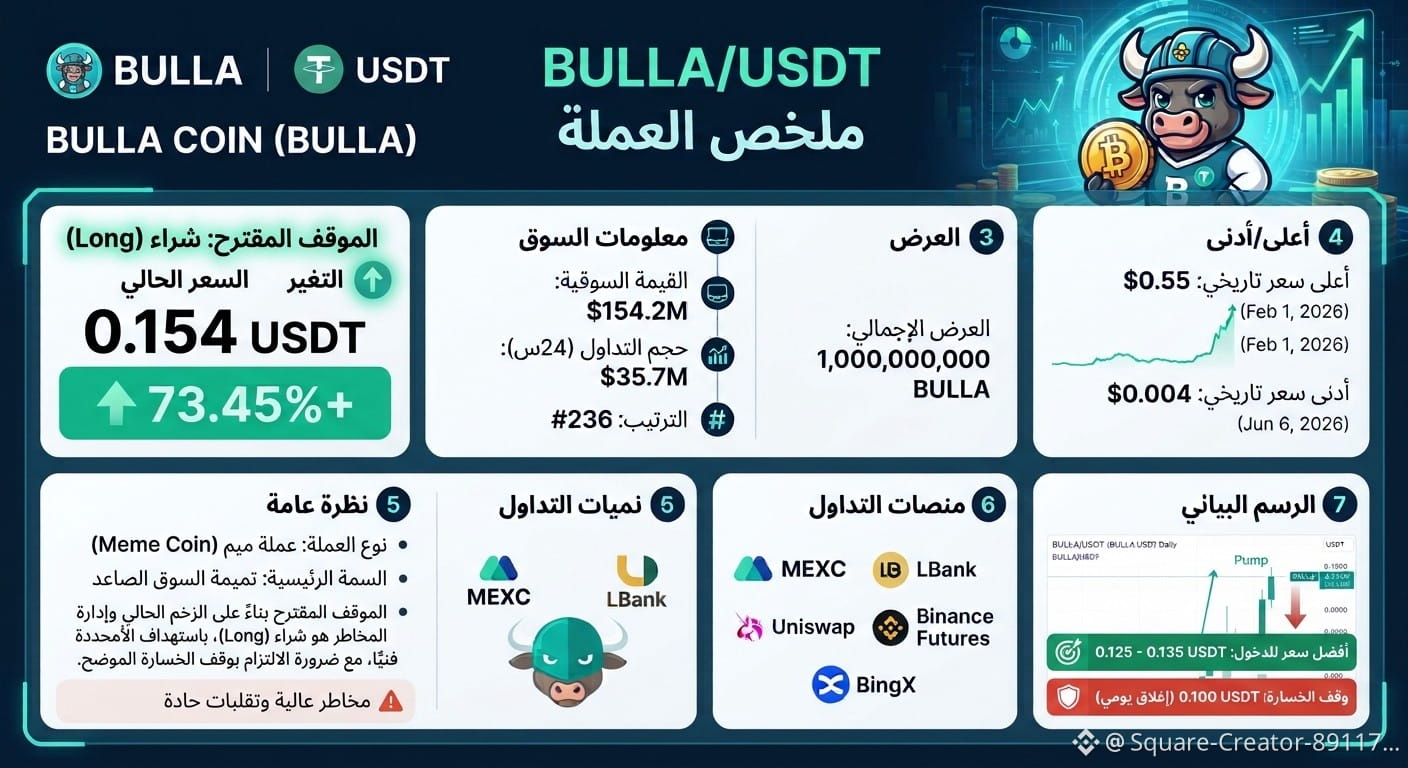
$BULLA
{future}(BULLAUSDT)
Currency #bulla
Quick analysis
#BULLAA
#StrategyMSTRSurpassesNasdaqInMarketCap #ElectrumWalletBugLetRogueServersStealFunds #ArgentineCourtDismissesLIBRACaseAgainstMilei
$BULLA
Currency #bulla
Quick analysis
#BULLAA
#StrategyMSTRSurpassesNasdaqInMarketCap #ElectrumWalletBugLetRogueServersStealFunds #ArgentineCourtDismissesLIBRACaseAgainstMilei
Currency #bulla
Quick analysis
#BULLAA
#StrategyMSTRSurpassesNasdaqInMarketCap #ElectrumWalletBugLetRogueServersStealFunds #ArgentineCourtDismissesLIBRACaseAgainstMilei
5
224
Log in to explore more content
Join global crypto users on Binance Square
⚡️ Get latest and useful information about crypto.
💬 Trusted by the world’s largest crypto exchange.
👍 Discover real insights from verified creators.
Email / Phone number
Trending Topics
1
#BTCReboundsAbove$60KAmidWhaleDipBuying
32,541 views
182 Discussing
2
#SolanaSets2027RoadmapToDoubleComputeCapacity
15,737 views
432 Discussing
3
#CaliforniaNvidiaProbeExaminesPotentialCriminalViolations
4,806 views
61 Discussing
4
#BlackRockLaunchesHKDollarDigitalLiquidityFund
12,217 views
363 Discussing
5
#NvidiaLoses$2.7TrillionInMonthAndAHalf
59,460 views
263 Discussing
6
#GlobalStocksFaceLongestLosingStreakSince2023
485,945 views
3,092 Discussing
7
#BlackRockIBITPostsRecord$541MSingleDayOutflow
77,512 views
159 Discussing
8
#AnthropicPlungesTowardIPOPriceonDay2
263,483 views
2,048 Discussing
9
#TwentyOneCapitalAdds172.25BTC
132,627 views
1,388 Discussing
10
#HKBillWouldExcludeTokenizedDepositsFromVirtualAssets
16,281 views
95 Discussing