

#btcfallsbelow
btcfallsbelow
472 views
23 Discussing
Hot
Latest

·
--
Bitcoin has fallen below the crucial $83,000 level, a move that has captured the attention of the crypto community. This price action signals a potential shift in market sentiment and warrants close observation.
Such a drop below a significant psychological and technical support level can often lead to increased volatility as traders react to the changing landscape. It could indicate that recent buying pressure has waned, or that sellers are becoming more aggressive. The market will now be looking to see if this level can be reclaimed or if further downside is expected. Monitoring on-chain data and broader market trends will be key to understanding the implications of this price movement for $BTC and the wider cryptocurrency market.
Disclaimer: This is not financial advice. Please do your own research.
#BTCFallsBelow$83000
Bitcoin has fallen below the crucial $83,000 level, a move that has captured the attention of the crypto community. This price action signals a potential shift in market sentiment and warrants close observation.
Such a drop below a significant psychological and technical support level can often lead to increased volatility as traders react to the changing landscape. It could indicate that recent buying pressure has waned, or that sellers are becoming more aggressive. The market will now be looking to see if this level can be reclaimed or if further downside is expected. Monitoring on-chain data and broader market trends will be key to understanding the implications of this price movement for $BTC and the wider cryptocurrency market.
Disclaimer: This is not financial advice. Please do your own research.
#BTCFallsBelow$83000
Such a drop below a significant psychological and technical support level can often lead to increased volatility as traders react to the changing landscape. It could indicate that recent buying pressure has waned, or that sellers are becoming more aggressive. The market will now be looking to see if this level can be reclaimed or if further downside is expected. Monitoring on-chain data and broader market trends will be key to understanding the implications of this price movement for $BTC and the wider cryptocurrency market.
Disclaimer: This is not financial advice. Please do your own research.
#BTCFallsBelow$83000
107

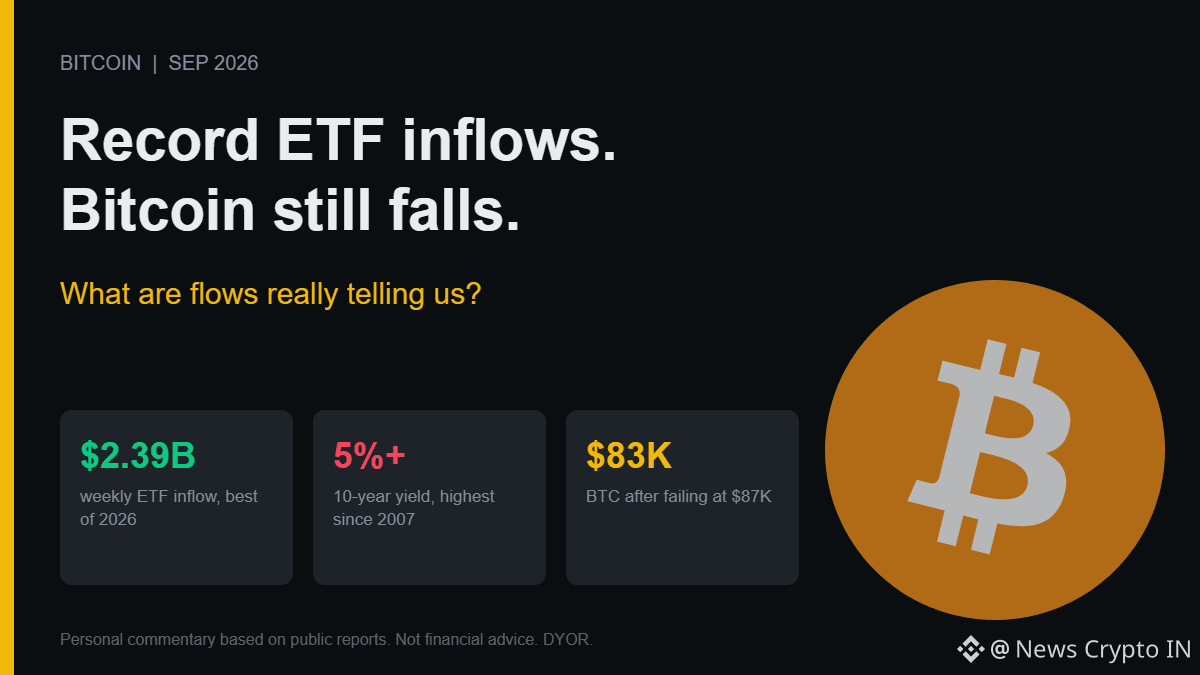
Bitcoin slipped to about $83K after failing to hold $87K, in the same week spot ETFs took in $2.39B, the best week of 2026. Record inflow, red candle. That's the paradox everyone is asking about.
Here's what the "ETF demand" story leaves out. The 10-year Treasury yield has pushed past 5%, a level last seen in 2007. Brent is near $106 after Trump rejected Iran's latest proposal on reopening the Strait of Hormuz. The dollar is stronger. None of those care how many ETF shares were created.
The read that explains both: ETF buyers are real, but they're absorbing supply from holders selling into the $84K-$87K zone. Fresh capital meets sellers, so price goes sideways to down instead of up. That isn't "no demand." It's demand equal to supply at that price.
Why it matters: ETF flow headlines are treated like a price signal. Flows tell you who is buying, not whether the buyer is winning. With a Treasury yield above 5%, every dollar into $BTC is a dollar giving up a safe yield, and the bar for holding it keeps rising.
One more gap to watch: Fear & Greed still reads 68 (Greed) while price is falling. Sentiment hasn't caught up with the tape.
If record flows can't lift price with yields above 5%, what can?
#BTCFallsBelow$83000 #BitcoinSpotETFs$2.39BWeeklyNetInflow
Bitcoin slipped to about $83K after failing to hold $87K, in the same week spot ETFs took in $2.39B, the best week of 2026. Record inflow, red candle. That's the paradox everyone is asking about.
Here's what the "ETF demand" story leaves out. The 10-year Treasury yield has pushed past 5%, a level last seen in 2007. Brent is near $106 after Trump rejected Iran's latest proposal on reopening the Strait of Hormuz. The dollar is stronger. None of those care how many ETF shares were created.
The read that explains both: ETF buyers are real, but they're absorbing supply from holders selling into the $84K-$87K zone. Fresh capital meets sellers, so price goes sideways to down instead of up. That isn't "no demand." It's demand equal to supply at that price.
Why it matters: ETF flow headlines are treated like a price signal. Flows tell you who is buying, not whether the buyer is winning. With a Treasury yield above 5%, every dollar into $BTC is a dollar giving up a safe yield, and the bar for holding it keeps rising.
One more gap to watch: Fear & Greed still reads 68 (Greed) while price is falling. Sentiment hasn't caught up with the tape.
If record flows can't lift price with yields above 5%, what can?
#BTCFallsBelow$83000 #BitcoinSpotETFs$2.39BWeeklyNetInflow
Here's what the "ETF demand" story leaves out. The 10-year Treasury yield has pushed past 5%, a level last seen in 2007. Brent is near $106 after Trump rejected Iran's latest proposal on reopening the Strait of Hormuz. The dollar is stronger. None of those care how many ETF shares were created.
The read that explains both: ETF buyers are real, but they're absorbing supply from holders selling into the $84K-$87K zone. Fresh capital meets sellers, so price goes sideways to down instead of up. That isn't "no demand." It's demand equal to supply at that price.
Why it matters: ETF flow headlines are treated like a price signal. Flows tell you who is buying, not whether the buyer is winning. With a Treasury yield above 5%, every dollar into $BTC is a dollar giving up a safe yield, and the bar for holding it keeps rising.
One more gap to watch: Fear & Greed still reads 68 (Greed) while price is falling. Sentiment hasn't caught up with the tape.
If record flows can't lift price with yields above 5%, what can?
#BTCFallsBelow$83000 #BitcoinSpotETFs$2.39BWeeklyNetInflow
BTC-1.27%
AGGETF-0.58%
1
51

·
--
Bearish
#BTCFallsBelow $83000
Bitcoin has slipped below $83,000, with BTC around $82,985 in recent market data, down roughly 1.7% over 24 hours.
📉 #BTCFallsBelow $83000 — Discussion
Key level: $83K is an important near-term area. A sustained break below it could keep short-term pressure elevated.
Macro pressure: Higher oil prices, Treasury yields and a stronger U.S. dollar have recently weighed on Bitcoin and other risk assets.
Recent rejection: BTC had moved above $87K before falling back, indicating that sellers remain active around higher levels.
Next levels to watch: Market commentary is focusing on roughly $81K–$82K if the $83K area fails to hold, while a recovery back above approximately $84K would change the immediate price structure.
Short discussion:
“BTC breaking below $83K puts the market at an important support test. Rising yields, a stronger dollar and recent profit-taking are adding pressure. The key question now is whether BTC can reclaim $83K or continue toward the next support zone.”
$BTC
{future}(BTCUSDT)
#BTCFallsBelow $83000
Bitcoin has slipped below $83,000, with BTC around $82,985 in recent market data, down roughly 1.7% over 24 hours.
📉 #BTCFallsBelow $83000 — Discussion
Key level: $83K is an important near-term area. A sustained break below it could keep short-term pressure elevated.
Macro pressure: Higher oil prices, Treasury yields and a stronger U.S. dollar have recently weighed on Bitcoin and other risk assets.
Recent rejection: BTC had moved above $87K before falling back, indicating that sellers remain active around higher levels.
Next levels to watch: Market commentary is focusing on roughly $81K–$82K if the $83K area fails to hold, while a recovery back above approximately $84K would change the immediate price structure.
Short discussion:
“BTC breaking below $83K puts the market at an important support test. Rising yields, a stronger dollar and recent profit-taking are adding pressure. The key question now is whether BTC can reclaim $83K or continue toward the next support zone.”
$BTC
Bitcoin has slipped below $83,000, with BTC around $82,985 in recent market data, down roughly 1.7% over 24 hours.
📉 #BTCFallsBelow $83000 — Discussion
Key level: $83K is an important near-term area. A sustained break below it could keep short-term pressure elevated.
Macro pressure: Higher oil prices, Treasury yields and a stronger U.S. dollar have recently weighed on Bitcoin and other risk assets.
Recent rejection: BTC had moved above $87K before falling back, indicating that sellers remain active around higher levels.
Next levels to watch: Market commentary is focusing on roughly $81K–$82K if the $83K area fails to hold, while a recovery back above approximately $84K would change the immediate price structure.
Short discussion:
“BTC breaking below $83K puts the market at an important support test. Rising yields, a stronger dollar and recent profit-taking are adding pressure. The key question now is whether BTC can reclaim $83K or continue toward the next support zone.”
$BTC
55

·
--
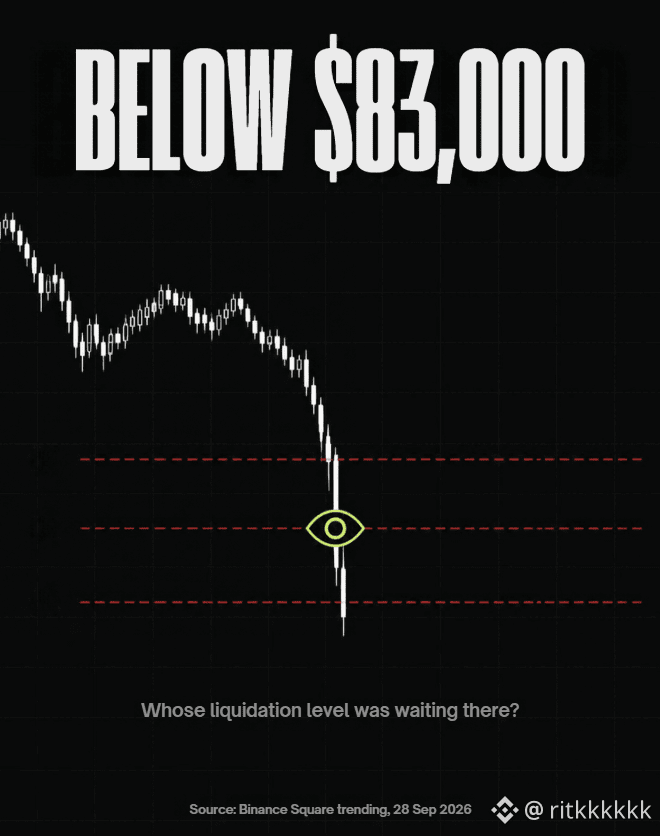
BTC just slipped below $83,000.
Days like this are when leverage gets tested. On transparent venues, it's not only your PnL on the line. Your liquidation level can be sitting there for anyone to see.
When price drops into a zone full of visible liquidation levels, is the market reacting to news, or to the levels themselves?
How are you handling leverage today?
#BTCFallsBelow #Liquidation
BTC just slipped below $83,000.
Days like this are when leverage gets tested. On transparent venues, it's not only your PnL on the line. Your liquidation level can be sitting there for anyone to see.
When price drops into a zone full of visible liquidation levels, is the market reacting to news, or to the levels themselves?
How are you handling leverage today?
#BTCFallsBelow #Liquidation
Days like this are when leverage gets tested. On transparent venues, it's not only your PnL on the line. Your liquidation level can be sitting there for anyone to see.
When price drops into a zone full of visible liquidation levels, is the market reacting to news, or to the levels themselves?
How are you handling leverage today?
#BTCFallsBelow #Liquidation
72

·
--
🚨 BITCOIN BACK BELOW $84K — HERE’S WHAT MATTERS
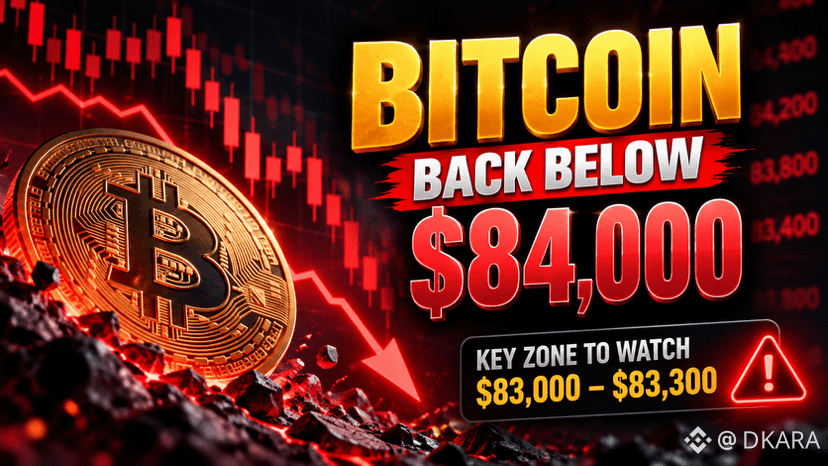
$BTC has slipped back below $84,000, putting the $83K area back in focus.
The bigger picture:
• BTC failed to hold above the $85K area
• Treasury yields remain elevated
• ETF inflows have cooled
• The U.S. dollar remains a headwind for risk assets
Key zone to watch: $83,000–$83,300.
Holding this area could put $85K back in play. A clean loss of support would shift attention toward the $82.6K area.
This is a key decision zone for Bitcoin — volatility could increase quickly.
Are you buying the dip or waiting for confirmation?
$BTC #bitcoin #btc83 #crypto #CryptoMarket #BTCFallsBelow
🚨 BITCOIN BACK BELOW $84K — HERE’S WHAT MATTERS
$BTC has slipped back below $84,000, putting the $83K area back in focus.
The bigger picture:
• BTC failed to hold above the $85K area
• Treasury yields remain elevated
• ETF inflows have cooled
• The U.S. dollar remains a headwind for risk assets
Key zone to watch: $83,000–$83,300.
Holding this area could put $85K back in play. A clean loss of support would shift attention toward the $82.6K area.
This is a key decision zone for Bitcoin — volatility could increase quickly.
Are you buying the dip or waiting for confirmation?
$BTC #bitcoin #btc83 #crypto #CryptoMarket #BTCFallsBelow
$BTC has slipped back below $84,000, putting the $83K area back in focus.
The bigger picture:
• BTC failed to hold above the $85K area
• Treasury yields remain elevated
• ETF inflows have cooled
• The U.S. dollar remains a headwind for risk assets
Key zone to watch: $83,000–$83,300.
Holding this area could put $85K back in play. A clean loss of support would shift attention toward the $82.6K area.
This is a key decision zone for Bitcoin — volatility could increase quickly.
Are you buying the dip or waiting for confirmation?
$BTC #bitcoin #btc83 #crypto #CryptoMarket #BTCFallsBelow
90

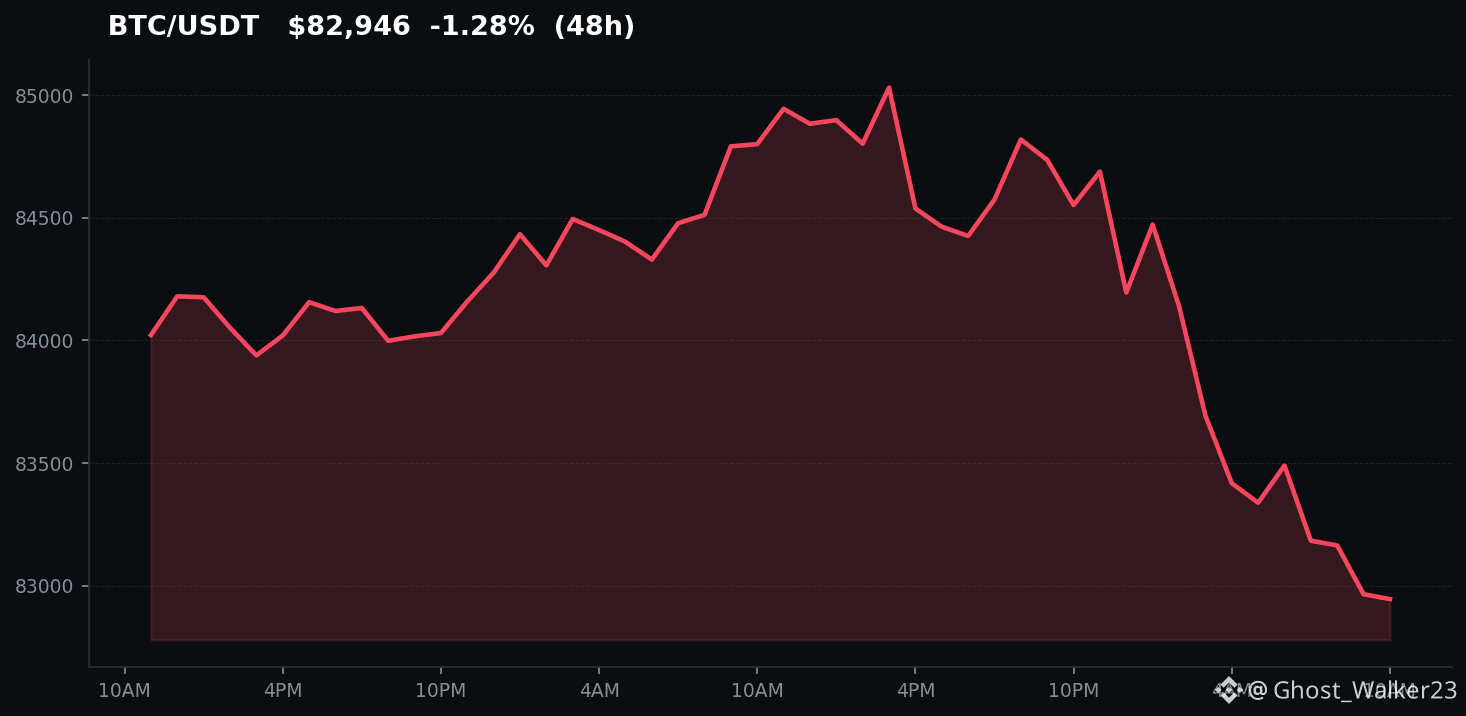
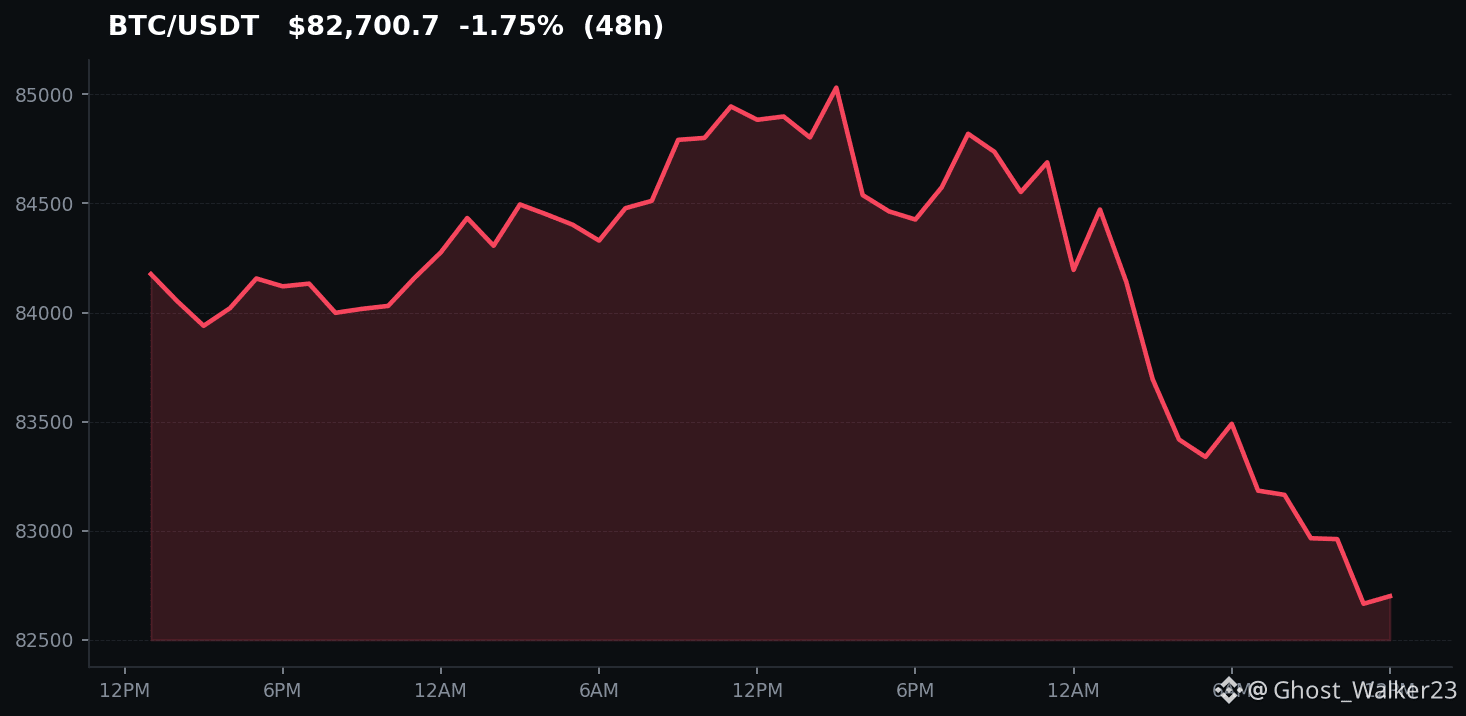
🚨 In the last 24 hours, we've seen $BTC fall below $83,000, currently at $82,953.74 (-2.13%). This decline aligns with broader market trends affecting major coins like $ETH and BNB.
As you can see below, the volatility can create both risks and opportunities. ¿Estás listo para aprovechar las caídas? #BTCFallsBelow$83000 #CryptoTrading
🚀 Like + Follow si quieres más contenido como este!
🚨 In the last 24 hours, we've seen $BTC fall below $83,000, currently at $82,953.74 (-2.13%). This decline aligns with broader market trends affecting major coins like $ETH and BNB.
As you can see below, the volatility can create both risks and opportunities. ¿Estás listo para aprovechar las caídas? #BTCFallsBelow$83000 #CryptoTrading
🚀 Like + Follow si quieres más contenido como este!
As you can see below, the volatility can create both risks and opportunities. ¿Estás listo para aprovechar las caídas? #BTCFallsBelow$83000 #CryptoTrading
🚀 Like + Follow si quieres más contenido como este!
12

·
--
Bearish
#BTCFallsBelow — TODAY’S BTC WATCH 🚨
Bitcoin has slipped back below $84K, trading around $83.4K, after recently trading above $85K. Today’s move is being linked to profit-taking, weaker ETF-flow momentum and broader macro/geopolitical uncertainty
📊 Key levels for today
🔴 $83.3K–$83.5K: immediate support zone
⚠️ Below $83.3K: $81.1K–$81.6K becomes the next area to watch
🟢 $84.0K–$84.1K: first recovery zone
🚀 Above $85K: momentum could strengthen again
The key question is whether $BTC can hold the $83.3K–$83.5K area or whether sellers push price toward the next support zone. �
Moneycontrol
My plan for today: I would watch the candle close rather than chase the first move. A reclaim of $84K would improve the short-term structure; a decisive breakdown below $83.3K would increase pullback risk.
What are you watching? 👇
🟢 Reclaim $84K
🟡 Range around $83K–$84K
🔴 Break below $83K
$BTC #BTCUSDT #BitcoinTrading #CryptoMarket #BTCAnalysis
#BTCFallsBelow — TODAY’S BTC WATCH 🚨
Bitcoin has slipped back below $84K, trading around $83.4K, after recently trading above $85K. Today’s move is being linked to profit-taking, weaker ETF-flow momentum and broader macro/geopolitical uncertainty
📊 Key levels for today
🔴 $83.3K–$83.5K: immediate support zone
⚠️ Below $83.3K: $81.1K–$81.6K becomes the next area to watch
🟢 $84.0K–$84.1K: first recovery zone
🚀 Above $85K: momentum could strengthen again
The key question is whether $BTC can hold the $83.3K–$83.5K area or whether sellers push price toward the next support zone. �
Moneycontrol
My plan for today: I would watch the candle close rather than chase the first move. A reclaim of $84K would improve the short-term structure; a decisive breakdown below $83.3K would increase pullback risk.
What are you watching? 👇
🟢 Reclaim $84K
🟡 Range around $83K–$84K
🔴 Break below $83K
$BTC #BTCUSDT #BitcoinTrading #CryptoMarket #BTCAnalysis
Bitcoin has slipped back below $84K, trading around $83.4K, after recently trading above $85K. Today’s move is being linked to profit-taking, weaker ETF-flow momentum and broader macro/geopolitical uncertainty
📊 Key levels for today
🔴 $83.3K–$83.5K: immediate support zone
⚠️ Below $83.3K: $81.1K–$81.6K becomes the next area to watch
🟢 $84.0K–$84.1K: first recovery zone
🚀 Above $85K: momentum could strengthen again
The key question is whether $BTC can hold the $83.3K–$83.5K area or whether sellers push price toward the next support zone. �
Moneycontrol
My plan for today: I would watch the candle close rather than chase the first move. A reclaim of $84K would improve the short-term structure; a decisive breakdown below $83.3K would increase pullback risk.
What are you watching? 👇
🟢 Reclaim $84K
🟡 Range around $83K–$84K
🔴 Break below $83K
$BTC #BTCUSDT #BitcoinTrading #CryptoMarket #BTCAnalysis
52
·
--
#BTCFallsBelow BTC BUY OR SELL WATCH 🚨
Bitcoin is trading around the $83K–$84K zone, making today’s price action important for short-term traders.
🟢 BUY above $85K
🔴 SELL below $83.1K
🟡 Wait for confirmation
📈 BUY setup:
If $BTC reclaims $84.4K–$85K and holds above the zone with strong volume, bullish momentum could strengthen.
📉 SELL/SHORT setup:
If BTC decisively breaks below $83.1K and confirms the breakdown on the 4H candle, traders may watch $82K–$81.2K as the next downside area.
⚠️ Between $83.1K–$84.4K: price may remain choppy, so confirmation is more important than chasing the move.
🎯 Key levels:
Support: $83.1K → $82K → $81.2K
Resistance: $84.4K → $85K
My focus today: wait for confirmation before taking a direction.
What are you watching? 👇
🟢 BUY above $85K
🔴 SELL below $83.1K
🟡 Wait for confirmation
#BTCUSDT #BitcoinTrading #BTCAnalysis #BİNANCESQUARE
#BTCFallsBelow BTC BUY OR SELL WATCH 🚨
Bitcoin is trading around the $83K–$84K zone, making today’s price action important for short-term traders.
🟢 BUY above $85K
🔴 SELL below $83.1K
🟡 Wait for confirmation
📈 BUY setup:
If $BTC reclaims $84.4K–$85K and holds above the zone with strong volume, bullish momentum could strengthen.
📉 SELL/SHORT setup:
If BTC decisively breaks below $83.1K and confirms the breakdown on the 4H candle, traders may watch $82K–$81.2K as the next downside area.
⚠️ Between $83.1K–$84.4K: price may remain choppy, so confirmation is more important than chasing the move.
🎯 Key levels:
Support: $83.1K → $82K → $81.2K
Resistance: $84.4K → $85K
My focus today: wait for confirmation before taking a direction.
What are you watching? 👇
🟢 BUY above $85K
🔴 SELL below $83.1K
🟡 Wait for confirmation
#BTCUSDT #BitcoinTrading #BTCAnalysis #BİNANCESQUARE
Bitcoin is trading around the $83K–$84K zone, making today’s price action important for short-term traders.
🟢 BUY above $85K
🔴 SELL below $83.1K
🟡 Wait for confirmation
📈 BUY setup:
If $BTC reclaims $84.4K–$85K and holds above the zone with strong volume, bullish momentum could strengthen.
📉 SELL/SHORT setup:
If BTC decisively breaks below $83.1K and confirms the breakdown on the 4H candle, traders may watch $82K–$81.2K as the next downside area.
⚠️ Between $83.1K–$84.4K: price may remain choppy, so confirmation is more important than chasing the move.
🎯 Key levels:
Support: $83.1K → $82K → $81.2K
Resistance: $84.4K → $85K
My focus today: wait for confirmation before taking a direction.
What are you watching? 👇
🟢 BUY above $85K
🔴 SELL below $83.1K
🟡 Wait for confirmation
#BTCUSDT #BitcoinTrading #BTCAnalysis #BİNANCESQUARE
39

·
--
BTC slips below 83,000 and stays on the hot list|OTC成交增长 does not mean net buy growth|Near 82.8万, I’ll wait first
My attitude is to first distinguish between成交 (trading/volume) and inflows, and not to boost my bottom-fishing conviction by using growth in institutional business as an excuse.
In this round of news scanning, Binance’s official OTC account shows the September monthly report. I cross-check the original text on the website: the article was published on September 21 and reviews August. In it, “growth 233%” refers to the in-year trading volume as of August compared to the same period last year—about 3.33 times—not net inflows on September 28, and certainly not a 233% increase in BTC institutional holdings. When the date and the denominator are clearly stated, you won’t mistakenly use an old-cycle report as “proof” of today’s buying pressure.
The report also mentions that BTC and other assets in August had ongoing demand for large-size trades, but stablecoin-to-fiat conversion is an important source of成交. My view is that these pieces of information are better used to observe how institutions execute and move capital, rather than directly concluding that the coin price must rise. One customer converts stablecoins into USD, increasing counter sales; another customer adjusts asset allocations, which can also generate trades. When成交 volume grows, both buyers and sellers are involved—publicly available summarized figures do not tell me how much BTC was net bought today.
How does this affect the crypto market? Execution efficiency, quote competition, and settlement speed determine the friction involved when large capital moves positions. While more mature channels help the market function, they do not promise that every trade is an additional long. Especially when prices weaken, I care more about whether real orders continue to absorb the sell pressure; you can’t replace “current buy-side is sufficient” with the idea that “institutional participation increases.” And I didn’t extrapolate one sample of counter business into a conclusion for the entire industry’s capital.
How has the market reacted? In this round, Kraken’s USD spot BTC is around 82,839.6; over the last 24 hours it ranges from 82,688.5 to 85,142.8. It is indeed below 83,000 and close to the lower edge of the window, matching the hot list’s narrative about the breakdown. I don’t have evidence that attributes this decline to the monthly report. The US spot ETF data with the latest completed day is still September 25, so you can’t use Friday’s subscriptions to justify this price level today. Any hints of corporate BTC-buying similarly have to wait for formal disclosure.
If I were trading on my own, I wouldn’t participate right now—position zero. No shorting, and no leverage adding. I’d only consider conditional spot “try longs”: only if the hourly close is above 83,500, then a retest from 83,350 to 83,500 holds, and the quotes and deposits/withdrawals are normal—then I would participate with up to 0.3% of total funds. Cut in half at 84,000, and close the remaining at 84,500. Hard stop at 83,000, or exit completely if two consecutive hourly closes fall below 83,350. Entering becomes invalid if the price breaks below 82,500; after a breakout, if the follow-through/absorption disappears or the channel is abnormal, I withdraw the judgment too, and I don’t average down losses.
To overturn a cautious view, we need new, verifiable capital-flow evidence and price repair happening together—not just more discussion participants from added “hype.” If the lows keep moving lower, then keep waiting. Untriggered conditions are just a plan; without trades there is nothing to review for profits.
Source: Binance OTC September monthly report https://www.binance.com/en/blog/otc/312776731690991130 and the official account; Kraken price data; Farside date cross-check.
#BTCFallsBelow$83000 #BTC
The above is solely my personal market observation and does not constitute investment advice.
BTC slips below 83,000 and stays on the hot list|OTC成交增长 does not mean net buy growth|Near 82.8万, I’ll wait first
My attitude is to first distinguish between成交 (trading/volume) and inflows, and not to boost my bottom-fishing conviction by using growth in institutional business as an excuse.
In this round of news scanning, Binance’s official OTC account shows the September monthly report. I cross-check the original text on the website: the article was published on September 21 and reviews August. In it, “growth 233%” refers to the in-year trading volume as of August compared to the same period last year—about 3.33 times—not net inflows on September 28, and certainly not a 233% increase in BTC institutional holdings. When the date and the denominator are clearly stated, you won’t mistakenly use an old-cycle report as “proof” of today’s buying pressure.
The report also mentions that BTC and other assets in August had ongoing demand for large-size trades, but stablecoin-to-fiat conversion is an important source of成交. My view is that these pieces of information are better used to observe how institutions execute and move capital, rather than directly concluding that the coin price must rise. One customer converts stablecoins into USD, increasing counter sales; another customer adjusts asset allocations, which can also generate trades. When成交 volume grows, both buyers and sellers are involved—publicly available summarized figures do not tell me how much BTC was net bought today.
How does this affect the crypto market? Execution efficiency, quote competition, and settlement speed determine the friction involved when large capital moves positions. While more mature channels help the market function, they do not promise that every trade is an additional long. Especially when prices weaken, I care more about whether real orders continue to absorb the sell pressure; you can’t replace “current buy-side is sufficient” with the idea that “institutional participation increases.” And I didn’t extrapolate one sample of counter business into a conclusion for the entire industry’s capital.
How has the market reacted? In this round, Kraken’s USD spot BTC is around 82,839.6; over the last 24 hours it ranges from 82,688.5 to 85,142.8. It is indeed below 83,000 and close to the lower edge of the window, matching the hot list’s narrative about the breakdown. I don’t have evidence that attributes this decline to the monthly report. The US spot ETF data with the latest completed day is still September 25, so you can’t use Friday’s subscriptions to justify this price level today. Any hints of corporate BTC-buying similarly have to wait for formal disclosure.
If I were trading on my own, I wouldn’t participate right now—position zero. No shorting, and no leverage adding. I’d only consider conditional spot “try longs”: only if the hourly close is above 83,500, then a retest from 83,350 to 83,500 holds, and the quotes and deposits/withdrawals are normal—then I would participate with up to 0.3% of total funds. Cut in half at 84,000, and close the remaining at 84,500. Hard stop at 83,000, or exit completely if two consecutive hourly closes fall below 83,350. Entering becomes invalid if the price breaks below 82,500; after a breakout, if the follow-through/absorption disappears or the channel is abnormal, I withdraw the judgment too, and I don’t average down losses.
To overturn a cautious view, we need new, verifiable capital-flow evidence and price repair happening together—not just more discussion participants from added “hype.” If the lows keep moving lower, then keep waiting. Untriggered conditions are just a plan; without trades there is nothing to review for profits.
Source: Binance OTC September monthly report https://www.binance.com/en/blog/otc/312776731690991130 and the official account; Kraken price data; Farside date cross-check.
#BTCFallsBelow$83000 #BTC
The above is solely my personal market observation and does not constitute investment advice.
My attitude is to first distinguish between成交 (trading/volume) and inflows, and not to boost my bottom-fishing conviction by using growth in institutional business as an excuse.
In this round of news scanning, Binance’s official OTC account shows the September monthly report. I cross-check the original text on the website: the article was published on September 21 and reviews August. In it, “growth 233%” refers to the in-year trading volume as of August compared to the same period last year—about 3.33 times—not net inflows on September 28, and certainly not a 233% increase in BTC institutional holdings. When the date and the denominator are clearly stated, you won’t mistakenly use an old-cycle report as “proof” of today’s buying pressure.
The report also mentions that BTC and other assets in August had ongoing demand for large-size trades, but stablecoin-to-fiat conversion is an important source of成交. My view is that these pieces of information are better used to observe how institutions execute and move capital, rather than directly concluding that the coin price must rise. One customer converts stablecoins into USD, increasing counter sales; another customer adjusts asset allocations, which can also generate trades. When成交 volume grows, both buyers and sellers are involved—publicly available summarized figures do not tell me how much BTC was net bought today.
How does this affect the crypto market? Execution efficiency, quote competition, and settlement speed determine the friction involved when large capital moves positions. While more mature channels help the market function, they do not promise that every trade is an additional long. Especially when prices weaken, I care more about whether real orders continue to absorb the sell pressure; you can’t replace “current buy-side is sufficient” with the idea that “institutional participation increases.” And I didn’t extrapolate one sample of counter business into a conclusion for the entire industry’s capital.
How has the market reacted? In this round, Kraken’s USD spot BTC is around 82,839.6; over the last 24 hours it ranges from 82,688.5 to 85,142.8. It is indeed below 83,000 and close to the lower edge of the window, matching the hot list’s narrative about the breakdown. I don’t have evidence that attributes this decline to the monthly report. The US spot ETF data with the latest completed day is still September 25, so you can’t use Friday’s subscriptions to justify this price level today. Any hints of corporate BTC-buying similarly have to wait for formal disclosure.
If I were trading on my own, I wouldn’t participate right now—position zero. No shorting, and no leverage adding. I’d only consider conditional spot “try longs”: only if the hourly close is above 83,500, then a retest from 83,350 to 83,500 holds, and the quotes and deposits/withdrawals are normal—then I would participate with up to 0.3% of total funds. Cut in half at 84,000, and close the remaining at 84,500. Hard stop at 83,000, or exit completely if two consecutive hourly closes fall below 83,350. Entering becomes invalid if the price breaks below 82,500; after a breakout, if the follow-through/absorption disappears or the channel is abnormal, I withdraw the judgment too, and I don’t average down losses.
To overturn a cautious view, we need new, verifiable capital-flow evidence and price repair happening together—not just more discussion participants from added “hype.” If the lows keep moving lower, then keep waiting. Untriggered conditions are just a plan; without trades there is nothing to review for profits.
Source: Binance OTC September monthly report https://www.binance.com/en/blog/otc/312776731690991130 and the official account; Kraken price data; Farside date cross-check.
#BTCFallsBelow$83000 #BTC
The above is solely my personal market observation and does not constitute investment advice.

86

·
--
While I was checking the market on the exchange today, I suddenly noticed the BTC price plummeting—dropping straight through the $83,000 mark. I quickly looked up the latest developments. It turns out this was driven by rising expectations of Fed rate hikes, a decline in market risk appetite, and also some large mining operations cutting back production due to cost pressures, which increased selling pressure on Bitcoin. According to CoinDesk, over the past 24 hours, BTC has cumulatively fallen by more than 12%, with its market cap evaporating by over $15 billion. I remember how, last month, I was still hoping for a bullish breakout above $90,000—now it’s caught everyone off guard. This kind of market volatility really is unsettling, but some people also believe it could be a chance for correction. Either way, for long-term investors, this may be a moment to think about holding costs and risk management. #BTCFallsBelow$83000
While I was checking the market on the exchange today, I suddenly noticed the BTC price plummeting—dropping straight through the $83,000 mark. I quickly looked up the latest developments. It turns out this was driven by rising expectations of Fed rate hikes, a decline in market risk appetite, and also some large mining operations cutting back production due to cost pressures, which increased selling pressure on Bitcoin. According to CoinDesk, over the past 24 hours, BTC has cumulatively fallen by more than 12%, with its market cap evaporating by over $15 billion. I remember how, last month, I was still hoping for a bullish breakout above $90,000—now it’s caught everyone off guard. This kind of market volatility really is unsettling, but some people also believe it could be a chance for correction. Either way, for long-term investors, this may be a moment to think about holding costs and risk management. #BTCFallsBelow$83000
60
·
--
BTC falls below 83,000 and enters the trending list|Client progress cannot replace risk handling|If SOL is at $118, I’ll wait
Clear stance: I won’t chase the SOL rebound, and I won’t go short just because BTC breaks below a key level. On Binance Square’s homepage, there’s a new trending topic: #BTCFallsBelow$83000, showing 21 people discussing; BTC also enters the six-hour search trend. SOL isn’t in that list. Hype doesn’t equal bullish capital entering, and you can’t take someone else’s short positions to “play back” as your own filled trades.
As of 15:58 Beijing time on September 28, the Kraken USD spot interface shows BTC at about $82,906, with the past twenty-four hours’ range from $82,688.50 to $85,142.80. SOL is about $117.92, with a range from $117.87 to $124.91—already close to the lower edge of that window. These are verifiable price conditions in the real world, not confirmation that the entire market has already liquidated, and there’s no evidence that today’s drop was caused solely by a single announcement. Binance News’s report about the break below 83,000 is directionally consistent with exchange quotes, but order books keep changing, and cross-platform prices aren’t exactly the same.
Another fact worth separating comes from the project’s official materials: Anza’s Agave release page lists 4.3.0 from September 18 as the stable version, while 4.4.0-alpha.5 explicitly states it’s only a tested pre-release and cannot be deployed to the production environment. This is same-day verification of old version information—not an upgrade that happened today. It also can’t be read as meaning all validators have already completed the switch. What I care about is the gap between testing, deployment, and adoption rate: having usable code solves only one link. Operational readiness and actual adoption still need to be verified; client progress also won’t automatically generate buy orders on exchanges.
Why would this headline affect SOL? My mechanism is that the same account’s risk budget constrains BTC and other coins simultaneously. If BTC continues below 83,000 without enough follow-through, traders may reduce total exposure; even if the project’s long-term progress continues, it may not prevent short-term position reductions. This is a conditional scenario, not proof that funds have already been withdrawn from SOL. Conversely, BTC reclaiming the key level only improves the environment—you still have to check SOL’s own quotes, trade follow-through, and whether deposits/withdrawals are working normally. You can’t use a one-minute BTC bounce to replace SOL’s confirmation.
Key levels to watch are the SOL window low near 117.87, the planned cancellation level at 116.50, and the $120 confirmation level. The window low might be refreshed; it’s not guaranteed support. If BTC reclaims and holds above 83,000 and SOL’s hourly close returns above $120, then the current “wait first” view would need to be adjusted. If it breaks below 116.50, or if cross-platform quotes become clearly distorted, then cancel the idea of trying longs and don’t immediately switch to adding.
If I were trading it myself: my current participation ratio is zero. I’ll only consider unleveraged spot trying-long after confirmation, not chasing shorts. First, BTC must have an hourly close back above 83,000. Then I’d wait for SOL’s hourly close to be above $120, and for a retest holding from $119.50 to $120—only then would I use up to 0.3% of total funds. Cut half at $122, and close the rest at $124. After entering, place a hard stop at $118.50, or if there are two consecutive hourly closes below $119.50, fully close. If before entry it breaks below 116.50, quotes are abnormal, withdrawals are not going smoothly, or the retest lacks follow-through, I cancel the plan. If the conditions aren’t triggered, then there’s no trade—don’t write “waiting” into a profit.
Source: Binance Square homepage, Binance News; Kraken spot interface; github.com/anza-xyz/agave/releases. #BTCFallsBelow$83000 #BTC #SOL
The above is only my personal market observation and does not constitute investment advice.
BTC falls below 83,000 and enters the trending list|Client progress cannot replace risk handling|If SOL is at $118, I’ll wait
Clear stance: I won’t chase the SOL rebound, and I won’t go short just because BTC breaks below a key level. On Binance Square’s homepage, there’s a new trending topic: #BTCFallsBelow$83000, showing 21 people discussing; BTC also enters the six-hour search trend. SOL isn’t in that list. Hype doesn’t equal bullish capital entering, and you can’t take someone else’s short positions to “play back” as your own filled trades.
As of 15:58 Beijing time on September 28, the Kraken USD spot interface shows BTC at about $82,906, with the past twenty-four hours’ range from $82,688.50 to $85,142.80. SOL is about $117.92, with a range from $117.87 to $124.91—already close to the lower edge of that window. These are verifiable price conditions in the real world, not confirmation that the entire market has already liquidated, and there’s no evidence that today’s drop was caused solely by a single announcement. Binance News’s report about the break below 83,000 is directionally consistent with exchange quotes, but order books keep changing, and cross-platform prices aren’t exactly the same.
Another fact worth separating comes from the project’s official materials: Anza’s Agave release page lists 4.3.0 from September 18 as the stable version, while 4.4.0-alpha.5 explicitly states it’s only a tested pre-release and cannot be deployed to the production environment. This is same-day verification of old version information—not an upgrade that happened today. It also can’t be read as meaning all validators have already completed the switch. What I care about is the gap between testing, deployment, and adoption rate: having usable code solves only one link. Operational readiness and actual adoption still need to be verified; client progress also won’t automatically generate buy orders on exchanges.
Why would this headline affect SOL? My mechanism is that the same account’s risk budget constrains BTC and other coins simultaneously. If BTC continues below 83,000 without enough follow-through, traders may reduce total exposure; even if the project’s long-term progress continues, it may not prevent short-term position reductions. This is a conditional scenario, not proof that funds have already been withdrawn from SOL. Conversely, BTC reclaiming the key level only improves the environment—you still have to check SOL’s own quotes, trade follow-through, and whether deposits/withdrawals are working normally. You can’t use a one-minute BTC bounce to replace SOL’s confirmation.
Key levels to watch are the SOL window low near 117.87, the planned cancellation level at 116.50, and the $120 confirmation level. The window low might be refreshed; it’s not guaranteed support. If BTC reclaims and holds above 83,000 and SOL’s hourly close returns above $120, then the current “wait first” view would need to be adjusted. If it breaks below 116.50, or if cross-platform quotes become clearly distorted, then cancel the idea of trying longs and don’t immediately switch to adding.
If I were trading it myself: my current participation ratio is zero. I’ll only consider unleveraged spot trying-long after confirmation, not chasing shorts. First, BTC must have an hourly close back above 83,000. Then I’d wait for SOL’s hourly close to be above $120, and for a retest holding from $119.50 to $120—only then would I use up to 0.3% of total funds. Cut half at $122, and close the rest at $124. After entering, place a hard stop at $118.50, or if there are two consecutive hourly closes below $119.50, fully close. If before entry it breaks below 116.50, quotes are abnormal, withdrawals are not going smoothly, or the retest lacks follow-through, I cancel the plan. If the conditions aren’t triggered, then there’s no trade—don’t write “waiting” into a profit.
Source: Binance Square homepage, Binance News; Kraken spot interface; github.com/anza-xyz/agave/releases. #BTCFallsBelow$83000 #BTC #SOL
The above is only my personal market observation and does not constitute investment advice.
Clear stance: I won’t chase the SOL rebound, and I won’t go short just because BTC breaks below a key level. On Binance Square’s homepage, there’s a new trending topic: #BTCFallsBelow$83000, showing 21 people discussing; BTC also enters the six-hour search trend. SOL isn’t in that list. Hype doesn’t equal bullish capital entering, and you can’t take someone else’s short positions to “play back” as your own filled trades.
As of 15:58 Beijing time on September 28, the Kraken USD spot interface shows BTC at about $82,906, with the past twenty-four hours’ range from $82,688.50 to $85,142.80. SOL is about $117.92, with a range from $117.87 to $124.91—already close to the lower edge of that window. These are verifiable price conditions in the real world, not confirmation that the entire market has already liquidated, and there’s no evidence that today’s drop was caused solely by a single announcement. Binance News’s report about the break below 83,000 is directionally consistent with exchange quotes, but order books keep changing, and cross-platform prices aren’t exactly the same.
Another fact worth separating comes from the project’s official materials: Anza’s Agave release page lists 4.3.0 from September 18 as the stable version, while 4.4.0-alpha.5 explicitly states it’s only a tested pre-release and cannot be deployed to the production environment. This is same-day verification of old version information—not an upgrade that happened today. It also can’t be read as meaning all validators have already completed the switch. What I care about is the gap between testing, deployment, and adoption rate: having usable code solves only one link. Operational readiness and actual adoption still need to be verified; client progress also won’t automatically generate buy orders on exchanges.
Why would this headline affect SOL? My mechanism is that the same account’s risk budget constrains BTC and other coins simultaneously. If BTC continues below 83,000 without enough follow-through, traders may reduce total exposure; even if the project’s long-term progress continues, it may not prevent short-term position reductions. This is a conditional scenario, not proof that funds have already been withdrawn from SOL. Conversely, BTC reclaiming the key level only improves the environment—you still have to check SOL’s own quotes, trade follow-through, and whether deposits/withdrawals are working normally. You can’t use a one-minute BTC bounce to replace SOL’s confirmation.
Key levels to watch are the SOL window low near 117.87, the planned cancellation level at 116.50, and the $120 confirmation level. The window low might be refreshed; it’s not guaranteed support. If BTC reclaims and holds above 83,000 and SOL’s hourly close returns above $120, then the current “wait first” view would need to be adjusted. If it breaks below 116.50, or if cross-platform quotes become clearly distorted, then cancel the idea of trying longs and don’t immediately switch to adding.
If I were trading it myself: my current participation ratio is zero. I’ll only consider unleveraged spot trying-long after confirmation, not chasing shorts. First, BTC must have an hourly close back above 83,000. Then I’d wait for SOL’s hourly close to be above $120, and for a retest holding from $119.50 to $120—only then would I use up to 0.3% of total funds. Cut half at $122, and close the rest at $124. After entering, place a hard stop at $118.50, or if there are two consecutive hourly closes below $119.50, fully close. If before entry it breaks below 116.50, quotes are abnormal, withdrawals are not going smoothly, or the retest lacks follow-through, I cancel the plan. If the conditions aren’t triggered, then there’s no trade—don’t write “waiting” into a profit.
Source: Binance Square homepage, Binance News; Kraken spot interface; github.com/anza-xyz/agave/releases. #BTCFallsBelow$83000 #BTC #SOL
The above is only my personal market observation and does not constitute investment advice.

98
Article
Market Open: Crypto Faces Pressure with $BTC Falls Below $83000Yesterday's close recapped a mixed trading environment, where $BTC ended slightly higher at $84,472.01, while $ETH experienced a minor drop. This cautious sentiment reflected ongoing regulatory concerns and the search for new opportunities in the market.
As we open the session today, the mood has shifted noticeably, with major coins under pressure. $BTC is currently trading at $83,002.02, down 2.20%, while $ETH follows suit with a decline of 1.91% to $2,658.23. BNB and SOL are also experiencing losses, down 2.15% and 4.31% respectively. This downward trend suggests that traders are responding to new developments and adjusting their positions accordingly.
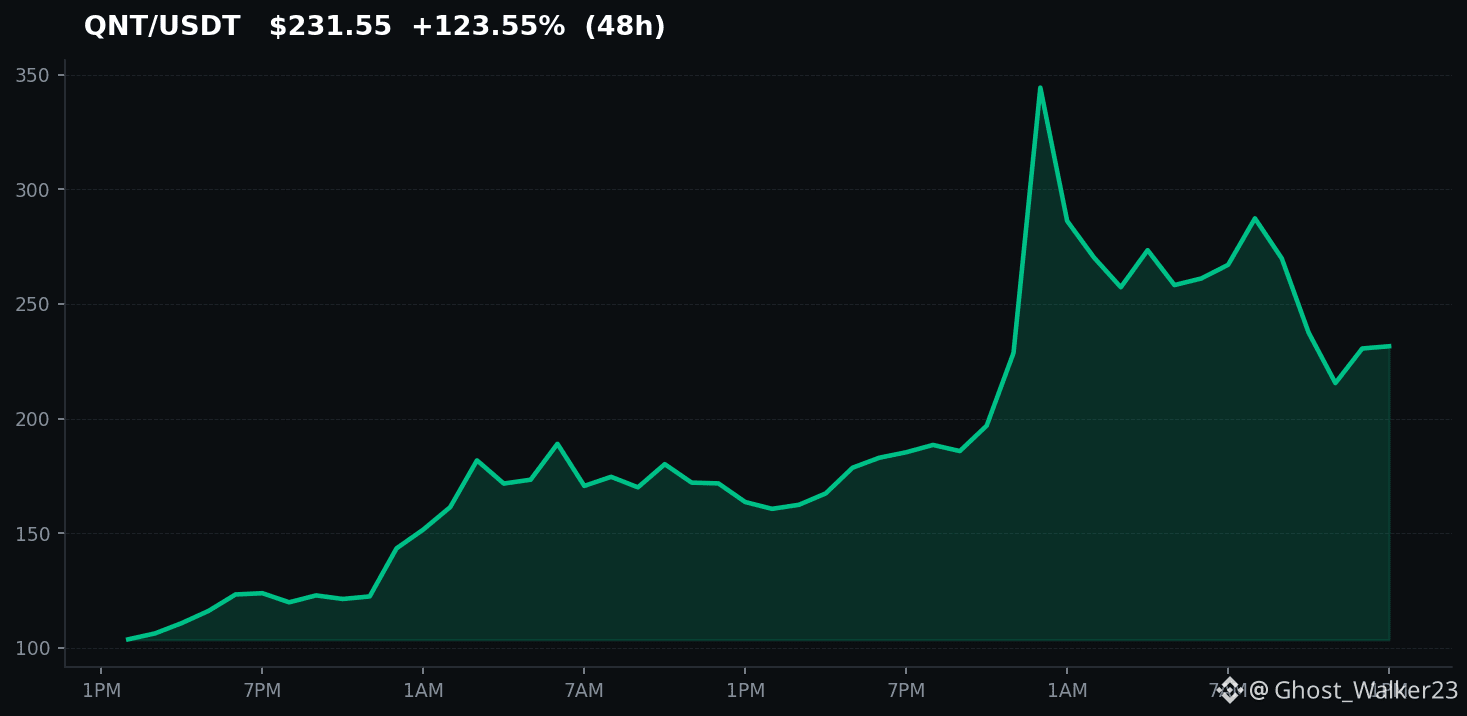
In today’s early movers, QNT continues to shine with a remarkable gain of 34.6%, highlighting strong investor interest and the potential for further growth despite broader market challenges. Other notable gainers include HBAR and ONE, both showing robust performances. Conversely, the top losers include GLMR and NIL, indicating that not all sectors are faring well in this market landscape.
A significant narrative currently trending on Binance Square is #BTCFallsBelow$83000, which encapsulates traders' concerns about $BTC dipping below this psychological threshold. This development is likely causing increased volatility and could lead to further adjustments in trading strategies as investors reassess their positions.
Looking ahead, a question looms: How will the market respond if regulatory pressures continue to mount, and will we see a rebound in key coins, or are we in for further declines? Keeping an eye on emerging trends and potential catalysts will be crucial for navigating today’s session.
💬 Únete y síguenos, seguimos analizando el mercado por ti.
Market Open: Crypto Faces Pressure with $BTC Falls Below $83000
Yesterday's close recapped a mixed trading environment, where $BTC ended slightly higher at $84,472.01, while $ETH experienced a minor drop. This cautious sentiment reflected ongoing regulatory concerns and the search for new opportunities in the market.
As we open the session today, the mood has shifted noticeably, with major coins under pressure. $BTC is currently trading at $83,002.02, down 2.20%, while $ETH follows suit with a decline of 1.91% to $2,658.23. BNB and SOL are also experiencing losses, down 2.15% and 4.31% respectively. This downward trend suggests that traders are responding to new developments and adjusting their positions accordingly.
In today’s early movers, QNT continues to shine with a remarkable gain of 34.6%, highlighting strong investor interest and the potential for further growth despite broader market challenges. Other notable gainers include HBAR and ONE, both showing robust performances. Conversely, the top losers include GLMR and NIL, indicating that not all sectors are faring well in this market landscape.
A significant narrative currently trending on Binance Square is #BTCFallsBelow$83000, which encapsulates traders' concerns about $BTC dipping below this psychological threshold. This development is likely causing increased volatility and could lead to further adjustments in trading strategies as investors reassess their positions.
Looking ahead, a question looms: How will the market respond if regulatory pressures continue to mount, and will we see a rebound in key coins, or are we in for further declines? Keeping an eye on emerging trends and potential catalysts will be crucial for navigating today’s session.
💬 Únete y síguenos, seguimos analizando el mercado por ti.
As we open the session today, the mood has shifted noticeably, with major coins under pressure. $BTC is currently trading at $83,002.02, down 2.20%, while $ETH follows suit with a decline of 1.91% to $2,658.23. BNB and SOL are also experiencing losses, down 2.15% and 4.31% respectively. This downward trend suggests that traders are responding to new developments and adjusting their positions accordingly.
In today’s early movers, QNT continues to shine with a remarkable gain of 34.6%, highlighting strong investor interest and the potential for further growth despite broader market challenges. Other notable gainers include HBAR and ONE, both showing robust performances. Conversely, the top losers include GLMR and NIL, indicating that not all sectors are faring well in this market landscape.
A significant narrative currently trending on Binance Square is #BTCFallsBelow$83000, which encapsulates traders' concerns about $BTC dipping below this psychological threshold. This development is likely causing increased volatility and could lead to further adjustments in trading strategies as investors reassess their positions.
Looking ahead, a question looms: How will the market respond if regulatory pressures continue to mount, and will we see a rebound in key coins, or are we in for further declines? Keeping an eye on emerging trends and potential catalysts will be crucial for navigating today’s session.
💬 Únete y síguenos, seguimos analizando el mercado por ti.
103
Federal Reserve rate-hike expectations have surged, combined with faster institutional inflows, bringing global financial markets to a critical decision moment
1. Macro storm: the probability of an October rate hike rises to 65%
In the last week of September, global financial markets once again focus on the U.S. Federal Reserve. According to the latest data from the CME FedWatch tool, the probability of a 25-basis-point rate hike at the October 28 FOMC meeting has jumped to 64.8%, far above market expectations from the previous week. Behind this shift is that after the September 16 rate hike, core inflation has remained stubbornly around 3.3%, along with unexpected resilience in the labor market—leaving the Fed with almost no room to cut rates.
U.S. 10-year Treasury yields climbed accordingly to 5.17%, the highest level since 2007. For risk assets, this means the cost of capital keeps rising and valuations face pressure. Bitcoin fell this week below the $83,000 level, moving in tandem with a pullback in U.S. stock technology shares. The market is re-pricing a higher-for-longer interest-rate environment.
2. Institutions go against the trend: $2.3 billion net inflow into Bitcoin ETFs in one week
Despite price pressure, institutional investors’ actions sharply contrast with market sentiment. Data show that spot Bitcoin ETFs recorded $2.3 billion in net inflows last week, reversing the cumulative net outflow position since 2026. BlackRock and Fidelity’s ETF products led the buying; even on Monday alone they attracted roughly $1 billion in capital, setting the ninth-largest single-day inflow since ETF launch.
This divergence—prices falling while funds keep pouring in—reflects institutions’ strong confidence in Bitcoin’s long-term value. Multiple corporate buyers are using the pullback window to accumulate, and even when a dormant “whale” transferred 4,500 Bitcoins to exchanges, the market’s capacity to absorb them remains impressive.
3. Traditional finance embraces blockchain: QNT jumps 300% in a week
Within the narrative of convergence between traditional finance and blockchain, Quant Network’s QNT token has been the biggest standout this week. In just one week, QNT surged by about 300%. The key catalysts include the U.S. Clearing House’s inclusion of QNT in its On-Chain Money initiative, as well as announcements from Barclays Bank and HSBC in the UK that they have connected to the Overledger platform.
Because enterprise authorization licenses on Overledger require payment in QNT tokens, actual bank adoption translates directly into token demand. This event perfectly illustrates the trend of traditional financial infrastructure migrating on-chain and injects strong confidence into the tokenized-asset track.
4. Regulatory developments: Fed’s proposed stablecoin payment rules and California’s ban on officials issuing meme coins
Regulators are also active. The Federal Reserve has formally proposed a regulatory framework for payment stablecoins. The plaza discussion has generated as many as 12,000 views; opinions in the community are clearly divided, with the bullish-to-bearish ratio close. Meanwhile, California Governor Newsom signed the AB2409 bill, banning state and local government officials from issuing meme coins, effective January 1, 2027. The law explicitly targets nearly $3 billion in losses caused by the earlier TRUMP meme coin incident, marking the formal move of conflicts of interest between political figures and cryptocurrency into a legislated constraint phase.
5. Market outlook: a data-heavy week tests investors’ resolve
Looking ahead, this week will see multiple key economic data releases, including the core PCE price index and the revised nonfarm payroll figures. In an environment where rate-hike expectations remain elevated, any inflation data that comes in above forecasts could further push up Treasury yields, creating dual pressure on both crypto and stock markets. However, continued institutional inflows and the accelerating adoption by traditional finance are helping the market form a more solid medium- to long-term bottom. The battle between short-term volatility and long-term trends will be the core theme for the coming weeks.
#BTCFallsBelow$83000 #FedProposesPaymentStablecoinRules #QNTSurges300%
Federal Reserve rate-hike expectations have surged, combined with faster institutional inflows, bringing global financial markets to a critical decision moment
1. Macro storm: the probability of an October rate hike rises to 65%
In the last week of September, global financial markets once again focus on the U.S. Federal Reserve. According to the latest data from the CME FedWatch tool, the probability of a 25-basis-point rate hike at the October 28 FOMC meeting has jumped to 64.8%, far above market expectations from the previous week. Behind this shift is that after the September 16 rate hike, core inflation has remained stubbornly around 3.3%, along with unexpected resilience in the labor market—leaving the Fed with almost no room to cut rates.
U.S. 10-year Treasury yields climbed accordingly to 5.17%, the highest level since 2007. For risk assets, this means the cost of capital keeps rising and valuations face pressure. Bitcoin fell this week below the $83,000 level, moving in tandem with a pullback in U.S. stock technology shares. The market is re-pricing a higher-for-longer interest-rate environment.
2. Institutions go against the trend: $2.3 billion net inflow into Bitcoin ETFs in one week
Despite price pressure, institutional investors’ actions sharply contrast with market sentiment. Data show that spot Bitcoin ETFs recorded $2.3 billion in net inflows last week, reversing the cumulative net outflow position since 2026. BlackRock and Fidelity’s ETF products led the buying; even on Monday alone they attracted roughly $1 billion in capital, setting the ninth-largest single-day inflow since ETF launch.
This divergence—prices falling while funds keep pouring in—reflects institutions’ strong confidence in Bitcoin’s long-term value. Multiple corporate buyers are using the pullback window to accumulate, and even when a dormant “whale” transferred 4,500 Bitcoins to exchanges, the market’s capacity to absorb them remains impressive.
3. Traditional finance embraces blockchain: QNT jumps 300% in a week
Within the narrative of convergence between traditional finance and blockchain, Quant Network’s QNT token has been the biggest standout this week. In just one week, QNT surged by about 300%. The key catalysts include the U.S. Clearing House’s inclusion of QNT in its On-Chain Money initiative, as well as announcements from Barclays Bank and HSBC in the UK that they have connected to the Overledger platform.
Because enterprise authorization licenses on Overledger require payment in QNT tokens, actual bank adoption translates directly into token demand. This event perfectly illustrates the trend of traditional financial infrastructure migrating on-chain and injects strong confidence into the tokenized-asset track.
4. Regulatory developments: Fed’s proposed stablecoin payment rules and California’s ban on officials issuing meme coins
Regulators are also active. The Federal Reserve has formally proposed a regulatory framework for payment stablecoins. The plaza discussion has generated as many as 12,000 views; opinions in the community are clearly divided, with the bullish-to-bearish ratio close. Meanwhile, California Governor Newsom signed the AB2409 bill, banning state and local government officials from issuing meme coins, effective January 1, 2027. The law explicitly targets nearly $3 billion in losses caused by the earlier TRUMP meme coin incident, marking the formal move of conflicts of interest between political figures and cryptocurrency into a legislated constraint phase.
5. Market outlook: a data-heavy week tests investors’ resolve
Looking ahead, this week will see multiple key economic data releases, including the core PCE price index and the revised nonfarm payroll figures. In an environment where rate-hike expectations remain elevated, any inflation data that comes in above forecasts could further push up Treasury yields, creating dual pressure on both crypto and stock markets. However, continued institutional inflows and the accelerating adoption by traditional finance are helping the market form a more solid medium- to long-term bottom. The battle between short-term volatility and long-term trends will be the core theme for the coming weeks.
#BTCFallsBelow$83000 #FedProposesPaymentStablecoinRules #QNTSurges300%
1. Macro storm: the probability of an October rate hike rises to 65%
In the last week of September, global financial markets once again focus on the U.S. Federal Reserve. According to the latest data from the CME FedWatch tool, the probability of a 25-basis-point rate hike at the October 28 FOMC meeting has jumped to 64.8%, far above market expectations from the previous week. Behind this shift is that after the September 16 rate hike, core inflation has remained stubbornly around 3.3%, along with unexpected resilience in the labor market—leaving the Fed with almost no room to cut rates.
U.S. 10-year Treasury yields climbed accordingly to 5.17%, the highest level since 2007. For risk assets, this means the cost of capital keeps rising and valuations face pressure. Bitcoin fell this week below the $83,000 level, moving in tandem with a pullback in U.S. stock technology shares. The market is re-pricing a higher-for-longer interest-rate environment.
2. Institutions go against the trend: $2.3 billion net inflow into Bitcoin ETFs in one week
Despite price pressure, institutional investors’ actions sharply contrast with market sentiment. Data show that spot Bitcoin ETFs recorded $2.3 billion in net inflows last week, reversing the cumulative net outflow position since 2026. BlackRock and Fidelity’s ETF products led the buying; even on Monday alone they attracted roughly $1 billion in capital, setting the ninth-largest single-day inflow since ETF launch.
This divergence—prices falling while funds keep pouring in—reflects institutions’ strong confidence in Bitcoin’s long-term value. Multiple corporate buyers are using the pullback window to accumulate, and even when a dormant “whale” transferred 4,500 Bitcoins to exchanges, the market’s capacity to absorb them remains impressive.
3. Traditional finance embraces blockchain: QNT jumps 300% in a week
Within the narrative of convergence between traditional finance and blockchain, Quant Network’s QNT token has been the biggest standout this week. In just one week, QNT surged by about 300%. The key catalysts include the U.S. Clearing House’s inclusion of QNT in its On-Chain Money initiative, as well as announcements from Barclays Bank and HSBC in the UK that they have connected to the Overledger platform.
Because enterprise authorization licenses on Overledger require payment in QNT tokens, actual bank adoption translates directly into token demand. This event perfectly illustrates the trend of traditional financial infrastructure migrating on-chain and injects strong confidence into the tokenized-asset track.
4. Regulatory developments: Fed’s proposed stablecoin payment rules and California’s ban on officials issuing meme coins
Regulators are also active. The Federal Reserve has formally proposed a regulatory framework for payment stablecoins. The plaza discussion has generated as many as 12,000 views; opinions in the community are clearly divided, with the bullish-to-bearish ratio close. Meanwhile, California Governor Newsom signed the AB2409 bill, banning state and local government officials from issuing meme coins, effective January 1, 2027. The law explicitly targets nearly $3 billion in losses caused by the earlier TRUMP meme coin incident, marking the formal move of conflicts of interest between political figures and cryptocurrency into a legislated constraint phase.
5. Market outlook: a data-heavy week tests investors’ resolve
Looking ahead, this week will see multiple key economic data releases, including the core PCE price index and the revised nonfarm payroll figures. In an environment where rate-hike expectations remain elevated, any inflation data that comes in above forecasts could further push up Treasury yields, creating dual pressure on both crypto and stock markets. However, continued institutional inflows and the accelerating adoption by traditional finance are helping the market form a more solid medium- to long-term bottom. The battle between short-term volatility and long-term trends will be the core theme for the coming weeks.
#BTCFallsBelow$83000 #FedProposesPaymentStablecoinRules #QNTSurges300%
252
·
--
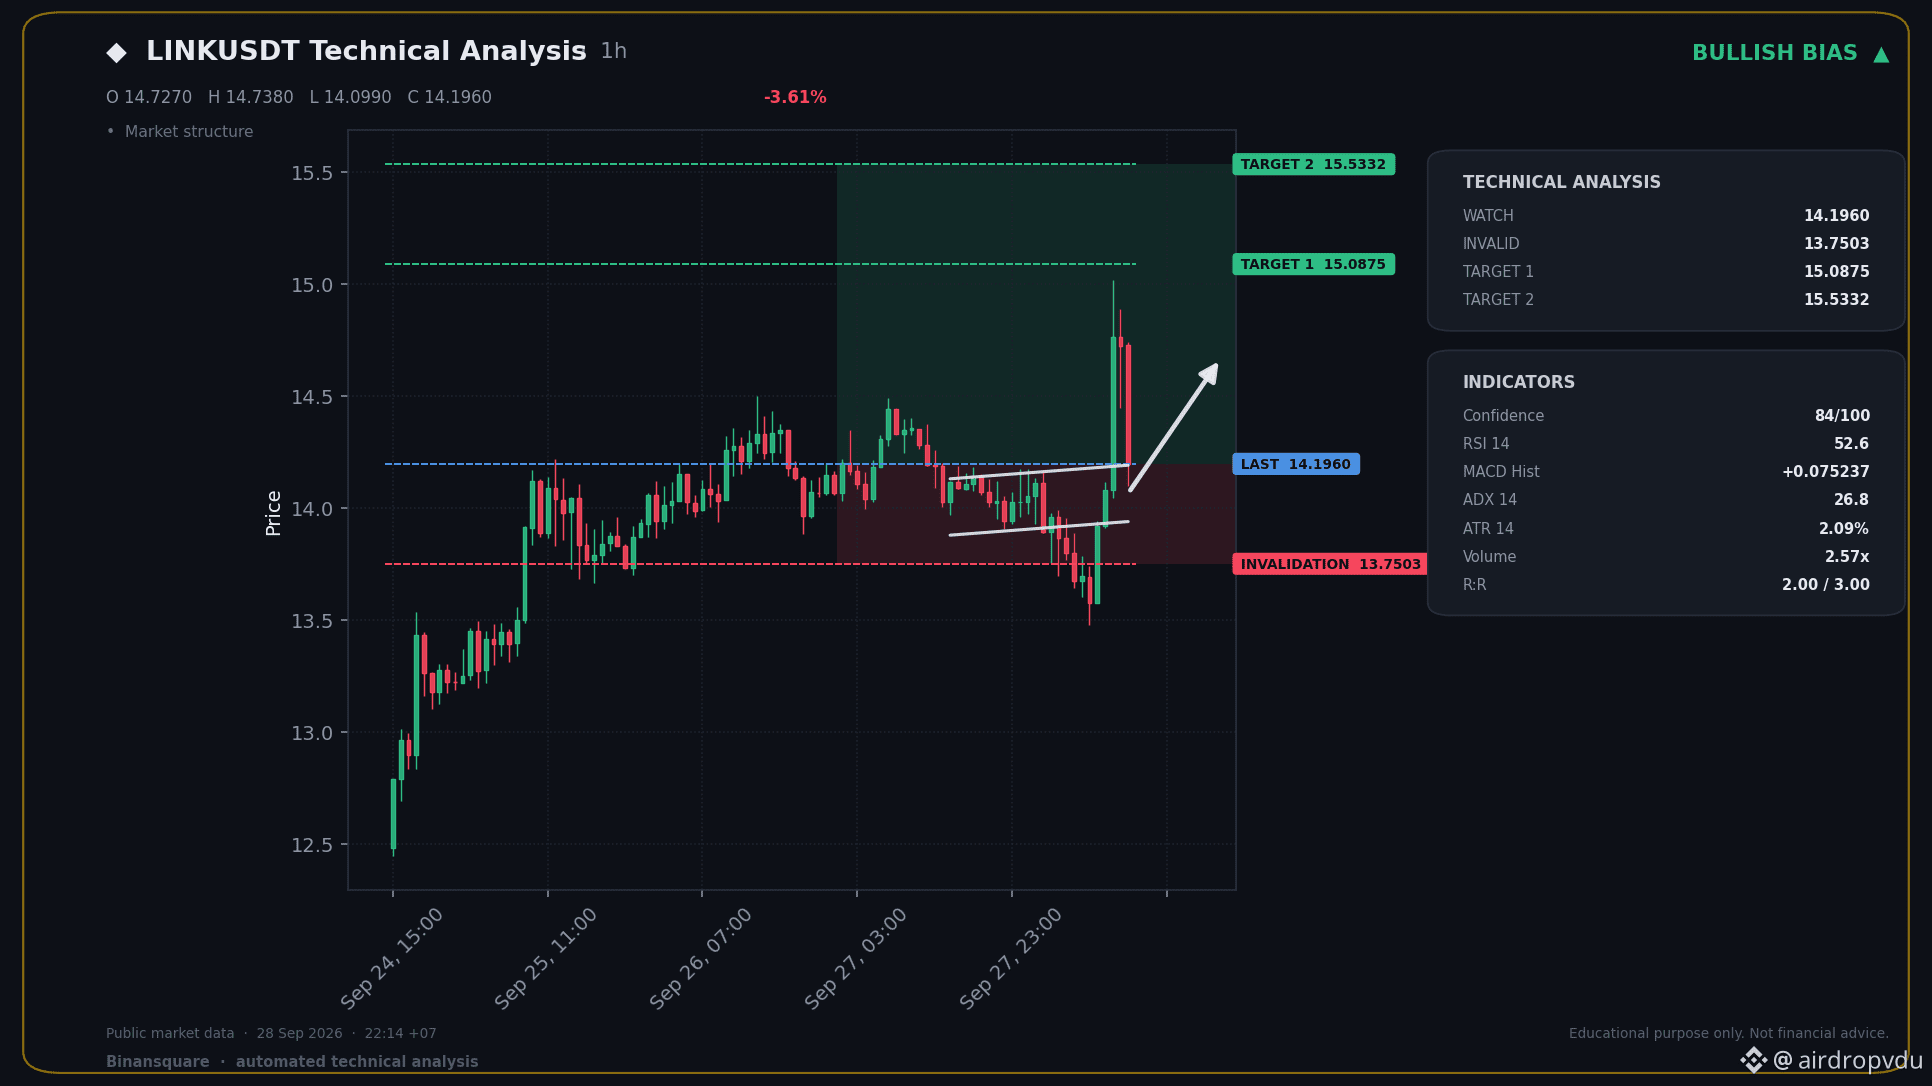
📈 BIG LONG NOW - LINKUSDT
📍 KEY LEVELS
Entry: 14.1960
🛑 SL: 13.7503
🎯 TP1: 15.0875
🎯 TP2: 15.5332
We're seeing bullish momentum return as the MACD just flipped green. The RSI showing strength after pulling back means there's still room to run before it gets overbought.
This signal was generated automatically from technical indicators. It does not guarantee profit and is not investment advice. Always manage your own risk and DYOR.
$LINK
#ChainlinkLaunchesCCIP2WithEnterpriseVerification #BTCFallsBelow$83000
📈 BIG LONG NOW - LINKUSDT
📍 KEY LEVELS
Entry: 14.1960
🛑 SL: 13.7503
🎯 TP1: 15.0875
🎯 TP2: 15.5332
We're seeing bullish momentum return as the MACD just flipped green. The RSI showing strength after pulling back means there's still room to run before it gets overbought.
This signal was generated automatically from technical indicators. It does not guarantee profit and is not investment advice. Always manage your own risk and DYOR.
$LINK
#ChainlinkLaunchesCCIP2WithEnterpriseVerification #BTCFallsBelow$83000
📍 KEY LEVELS
Entry: 14.1960
🛑 SL: 13.7503
🎯 TP1: 15.0875
🎯 TP2: 15.5332
We're seeing bullish momentum return as the MACD just flipped green. The RSI showing strength after pulling back means there's still room to run before it gets overbought.
This signal was generated automatically from technical indicators. It does not guarantee profit and is not investment advice. Always manage your own risk and DYOR.
$LINK
#ChainlinkLaunchesCCIP2WithEnterpriseVerification #BTCFallsBelow$83000
44
·
--
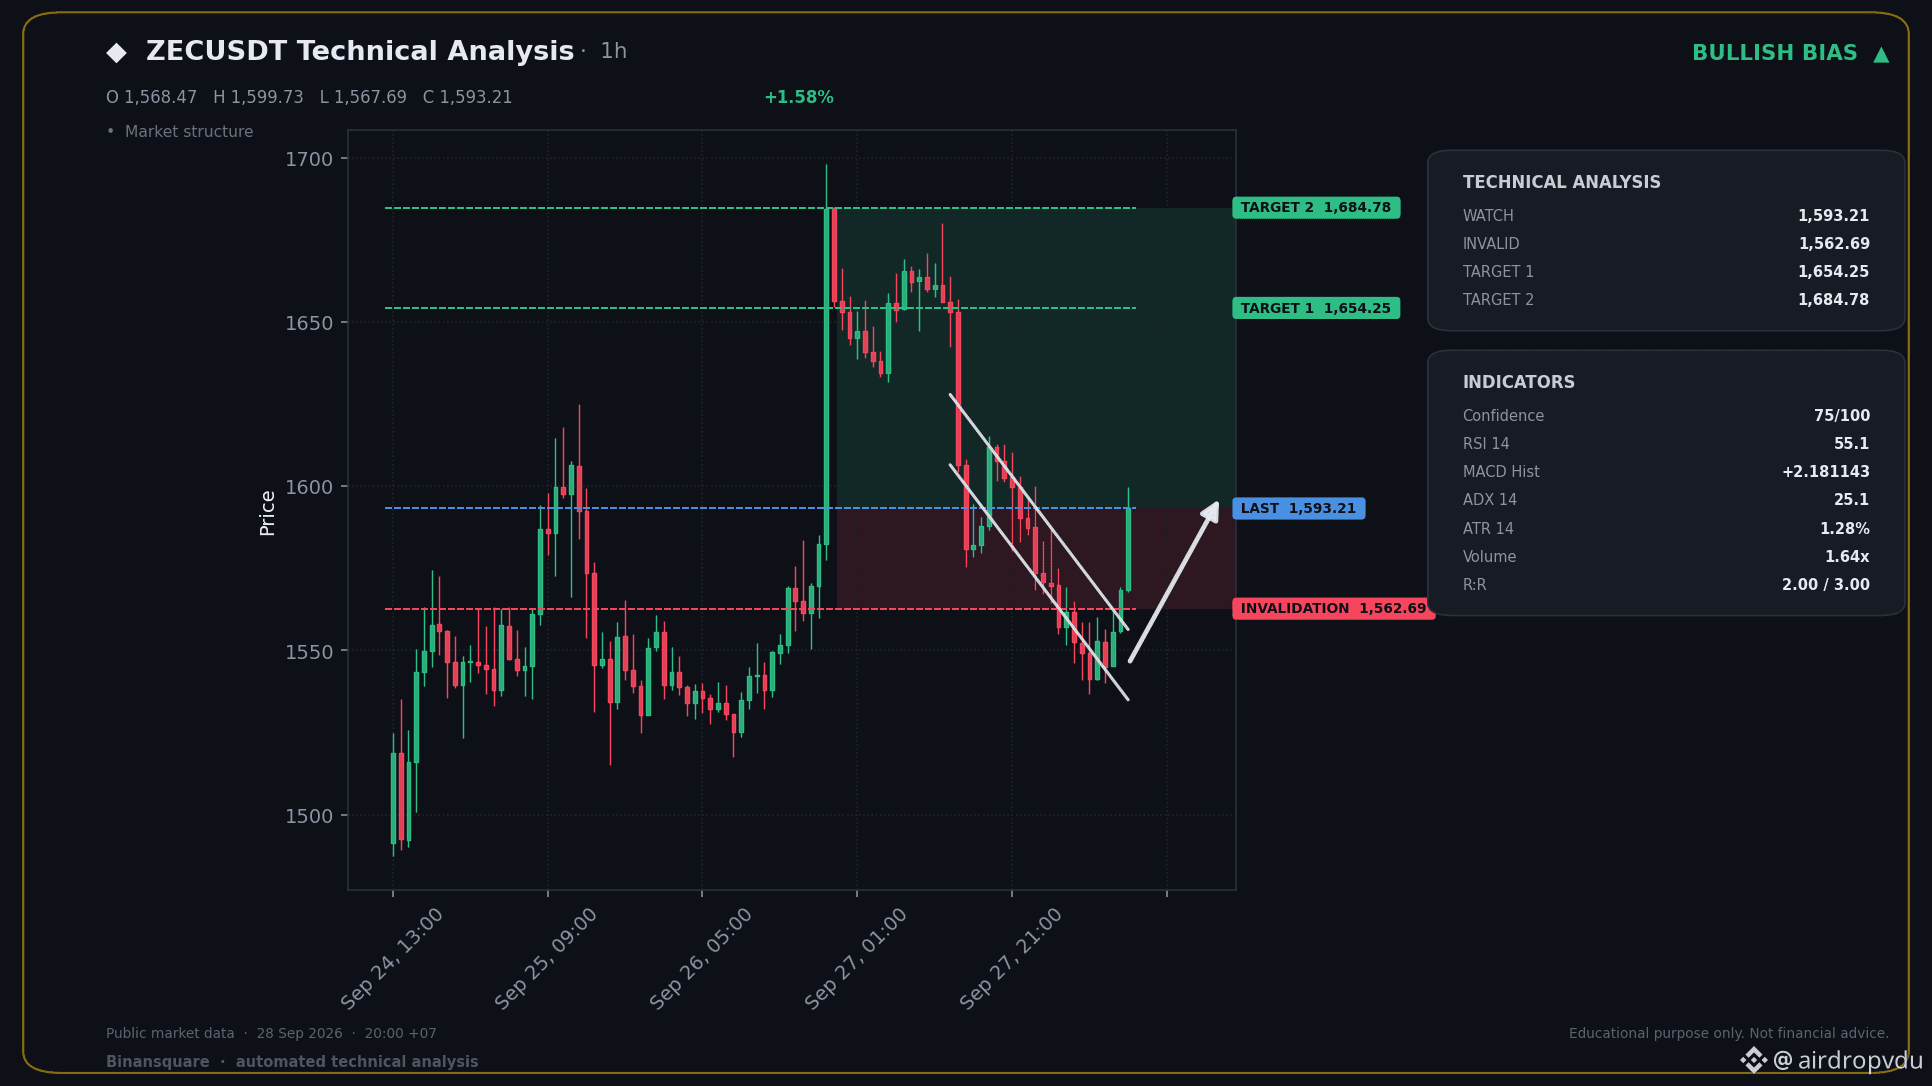
📈 BIG LONG NOW - ZECUSDT
📍 KEY LEVELS
Entry: 1,593.21
🛑 SL: 1,562.69
🎯 TP1: 1,654.25
🎯 TP2: 1,684.78
The trend is still solid with the 50-day EMA above the 200-day. Momentum's picking back up as the MACD just crossed bullish, and the RSI is recovering from a dip.
This signal was generated automatically from technical indicators. It does not guarantee profit and is not investment advice. Always manage your own risk and DYOR.
$ZEC
#BTCFallsBelow$83000 #BitcoinSpotETFs$2.39BWeeklyNetInflow
📈 BIG LONG NOW - ZECUSDT
📍 KEY LEVELS
Entry: 1,593.21
🛑 SL: 1,562.69
🎯 TP1: 1,654.25
🎯 TP2: 1,684.78
The trend is still solid with the 50-day EMA above the 200-day. Momentum's picking back up as the MACD just crossed bullish, and the RSI is recovering from a dip.
This signal was generated automatically from technical indicators. It does not guarantee profit and is not investment advice. Always manage your own risk and DYOR.
$ZEC
#BTCFallsBelow$83000 #BitcoinSpotETFs$2.39BWeeklyNetInflow
📍 KEY LEVELS
Entry: 1,593.21
🛑 SL: 1,562.69
🎯 TP1: 1,654.25
🎯 TP2: 1,684.78
The trend is still solid with the 50-day EMA above the 200-day. Momentum's picking back up as the MACD just crossed bullish, and the RSI is recovering from a dip.
This signal was generated automatically from technical indicators. It does not guarantee profit and is not investment advice. Always manage your own risk and DYOR.
$ZEC
#BTCFallsBelow$83000 #BitcoinSpotETFs$2.39BWeeklyNetInflow
160


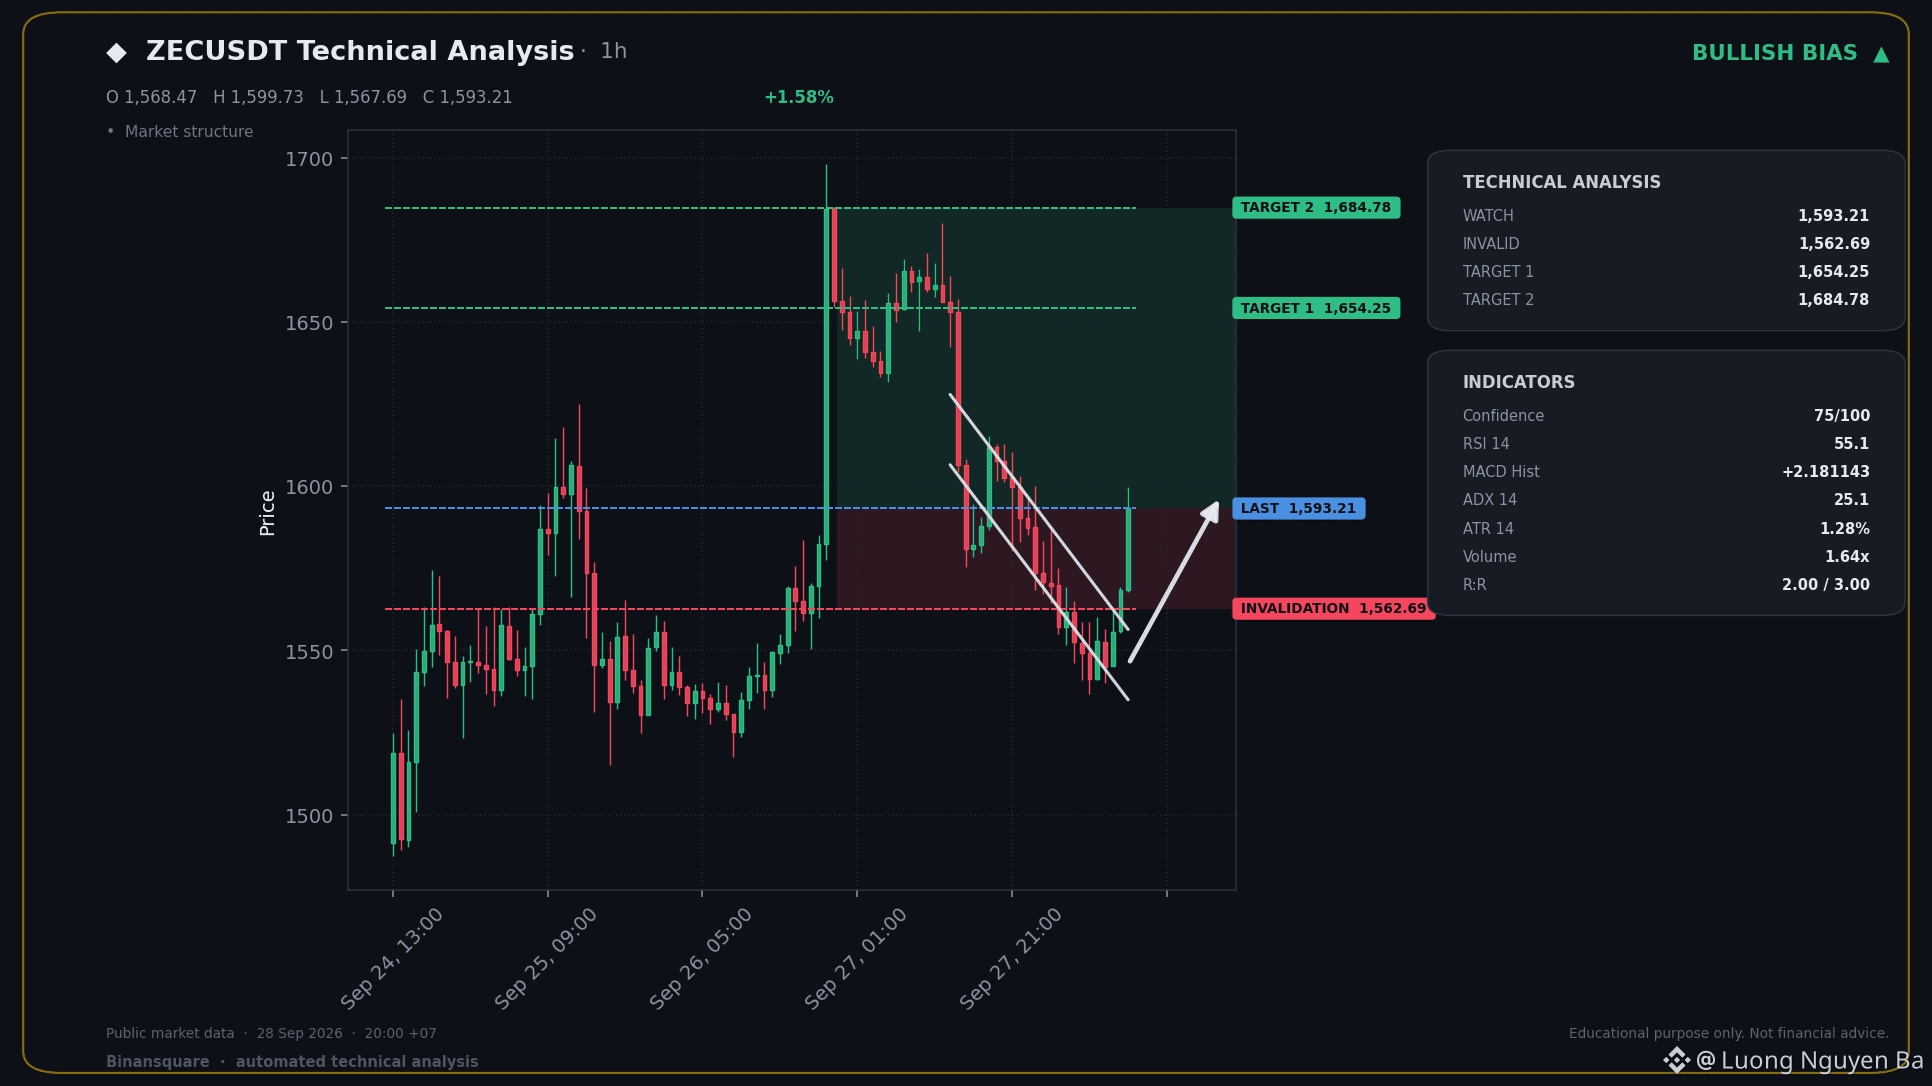
📈 BIG LONG NOW - ZECUSDT
📍 KEY LEVELS
Entry: 1,593.21
🛑 SL: 1,562.69
🎯 TP1: 1,654.25
🎯 TP2: 1,684.78
The trend is still solid with the 50-day EMA above the 200-day. Momentum's picking back up as the MACD just crossed bullish, and the RSI is recovering from a dip.
This signal was generated automatically from technical indicators. It does not guarantee profit and is not investment advice. Always manage your own risk and DYOR.
$ZEC
#BTCFallsBelow$83000 #BitcoinSpotETFs$2.39BWeeklyNetInflow
📈 BIG LONG NOW - ZECUSDT
📍 KEY LEVELS
Entry: 1,593.21
🛑 SL: 1,562.69
🎯 TP1: 1,654.25
🎯 TP2: 1,684.78
The trend is still solid with the 50-day EMA above the 200-day. Momentum's picking back up as the MACD just crossed bullish, and the RSI is recovering from a dip.
This signal was generated automatically from technical indicators. It does not guarantee profit and is not investment advice. Always manage your own risk and DYOR.
$ZEC
#BTCFallsBelow$83000 #BitcoinSpotETFs$2.39BWeeklyNetInflow
📍 KEY LEVELS
Entry: 1,593.21
🛑 SL: 1,562.69
🎯 TP1: 1,654.25
🎯 TP2: 1,684.78
The trend is still solid with the 50-day EMA above the 200-day. Momentum's picking back up as the MACD just crossed bullish, and the RSI is recovering from a dip.
This signal was generated automatically from technical indicators. It does not guarantee profit and is not investment advice. Always manage your own risk and DYOR.
$ZEC
#BTCFallsBelow$83000 #BitcoinSpotETFs$2.39BWeeklyNetInflow
162
🚨 Major shake-up in the market! With #BTCFallsBelow$83000, it’s time to assess if this dip is a buying opportunity or a sign of deeper corrections. With gainers like #QNT and soaring, where do you see the market heading next? 🤔💰
$BTC
🔔 Follow us for daily crypto insights — más viene en camino!
🚨 Major shake-up in the market! With #BTCFallsBelow$83000, it’s time to assess if this dip is a buying opportunity or a sign of deeper corrections. With gainers like #QNT and soaring, where do you see the market heading next? 🤔💰
$BTC
🔔 Follow us for daily crypto insights — más viene en camino!
$BTC
🔔 Follow us for daily crypto insights — más viene en camino!
92

#BTCFallsBelow only for you opportunity because $BTC pumps here strongly in next towards 100000$🎁🎁
$ETH
$BNB
#BTCFallsBelow only for you opportunity because $BTC pumps here strongly in next towards 100000$🎁🎁
$ETH
$BNB
$ETH
$BNB
28
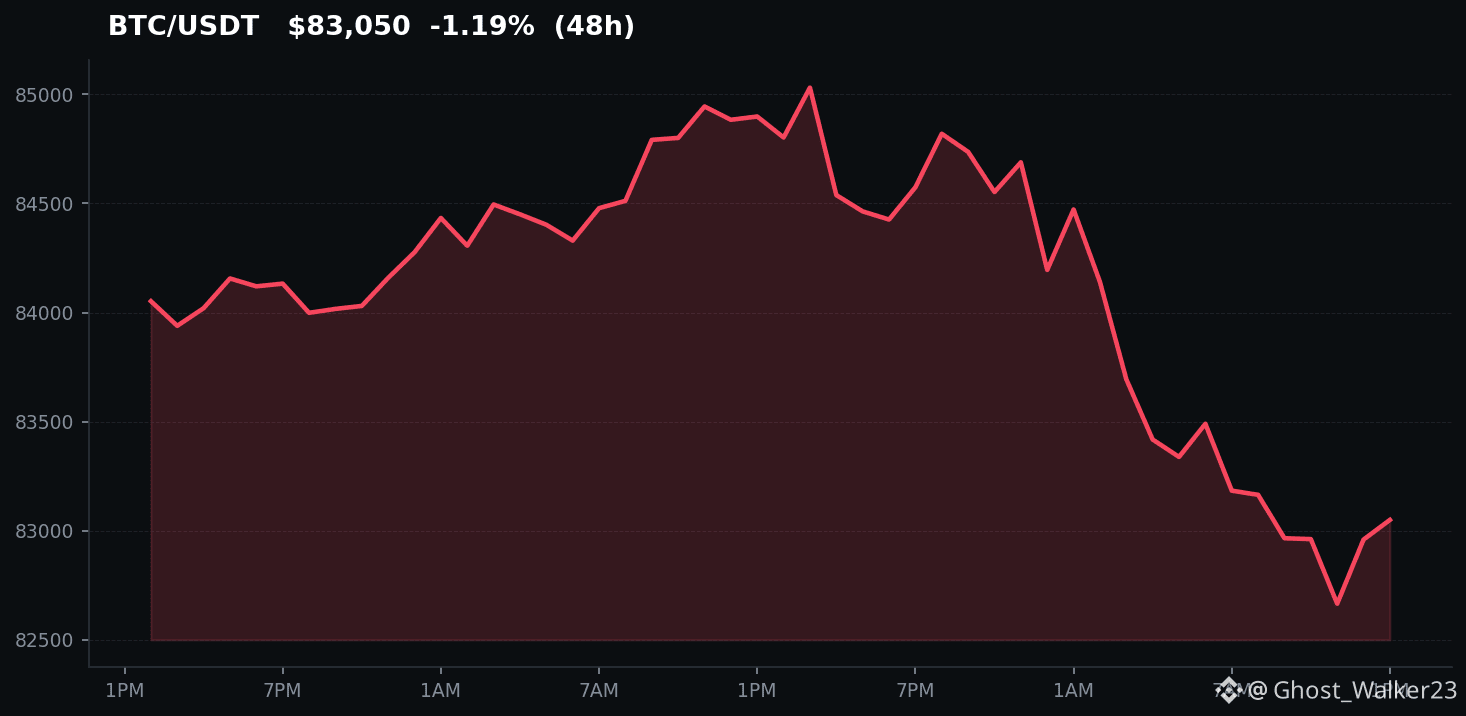
🚨 #BTCFallsBelow$83000 as Bitcoin trades at $83,029.16, down 2.16%. Meanwhile, $QNT surges 34.7%!
Can Quant maintain this momentum?
Comparing its potential with $ETH which has fallen 1.88% to $2,659.18.
As you can see below, which coin do you believe has more room to grow? 📈👇
🔔 Follow us for daily crypto insights — more is on the way!
🚨 #BTCFallsBelow$83000 as Bitcoin trades at $83,029.16, down 2.16%. Meanwhile, $QNT surges 34.7%!
Can Quant maintain this momentum?
Comparing its potential with $ETH which has fallen 1.88% to $2,659.18.
As you can see below, which coin do you believe has more room to grow? 📈👇
🔔 Follow us for daily crypto insights — more is on the way!
Can Quant maintain this momentum?
Comparing its potential with $ETH which has fallen 1.88% to $2,659.18.
As you can see below, which coin do you believe has more room to grow? 📈👇
🔔 Follow us for daily crypto insights — more is on the way!
53
Log in to explore more content
Join global crypto users on Binance Square
⚡️ Get latest and useful information about crypto.
💬 Trusted by the world’s largest crypto exchange.
👍 Discover real insights from verified creators.
Email / Phone number
Trending Topics
1
#UKFCAWinsCourtOrderToRecover851400Pounds
398 views
96 Discussing
2
#ChainlinkLaunchesCCIP2WithEnterpriseVerification
7,895 views
408 Discussing
3
#GoldFallsTo$4144
4,169 views
101 Discussing
4
#QNTFallsOver40%FromMorningHigh
33,989 views
814 Discussing
5
#USDTAdds845900HoldersInPast7Days
1,112 views
100 Discussing
6
#KospiFalls2.7%SamsungSKHynixDropOver5%
7,000 views
370 Discussing
7
#BitgetCEOConfirms$388MStolenInHack
2,827 views
37 Discussing
8
#BTCFallsBelow$83000
16,965 views
139 Discussing
9
#BitgetDetailsSecurityIncidentTimeline
19,352 views
530 Discussing
10
#BitcoinSpotETFs$2.39BWeeklyNetInflow
7,205 views
34 Discussing