

#41
41
19,973 views
95 Discussing
Hot
Latest

·
--
$PUMP at this level makes me a little cautious, but caution isn’t the same as being bearish—the key question is how much of this 57% monthly gain is backed by real liquidity, and how much is just churn.
First, consider the conflicting signals. It’s up 57.62% over 30 days, and momentum is still holding at 26.25% over 7 days, but over the past 24 hours it’s pulled back to -0.88% and fallen below the day’s high. More importantly, look at volume: trading volume surged to around $515M on September 29 and 30, but it’s now at $235M. The price hasn’t fallen much, but the fuel is visibly running low. At $0.0063, neither bulls nor bears have dared to make a decisive move with volume behind them.
The market has only two likely scenarios from here: either volume picks up again over the next few days, with fresh money continuing to ride the trend and challenge the remaining 28% gap to the ATH; or it drifts lower on declining volume, falling below $0.0053 and turning that 40% monthly gain into a bull trap. Personally, I’m more interested in whether $0.0058 can hold than in guessing “whether it can go any higher”—that’s what’s worth watching.
The risks are clear, too: for an asset with a market cap of #41 , just over $200M in daily volume is still fairly active. But the decline in trading volume over the past three days is a fact. If it later drops below $0.005 and volume doubles, my thesis is invalidated—I’m not taking sides, just watching what the market does.
$PUMP at this level makes me a little cautious, but caution isn’t the same as being bearish—the key question is how much of this 57% monthly gain is backed by real liquidity, and how much is just churn.
First, consider the conflicting signals. It’s up 57.62% over 30 days, and momentum is still holding at 26.25% over 7 days, but over the past 24 hours it’s pulled back to -0.88% and fallen below the day’s high. More importantly, look at volume: trading volume surged to around $515M on September 29 and 30, but it’s now at $235M. The price hasn’t fallen much, but the fuel is visibly running low. At $0.0063, neither bulls nor bears have dared to make a decisive move with volume behind them.
The market has only two likely scenarios from here: either volume picks up again over the next few days, with fresh money continuing to ride the trend and challenge the remaining 28% gap to the ATH; or it drifts lower on declining volume, falling below $0.0053 and turning that 40% monthly gain into a bull trap. Personally, I’m more interested in whether $0.0058 can hold than in guessing “whether it can go any higher”—that’s what’s worth watching.
The risks are clear, too: for an asset with a market cap of #41 , just over $200M in daily volume is still fairly active. But the decline in trading volume over the past three days is a fact. If it later drops below $0.005 and volume doubles, my thesis is invalidated—I’m not taking sides, just watching what the market does.
First, consider the conflicting signals. It’s up 57.62% over 30 days, and momentum is still holding at 26.25% over 7 days, but over the past 24 hours it’s pulled back to -0.88% and fallen below the day’s high. More importantly, look at volume: trading volume surged to around $515M on September 29 and 30, but it’s now at $235M. The price hasn’t fallen much, but the fuel is visibly running low. At $0.0063, neither bulls nor bears have dared to make a decisive move with volume behind them.
The market has only two likely scenarios from here: either volume picks up again over the next few days, with fresh money continuing to ride the trend and challenge the remaining 28% gap to the ATH; or it drifts lower on declining volume, falling below $0.0053 and turning that 40% monthly gain into a bull trap. Personally, I’m more interested in whether $0.0058 can hold than in guessing “whether it can go any higher”—that’s what’s worth watching.
The risks are clear, too: for an asset with a market cap of #41 , just over $200M in daily volume is still fairly active. But the decline in trading volume over the past three days is a fact. If it later drops below $0.005 and volume doubles, my thesis is invalidated—I’m not taking sides, just watching what the market does.
7

·
--
Over the past 24 hours the Binance Square radar spotted a fresh wave of movers on CoinGecko. Here’s what caught our eye: Lighter (LIT) +12.4 %, Pudgy Penguins (PENGU) +9.8 %, Quant (QNT) +7.1 %, Backpack (BP) +5.6 % 🚀. These tokens are climbing fast and could shape the next market swing.
Meanwhile NEAR Protocol (NEAR) surged +14.2 % to sit at rank 21, while Pump.fun (PUMP) rallied +11.0 % holding the #41 spot. Grass (GRASS) added +8.3 % despite a #110 ranking, showing depth beyond the top‑50. We’re seeing a blend of established projects and newer community‑driven gems gaining traction, a pattern that often precedes broader rallies. Our community’s sentiment metrics also turned bullish, with social mentions up 22 % across Discord and Twitter.
With these moves, we recommend keeping an eye on the upside potential while managing risk. Diversify across the highlighted assets, set realistic stop‑losses, and stay tuned to on‑chain signals. As always, our tools and alerts are here to help you navigate the volatility and capture opportunities 🚦. Happy trading, and let’s ride the next wave together!
$MOVR, $QNT, $SOON
Over the past 24 hours the Binance Square radar spotted a fresh wave of movers on CoinGecko. Here’s what caught our eye: Lighter (LIT) +12.4 %, Pudgy Penguins (PENGU) +9.8 %, Quant (QNT) +7.1 %, Backpack (BP) +5.6 % 🚀. These tokens are climbing fast and could shape the next market swing.
Meanwhile NEAR Protocol (NEAR) surged +14.2 % to sit at rank 21, while Pump.fun (PUMP) rallied +11.0 % holding the #41 spot. Grass (GRASS) added +8.3 % despite a #110 ranking, showing depth beyond the top‑50. We’re seeing a blend of established projects and newer community‑driven gems gaining traction, a pattern that often precedes broader rallies. Our community’s sentiment metrics also turned bullish, with social mentions up 22 % across Discord and Twitter.
With these moves, we recommend keeping an eye on the upside potential while managing risk. Diversify across the highlighted assets, set realistic stop‑losses, and stay tuned to on‑chain signals. As always, our tools and alerts are here to help you navigate the volatility and capture opportunities 🚦. Happy trading, and let’s ride the next wave together!
$MOVR , $QNT , $SOON
Meanwhile NEAR Protocol (NEAR) surged +14.2 % to sit at rank 21, while Pump.fun (PUMP) rallied +11.0 % holding the #41 spot. Grass (GRASS) added +8.3 % despite a #110 ranking, showing depth beyond the top‑50. We’re seeing a blend of established projects and newer community‑driven gems gaining traction, a pattern that often precedes broader rallies. Our community’s sentiment metrics also turned bullish, with social mentions up 22 % across Discord and Twitter.
With these moves, we recommend keeping an eye on the upside potential while managing risk. Diversify across the highlighted assets, set realistic stop‑losses, and stay tuned to on‑chain signals. As always, our tools and alerts are here to help you navigate the volatility and capture opportunities 🚦. Happy trading, and let’s ride the next wave together!
$MOVR , $QNT , $SOON
474

·
--
Growing 2.5%—But Why Should You Sell 'Now?Aave (AAVEUSDT) is trending right now!
Rank: #41
Shocking truth: While it rose 2.49% yesterday, the price is still “winking.” On the morning of 2026‑09‑29, it reached the $2,732.22 level; the 24-hour volume is $805.75M—this is the biggest liquidity inflow of the week! 🚀 So, does this mean Bitcoin is “turning its back”? My counterview is clear: Most traders say they’re in the “down,” but instead of “a drop,” I see an “unusual consolidation.” The price stays below the 30-day average on one hand, while at the same time the support level’s 7,000‑8,000 band still holds a strong pool of buyers. So, instead of expecting a “pump,” it might be smart to observe with a “re-buy” strategy rather than a “short.” On the other hand, there’s a real “alpha” opportunity in the altcoin space. AVAX (AVAXUSDT) jumped to the $11.957 level with +14.148% in 24 hours; volume is $91.96M and the number of trades is 797k. This doesn’t look like a “pump-and-dump” scheme—the price is moving in a tight channel between $10.145 and $11.964. Low volatility, high volume, and a clear “buy-the-dip” signal: Personally, I’m considering opening a 10-15% DCA (Dollar-Cost-Average) plan on AVAX. Another move to consider is LINK (LINKUSDT), up +9.027% to $15.339; daily volume is $148.56M, providing solid liquidity inflow. Chainlink’s data oracles are still the backbone of the DeFi ecosystem, creating an attractive foundation for a long-term “hold-and-earn” strategy. Counterview: Some analysts are looking at the “muted” performance of NEAR and LTC and are avoiding risk
Growing 2.5%—But Why Should You Sell 'Now?
Aave (AAVEUSDT) is trending right now!
Rank: #41
Shocking truth: While it rose 2.49% yesterday, the price is still “winking.” On the morning of 2026‑09‑29, it reached the $2,732.22 level; the 24-hour volume is $805.75M—this is the biggest liquidity inflow of the week! 🚀 So, does this mean Bitcoin is “turning its back”? My counterview is clear: Most traders say they’re in the “down,” but instead of “a drop,” I see an “unusual consolidation.” The price stays below the 30-day average on one hand, while at the same time the support level’s 7,000‑8,000 band still holds a strong pool of buyers. So, instead of expecting a “pump,” it might be smart to observe with a “re-buy” strategy rather than a “short.” On the other hand, there’s a real “alpha” opportunity in the altcoin space. AVAX (AVAXUSDT) jumped to the $11.957 level with +14.148% in 24 hours; volume is $91.96M and the number of trades is 797k. This doesn’t look like a “pump-and-dump” scheme—the price is moving in a tight channel between $10.145 and $11.964. Low volatility, high volume, and a clear “buy-the-dip” signal: Personally, I’m considering opening a 10-15% DCA (Dollar-Cost-Average) plan on AVAX. Another move to consider is LINK (LINKUSDT), up +9.027% to $15.339; daily volume is $148.56M, providing solid liquidity inflow. Chainlink’s data oracles are still the backbone of the DeFi ecosystem, creating an attractive foundation for a long-term “hold-and-earn” strategy. Counterview: Some analysts are looking at the “muted” performance of NEAR and LTC and are avoiding risk
Rank: #41
Shocking truth: While it rose 2.49% yesterday, the price is still “winking.” On the morning of 2026‑09‑29, it reached the $2,732.22 level; the 24-hour volume is $805.75M—this is the biggest liquidity inflow of the week! 🚀 So, does this mean Bitcoin is “turning its back”? My counterview is clear: Most traders say they’re in the “down,” but instead of “a drop,” I see an “unusual consolidation.” The price stays below the 30-day average on one hand, while at the same time the support level’s 7,000‑8,000 band still holds a strong pool of buyers. So, instead of expecting a “pump,” it might be smart to observe with a “re-buy” strategy rather than a “short.” On the other hand, there’s a real “alpha” opportunity in the altcoin space. AVAX (AVAXUSDT) jumped to the $11.957 level with +14.148% in 24 hours; volume is $91.96M and the number of trades is 797k. This doesn’t look like a “pump-and-dump” scheme—the price is moving in a tight channel between $10.145 and $11.964. Low volatility, high volume, and a clear “buy-the-dip” signal: Personally, I’m considering opening a 10-15% DCA (Dollar-Cost-Average) plan on AVAX. Another move to consider is LINK (LINKUSDT), up +9.027% to $15.339; daily volume is $148.56M, providing solid liquidity inflow. Chainlink’s data oracles are still the backbone of the DeFi ecosystem, creating an attractive foundation for a long-term “hold-and-earn” strategy. Counterview: Some analysts are looking at the “muted” performance of NEAR and LTC and are avoiding risk
16
·
--
$ONDO is still 75.5% away from ATH 2.14, but it has risen 47% over the past 30 days. Put these two numbers together, and they create two different psychological anchors: one feels there’s three-quarters of a downside cushion overhead, and that any rebound is just a deep-bear repair; the other sees expanding volume at the bottom and an upward trend, and then waits—only to risk missing the main upswing.
What actually happened on the chart was the high-volume candle on September 25: the price jumped from 0.41 to 0.52, with volume surging to 1.06B—about four or five times the prior average daily volume. After that, it didn’t turn down; instead, volume tapered off and it traded sideways around 0.52–0.55. This suggests there’s capital willing to step in, but no rush to push it higher. Market cap #41, daily volume 585M, and turnover isn’t low—shares are changing hands quickly rather than being locked in and waiting for a rally.
The risk lies in the trapped supply above the ATH. A one-year -40.8% indicates that medium-to-long-term holders haven’t fully exited their losses. If volume can’t be sustained, the sideways range becomes a distribution window.
The disagreement is very specific: wait for a pullback and confirmation at 0.46–0.48, or take on some uncertainty early at 0.52? The former waits for a steadier entry; the latter bets it won’t break down. I lean toward treating 0.46 as the line to watch for bulls vs. bears—if it breaks, this whole logic needs to be re-examined.
$ONDO is still 75.5% away from ATH 2.14, but it has risen 47% over the past 30 days. Put these two numbers together, and they create two different psychological anchors: one feels there’s three-quarters of a downside cushion overhead, and that any rebound is just a deep-bear repair; the other sees expanding volume at the bottom and an upward trend, and then waits—only to risk missing the main upswing.
What actually happened on the chart was the high-volume candle on September 25: the price jumped from 0.41 to 0.52, with volume surging to 1.06B—about four or five times the prior average daily volume. After that, it didn’t turn down; instead, volume tapered off and it traded sideways around 0.52–0.55. This suggests there’s capital willing to step in, but no rush to push it higher. Market cap #41, daily volume 585M, and turnover isn’t low—shares are changing hands quickly rather than being locked in and waiting for a rally.
The risk lies in the trapped supply above the ATH. A one-year -40.8% indicates that medium-to-long-term holders haven’t fully exited their losses. If volume can’t be sustained, the sideways range becomes a distribution window.
The disagreement is very specific: wait for a pullback and confirmation at 0.46–0.48, or take on some uncertainty early at 0.52? The former waits for a steadier entry; the latter bets it won’t break down. I lean toward treating 0.46 as the line to watch for bulls vs. bears—if it breaks, this whole logic needs to be re-examined.
What actually happened on the chart was the high-volume candle on September 25: the price jumped from 0.41 to 0.52, with volume surging to 1.06B—about four or five times the prior average daily volume. After that, it didn’t turn down; instead, volume tapered off and it traded sideways around 0.52–0.55. This suggests there’s capital willing to step in, but no rush to push it higher. Market cap #41, daily volume 585M, and turnover isn’t low—shares are changing hands quickly rather than being locked in and waiting for a rally.
The risk lies in the trapped supply above the ATH. A one-year -40.8% indicates that medium-to-long-term holders haven’t fully exited their losses. If volume can’t be sustained, the sideways range becomes a distribution window.
The disagreement is very specific: wait for a pullback and confirmation at 0.46–0.48, or take on some uncertainty early at 0.52? The former waits for a steadier entry; the latter bets it won’t break down. I lean toward treating 0.46 as the line to watch for bulls vs. bears—if it breaks, this whole logic needs to be re-examined.
36

·
--
Attention! PUMP surged straight up by 1.7% at an important time point—where to look for a pullback entry?00:09 (just now) PUMP saw a surge of 1.7% at an important time point. As of 00:10:25, the current price is 0.005147, with +5.6% over the past 24h.
📅 Data as of 00:10:25 (the event trigger time is indicated in each item; prices are real-time snapshots at the time of writing)
📌 One-sentence takeaway: During important windows (K-line close/U.S. market open/close), the anomalies that occur often involve institutional participation, making the signals more credible
Market overview: BTC 83,335.40 (-1.43%) · ETH 2,675.08 (-0.65%); across the whole market, 41 up and 452 down over the past 24h; top gainer over the past 24h: HBAR +33.81%, top decliner: Lobster -28.60%.
—— Event Details ——
Attention! PUMP surged straight up by 1.7% at an important time point—where to look for a pullback entry?
00:09 (just now) PUMP saw a surge of 1.7% at an important time point. As of 00:10:25, the current price is 0.005147, with +5.6% over the past 24h.
📅 Data as of 00:10:25 (the event trigger time is indicated in each item; prices are real-time snapshots at the time of writing)
📌 One-sentence takeaway: During important windows (K-line close/U.S. market open/close), the anomalies that occur often involve institutional participation, making the signals more credible
Market overview: BTC 83,335.40 (-1.43%) · ETH 2,675.08 (-0.65%); across the whole market, 41 up and 452 down over the past 24h; top gainer over the past 24h: HBAR +33.81%, top decliner: Lobster -28.60%.
—— Event Details ——
📅 Data as of 00:10:25 (the event trigger time is indicated in each item; prices are real-time snapshots at the time of writing)
📌 One-sentence takeaway: During important windows (K-line close/U.S. market open/close), the anomalies that occur often involve institutional participation, making the signals more credible
Market overview: BTC 83,335.40 (-1.43%) · ETH 2,675.08 (-0.65%); across the whole market, 41 up and 452 down over the past 24h; top gainer over the past 24h: HBAR +33.81%, top decliner: Lobster -28.60%.
—— Event Details ——
1

Article
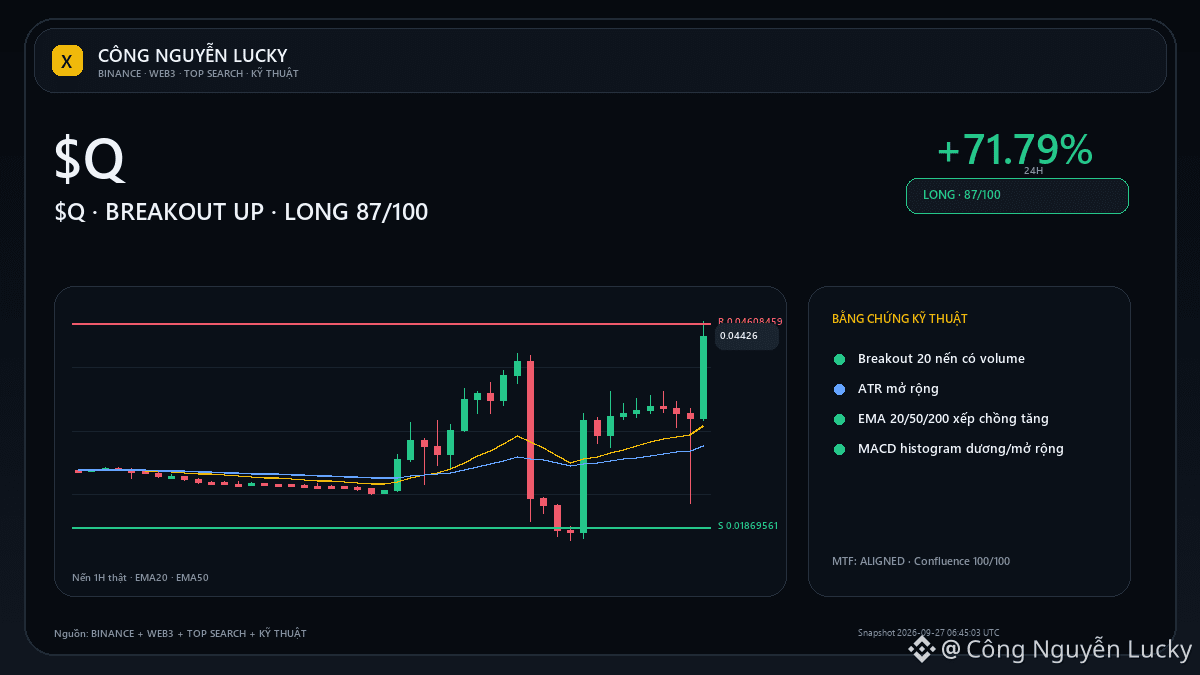
$Q: ATR expanding — volatility is changing regime🚨 $Q is currently in BREAKOUT UP — real breakout or a breakout that’s prone to being pulled back? Market: 0.043282 · 24h +71.79% · volume ~367.3M USDT · 6,304,976 trades.
ATR14 12.23% price · Bollinger width 84.56% · BREAKOUT UP status. Technical bias LONG 100/100. When ATR expands, I prefer waiting for confirmation at 0.01869561/0.04608459 instead of chasing candles. The technical layers being selected are based on the regime:
1H status: BREAKOUT UP · technical bias LONG 100/100 · 1H/4H: CONFLUENCE.
$Q: ATR expanding — volatility is changing regime
🚨 $Q is currently in BREAKOUT UP — real breakout or a breakout that’s prone to being pulled back? Market: 0.043282 · 24h +71.79% · volume ~367.3M USDT · 6,304,976 trades.
ATR14 12.23% price · Bollinger width 84.56% · BREAKOUT UP status. Technical bias LONG 100/100. When ATR expands, I prefer waiting for confirmation at 0.01869561/0.04608459 instead of chasing candles. The technical layers being selected are based on the regime:
1H status: BREAKOUT UP · technical bias LONG 100/100 · 1H/4H: CONFLUENCE.
ATR14 12.23% price · Bollinger width 84.56% · BREAKOUT UP status. Technical bias LONG 100/100. When ATR expands, I prefer waiting for confirmation at 0.01869561/0.04608459 instead of chasing candles. The technical layers being selected are based on the regime:
1H status: BREAKOUT UP · technical bias LONG 100/100 · 1H/4H: CONFLUENCE.
127
·
--
** “%6.5 NEAR Surge—Why I Ignore the Calm in ‘ ’ and ‘?’”Ondo (ONDOUSDT) is trending right now!
Rank: #41
** Shock? It rose **%6.558** in a single day, but Bitcoin and Ethereum are still taking a “slow” breath. Is this just a “random wave,” or an opportunity smart traders are catching? From my perspective, this move is only the beginning. **Top Movers at a Glance** - **NEARUSDT**: .972 – **+6.558 %** in 24 hours, trading volume **59.6 M**. Opening price .666, high .211, low .439. This volatility is a short-term **pump** signal. - **SOLUSDT**: 22.06 – **+4.014 %**, volume **80.5 M**. Solana’s Layer‑2 solutions and new NFT game integrations are supporting the price. - **LINKUSDT** and **UNIUSDT**: **+5.241 %** and **+5.032 %**, respectively. Oracles and DeFi liquidity providers are still in the growth phase; smart money inflow is keeping these tokens “in the queue.” - **DOTUSDT** and **ADAUSDT**: **+4.573 %** / **+3.696 %**. Polkadot’s parachain slots and Cardano’s Hydra update are feeding prices. **Why I Keep Seeing the “Stillness” in ‘ ’ and ‘?’** Bitcoin (BTC) and Ethereum (ETH) showed **/bin/sh.0%** change overnight. Liquidity is shifting largely toward a “stablecoin‑pivot”; traders are rotating into altcoins offering higher potential returns. In my view, this “calm” is a temporary equilibrium—an exhale right before a big “sell‑the‑news” wave. **Alpha Call** - **NEAR**: It’s moving toward the **.20** level within 24 hours. I recommend **DCA** and “ape in” in the **.10‑5.25** range. - **SOL**: Volume explosion and new sta
** “%6.5 NEAR Surge—Why I Ignore the Calm in ‘ ’ and ‘?’”
Ondo (ONDOUSDT) is trending right now!
Rank: #41
** Shock? It rose **%6.558** in a single day, but Bitcoin and Ethereum are still taking a “slow” breath. Is this just a “random wave,” or an opportunity smart traders are catching? From my perspective, this move is only the beginning. **Top Movers at a Glance** - **NEARUSDT**: .972 – **+6.558 %** in 24 hours, trading volume **59.6 M**. Opening price .666, high .211, low .439. This volatility is a short-term **pump** signal. - **SOLUSDT**: 22.06 – **+4.014 %**, volume **80.5 M**. Solana’s Layer‑2 solutions and new NFT game integrations are supporting the price. - **LINKUSDT** and **UNIUSDT**: **+5.241 %** and **+5.032 %**, respectively. Oracles and DeFi liquidity providers are still in the growth phase; smart money inflow is keeping these tokens “in the queue.” - **DOTUSDT** and **ADAUSDT**: **+4.573 %** / **+3.696 %**. Polkadot’s parachain slots and Cardano’s Hydra update are feeding prices. **Why I Keep Seeing the “Stillness” in ‘ ’ and ‘?’** Bitcoin (BTC) and Ethereum (ETH) showed **/bin/sh.0%** change overnight. Liquidity is shifting largely toward a “stablecoin‑pivot”; traders are rotating into altcoins offering higher potential returns. In my view, this “calm” is a temporary equilibrium—an exhale right before a big “sell‑the‑news” wave. **Alpha Call** - **NEAR**: It’s moving toward the **.20** level within 24 hours. I recommend **DCA** and “ape in” in the **.10‑5.25** range. - **SOL**: Volume explosion and new sta
Rank: #41
** Shock? It rose **%6.558** in a single day, but Bitcoin and Ethereum are still taking a “slow” breath. Is this just a “random wave,” or an opportunity smart traders are catching? From my perspective, this move is only the beginning. **Top Movers at a Glance** - **NEARUSDT**: .972 – **+6.558 %** in 24 hours, trading volume **59.6 M**. Opening price .666, high .211, low .439. This volatility is a short-term **pump** signal. - **SOLUSDT**: 22.06 – **+4.014 %**, volume **80.5 M**. Solana’s Layer‑2 solutions and new NFT game integrations are supporting the price. - **LINKUSDT** and **UNIUSDT**: **+5.241 %** and **+5.032 %**, respectively. Oracles and DeFi liquidity providers are still in the growth phase; smart money inflow is keeping these tokens “in the queue.” - **DOTUSDT** and **ADAUSDT**: **+4.573 %** / **+3.696 %**. Polkadot’s parachain slots and Cardano’s Hydra update are feeding prices. **Why I Keep Seeing the “Stillness” in ‘ ’ and ‘?’** Bitcoin (BTC) and Ethereum (ETH) showed **/bin/sh.0%** change overnight. Liquidity is shifting largely toward a “stablecoin‑pivot”; traders are rotating into altcoins offering higher potential returns. In my view, this “calm” is a temporary equilibrium—an exhale right before a big “sell‑the‑news” wave. **Alpha Call** - **NEAR**: It’s moving toward the **.20** level within 24 hours. I recommend **DCA** and “ape in” in the **.10‑5.25** range. - **SOL**: Volume explosion and new sta
85
·
--
$ENA This move has already moved beyond the realm of a typical oversold rebound. From Aug 27 at $0.147 to now $0.267—over 30 days it’s surged nearly 90%. And the 7-day gain has accelerated to 57%, which is a textbook phase after a bottom breakout with volume expansion, when capital is stepping in more aggressively. In the past 24 hours, trading volume reached $1.05B—up nearly sevenfold from the roughly $150M level seen on a single day in mid-September. Market cap rank is #41. If the volume isn’t just a one-day spike, then at this position it already has the credentials to compete for attention with front-row assets in the mainstream DeFi sector.
More directly in one sentence: today’s daily candle broke through all rebound highs since August, and the price also reclaimed the $0.26 range. The key is that it did so with $1.05B of volume. Those earlier “huge-volume” days in early September—$1.8B and $1.6B—failed to produce a breakout because the direction was still downward. Now the direction has flipped, and with the same volume level, it carries a completely different implication. From a holder’s perspective, after +57% over 7 days, the concern of late buyers isn’t whether $0.26 can hold—it’s whether they should bet on a sustained logic at a point still 82% below ATH, rather than betting that sentiment will stay euphoric for a few more days.
The real question right now isn’t whether $ENA will pull back, but whether this volume expansion is actually re-pricing improvements in its own protocol fundamentals—or whether, under a broader recovery in risk appetite for the entire sector, it just received an oversold revaluation. In the first case, support lies above $0.24. In the second case, once liquidity tightens, the chart will quickly revert toward around $0.2 to find equilibrium. At this stage, no one can know the answer in advance. Volume and price by themselves don’t provide certainty; we can only wait for the next two or three days’ trading structure to confirm direction.
$ENA This move has already moved beyond the realm of a typical oversold rebound. From Aug 27 at $0.147 to now $0.267—over 30 days it’s surged nearly 90%. And the 7-day gain has accelerated to 57%, which is a textbook phase after a bottom breakout with volume expansion, when capital is stepping in more aggressively. In the past 24 hours, trading volume reached $1.05B—up nearly sevenfold from the roughly $150M level seen on a single day in mid-September. Market cap rank is #41. If the volume isn’t just a one-day spike, then at this position it already has the credentials to compete for attention with front-row assets in the mainstream DeFi sector.
More directly in one sentence: today’s daily candle broke through all rebound highs since August, and the price also reclaimed the $0.26 range. The key is that it did so with $1.05B of volume. Those earlier “huge-volume” days in early September—$1.8B and $1.6B—failed to produce a breakout because the direction was still downward. Now the direction has flipped, and with the same volume level, it carries a completely different implication. From a holder’s perspective, after +57% over 7 days, the concern of late buyers isn’t whether $0.26 can hold—it’s whether they should bet on a sustained logic at a point still 82% below ATH, rather than betting that sentiment will stay euphoric for a few more days.
The real question right now isn’t whether $ENA will pull back, but whether this volume expansion is actually re-pricing improvements in its own protocol fundamentals—or whether, under a broader recovery in risk appetite for the entire sector, it just received an oversold revaluation. In the first case, support lies above $0.24. In the second case, once liquidity tightens, the chart will quickly revert toward around $0.2 to find equilibrium. At this stage, no one can know the answer in advance. Volume and price by themselves don’t provide certainty; we can only wait for the next two or three days’ trading structure to confirm direction.
More directly in one sentence: today’s daily candle broke through all rebound highs since August, and the price also reclaimed the $0.26 range. The key is that it did so with $1.05B of volume. Those earlier “huge-volume” days in early September—$1.8B and $1.6B—failed to produce a breakout because the direction was still downward. Now the direction has flipped, and with the same volume level, it carries a completely different implication. From a holder’s perspective, after +57% over 7 days, the concern of late buyers isn’t whether $0.26 can hold—it’s whether they should bet on a sustained logic at a point still 82% below ATH, rather than betting that sentiment will stay euphoric for a few more days.
The real question right now isn’t whether $ENA will pull back, but whether this volume expansion is actually re-pricing improvements in its own protocol fundamentals—or whether, under a broader recovery in risk appetite for the entire sector, it just received an oversold revaluation. In the first case, support lies above $0.24. In the second case, once liquidity tightens, the chart will quickly revert toward around $0.2 to find equilibrium. At this stage, no one can know the answer in advance. Volume and price by themselves don’t provide certainty; we can only wait for the next two or three days’ trading structure to confirm direction.
377
·
--
** 🔍 How to Read Line Charts in Technical Analysis? 📊Ethena (ENAUSDT) is trending right now!
Rank: #41
** Hello crypto traders! 👋 Today, we’ll explain step by step how to read line charts in technical analysis. This guide is designed for beginners and intermediate users. 📚 **Step 1: What Is a Line Chart? 🤔** A line chart is a type of chart that shows how an asset’s price changes over time. In the crypto market, it’s used to analyze the price movements of assets such as and . 📊 **Step 2: Chart Types 📈** There are two main chart types: * **Line Chart**: Shows the asset’s closing prices by connecting them. * **Candlestick Chart**: Shows the asset’s opening, closing, high, and low prices. **Step 3: Defining Trends on a Line Chart 📊** To identify trends on a line chart, pay attention to the following points: * **Uptrends**: Trends where the price keeps rising. 📈 * **Downtrends**: Trends where the price keeps falling. 📉 * **Sideways/Flat Trends**: Trends where the price moves within a certain range. 📊 **Step 4: Support and Resistance Points 📍** Support and resistance points play an important role in price movement: * **Support Points**: Levels that prevent the price from falling. 🤝 * **Resistance Points**: Levels that prevent the price from rising. 🚫 **Example:** Right now, is at the $83,833.44 level. It showed a change of -0.71% over the last 24 hours. 📊 **Practical Application:** 1. On Binance Square, 's line g
** 🔍 How to Read Line Charts in Technical Analysis? 📊
Ethena (ENAUSDT) is trending right now!
Rank: #41
** Hello crypto traders! 👋 Today, we’ll explain step by step how to read line charts in technical analysis. This guide is designed for beginners and intermediate users. 📚 **Step 1: What Is a Line Chart? 🤔** A line chart is a type of chart that shows how an asset’s price changes over time. In the crypto market, it’s used to analyze the price movements of assets such as and . 📊 **Step 2: Chart Types 📈** There are two main chart types: * **Line Chart**: Shows the asset’s closing prices by connecting them. * **Candlestick Chart**: Shows the asset’s opening, closing, high, and low prices. **Step 3: Defining Trends on a Line Chart 📊** To identify trends on a line chart, pay attention to the following points: * **Uptrends**: Trends where the price keeps rising. 📈 * **Downtrends**: Trends where the price keeps falling. 📉 * **Sideways/Flat Trends**: Trends where the price moves within a certain range. 📊 **Step 4: Support and Resistance Points 📍** Support and resistance points play an important role in price movement: * **Support Points**: Levels that prevent the price from falling. 🤝 * **Resistance Points**: Levels that prevent the price from rising. 🚫 **Example:** Right now, is at the $83,833.44 level. It showed a change of -0.71% over the last 24 hours. 📊 **Practical Application:** 1. On Binance Square, 's line g
Rank: #41
** Hello crypto traders! 👋 Today, we’ll explain step by step how to read line charts in technical analysis. This guide is designed for beginners and intermediate users. 📚 **Step 1: What Is a Line Chart? 🤔** A line chart is a type of chart that shows how an asset’s price changes over time. In the crypto market, it’s used to analyze the price movements of assets such as and . 📊 **Step 2: Chart Types 📈** There are two main chart types: * **Line Chart**: Shows the asset’s closing prices by connecting them. * **Candlestick Chart**: Shows the asset’s opening, closing, high, and low prices. **Step 3: Defining Trends on a Line Chart 📊** To identify trends on a line chart, pay attention to the following points: * **Uptrends**: Trends where the price keeps rising. 📈 * **Downtrends**: Trends where the price keeps falling. 📉 * **Sideways/Flat Trends**: Trends where the price moves within a certain range. 📊 **Step 4: Support and Resistance Points 📍** Support and resistance points play an important role in price movement: * **Support Points**: Levels that prevent the price from falling. 🤝 * **Resistance Points**: Levels that prevent the price from rising. 🚫 **Example:** Right now, is at the $83,833.44 level. It showed a change of -0.71% over the last 24 hours. 📊 **Practical Application:** 1. On Binance Square, 's line g
26
·
--
$ONDO saw $1.26B in trading in one day—$2.67B in market cap. In half a day, it basically swapped out its entire float. When an asset with market cap #41 turns over like this, it’s even more worth stopping to watch than that +19.84% green candle.
The price path doesn’t look like a gradual grind either. For the first twenty days before September, it kept ranging at $0.33–$0.37, with volume swinging between $50M and $110M. On the 18th it was pushed above the $230M level, and on the 25th it jumped straight into the $1B bracket. Down 38.57% over the year, and 74.4% below ATH. Its current identity is “RWA beta yanked up from a deep pit”—not an all-time-high narrative.
I don’t rule out either of the two explanations. One is that real money priced it early: as long as there’s meaningful progress on the compliance side, the narrative around tokenized treasuries can run. $ONDO is a rare shell that can accommodate institutional-sized liquidity, and #41 ’s rank is big enough without being too cumbersome. The confirmation signal is that during a pullback, volume doesn’t collapse—price holds above $0.45—and spot trading is leading.
The other is a one-day repricing driven by leverage squeeze. If most of the $1.26B is contracts and the funding rate turns positive and longs get crowded, the give-back is often just as fast. The invalidation signal is straightforward: volume drops back below $300M, and it loses $0.45.
You can bet on whichever script you like, but first answer one question: on September 25th, is $ONDO the beginning—or the climax?
$ONDO saw $1.26B in trading in one day—$2.67B in market cap. In half a day, it basically swapped out its entire float. When an asset with market cap #41 turns over like this, it’s even more worth stopping to watch than that +19.84% green candle.
The price path doesn’t look like a gradual grind either. For the first twenty days before September, it kept ranging at $0.33–$0.37, with volume swinging between $50M and $110M. On the 18th it was pushed above the $230M level, and on the 25th it jumped straight into the $1B bracket. Down 38.57% over the year, and 74.4% below ATH. Its current identity is “RWA beta yanked up from a deep pit”—not an all-time-high narrative.
I don’t rule out either of the two explanations. One is that real money priced it early: as long as there’s meaningful progress on the compliance side, the narrative around tokenized treasuries can run. $ONDO is a rare shell that can accommodate institutional-sized liquidity, and #41 ’s rank is big enough without being too cumbersome. The confirmation signal is that during a pullback, volume doesn’t collapse—price holds above $0.45—and spot trading is leading.
The other is a one-day repricing driven by leverage squeeze. If most of the $1.26B is contracts and the funding rate turns positive and longs get crowded, the give-back is often just as fast. The invalidation signal is straightforward: volume drops back below $300M, and it loses $0.45.
You can bet on whichever script you like, but first answer one question: on September 25th, is $ONDO the beginning—or the climax?
The price path doesn’t look like a gradual grind either. For the first twenty days before September, it kept ranging at $0.33–$0.37, with volume swinging between $50M and $110M. On the 18th it was pushed above the $230M level, and on the 25th it jumped straight into the $1B bracket. Down 38.57% over the year, and 74.4% below ATH. Its current identity is “RWA beta yanked up from a deep pit”—not an all-time-high narrative.
I don’t rule out either of the two explanations. One is that real money priced it early: as long as there’s meaningful progress on the compliance side, the narrative around tokenized treasuries can run. $ONDO is a rare shell that can accommodate institutional-sized liquidity, and #41 ’s rank is big enough without being too cumbersome. The confirmation signal is that during a pullback, volume doesn’t collapse—price holds above $0.45—and spot trading is leading.
The other is a one-day repricing driven by leverage squeeze. If most of the $1.26B is contracts and the funding rate turns positive and longs get crowded, the give-back is often just as fast. The invalidation signal is straightforward: volume drops back below $300M, and it loses $0.45.
You can bet on whichever script you like, but first answer one question: on September 25th, is $ONDO the beginning—or the climax?
44
·
--
** How You Can Profit from Rising Altcoins Right Now – Binance Square GuideOndo (ONDOUSDT) is trending right now!
Rank: #41
** --- ### Step 1 – “Measure Market Heat”: Identify Daily %10+ Profitable Altcoins **Why is it important?** High volatility means short-term profit opportunities. 1️⃣ Open the “Top Movers” tab on Binance Square. 2️⃣ Take note of coins that show an increase of **%10** or more within 24 hours. - **** – %16.17, price **5.066 USDT** - **** – %14.61, price **14.041 USDT** - **** – %10.23, price **9.888 USDT** 🖼️ *Visual hint:* In the price chart of these coins, you will frequently see **“ascending channel”** (rising channel) or **“bull flag”** (bull flag) formations. Open the chart and mark these patterns. --- ### Step 2 – Extract the “Support/Resistance” Lines **Why is it important?** It shows where the price will likely pause and where it might bounce back from. 1️⃣ For each coin, open the 4–6 hour (4H) chart. 2️⃣ **Support:** Connect the lowest price points (example ≈ 4.36 USDT). 3️⃣ **Resistance:** Connect the highest price points (example ≈ 14.22 USDT). 🖼️ *Visual hint:* If the price breaks below the support line, you get a **“breakdown”** signal; if it breaks above, you get a **“breakout”** signal. --- ### Step 3 – Analyze “Volume” and “Price Change” Together **Why is it important?** High volume indicates that the move is sustainable. | Coin | 24h % Change | Volume (USDT) | |------|--------------|--------------| | | **+16.17%** | **279,099,940** | | | **+14.61%** | **85,833,920** | | | **+10.23%** | **88,303,238** | 🔎 **Practical example:** ’in fi
** How You Can Profit from Rising Altcoins Right Now – Binance Square Guide
Ondo (ONDOUSDT) is trending right now!
Rank: #41
** --- ### Step 1 – “Measure Market Heat”: Identify Daily %10+ Profitable Altcoins **Why is it important?** High volatility means short-term profit opportunities. 1️⃣ Open the “Top Movers” tab on Binance Square. 2️⃣ Take note of coins that show an increase of **%10** or more within 24 hours. - **** – %16.17, price **5.066 USDT** - **** – %14.61, price **14.041 USDT** - **** – %10.23, price **9.888 USDT** 🖼️ *Visual hint:* In the price chart of these coins, you will frequently see **“ascending channel”** (rising channel) or **“bull flag”** (bull flag) formations. Open the chart and mark these patterns. --- ### Step 2 – Extract the “Support/Resistance” Lines **Why is it important?** It shows where the price will likely pause and where it might bounce back from. 1️⃣ For each coin, open the 4–6 hour (4H) chart. 2️⃣ **Support:** Connect the lowest price points (example ≈ 4.36 USDT). 3️⃣ **Resistance:** Connect the highest price points (example ≈ 14.22 USDT). 🖼️ *Visual hint:* If the price breaks below the support line, you get a **“breakdown”** signal; if it breaks above, you get a **“breakout”** signal. --- ### Step 3 – Analyze “Volume” and “Price Change” Together **Why is it important?** High volume indicates that the move is sustainable. | Coin | 24h % Change | Volume (USDT) | |------|--------------|--------------| | | **+16.17%** | **279,099,940** | | | **+14.61%** | **85,833,920** | | | **+10.23%** | **88,303,238** | 🔎 **Practical example:** ’in fi
Rank: #41
** --- ### Step 1 – “Measure Market Heat”: Identify Daily %10+ Profitable Altcoins **Why is it important?** High volatility means short-term profit opportunities. 1️⃣ Open the “Top Movers” tab on Binance Square. 2️⃣ Take note of coins that show an increase of **%10** or more within 24 hours. - **** – %16.17, price **5.066 USDT** - **** – %14.61, price **14.041 USDT** - **** – %10.23, price **9.888 USDT** 🖼️ *Visual hint:* In the price chart of these coins, you will frequently see **“ascending channel”** (rising channel) or **“bull flag”** (bull flag) formations. Open the chart and mark these patterns. --- ### Step 2 – Extract the “Support/Resistance” Lines **Why is it important?** It shows where the price will likely pause and where it might bounce back from. 1️⃣ For each coin, open the 4–6 hour (4H) chart. 2️⃣ **Support:** Connect the lowest price points (example ≈ 4.36 USDT). 3️⃣ **Resistance:** Connect the highest price points (example ≈ 14.22 USDT). 🖼️ *Visual hint:* If the price breaks below the support line, you get a **“breakdown”** signal; if it breaks above, you get a **“breakout”** signal. --- ### Step 3 – Analyze “Volume” and “Price Change” Together **Why is it important?** High volume indicates that the move is sustainable. | Coin | 24h % Change | Volume (USDT) | |------|--------------|--------------| | | **+16.17%** | **279,099,940** | | | **+14.61%** | **85,833,920** | | | **+10.23%** | **88,303,238** | 🔎 **Practical example:** ’in fi
31

·
--
ONDO SURGES WITH BULLISH MOMENTUM 🚀📈
The 27% rally in $ONDO is anchored in a break of the 4‑hour order block that held the $0.408‑$0.426 range, thrusting the token past $0.525 with a volume surge to $747 M 🔥. CoinGecko’s #41 ranking adds a social‑bias catalyst, while market liquidity is re‑routing capital into altcoins.
Price action now rides a steep upward channel, testing the $0.52665 resistance that aligns with the prior swing high. A retest of the $0.468 mid‑range would likely solidify the bullish bias, and order‑flow imbalance suggests further upside pressure as institutional takers chase the breakout. The next hurdle sits near $0.540, where a confluence of volume nodes and a supply dip could fuel a second wave 📈.
Momentum acceleration is evident in the tightening of the 1‑hour ATR and a rising imbalance on the buy side, hinting that the thrust may extend beyond today’s session. Should the token hold above $0.525, structural momentum points toward a multi‑day rally rather than a flash spike 🚀.
Levels to monitor:
Watching support around $0.408
Structure suggests resistance near $0.540
Mid range area: $0.468
DYOR
Follow for Updates
#ONDO #GENERAL_ALTCOIN #CryptoTrending #BinanceSquare
ONDO SURGES WITH BULLISH MOMENTUM 🚀📈
The 27% rally in $ONDO is anchored in a break of the 4‑hour order block that held the $0.408‑$0.426 range, thrusting the token past $0.525 with a volume surge to $747 M 🔥. CoinGecko’s #41 ranking adds a social‑bias catalyst, while market liquidity is re‑routing capital into altcoins.
Price action now rides a steep upward channel, testing the $0.52665 resistance that aligns with the prior swing high. A retest of the $0.468 mid‑range would likely solidify the bullish bias, and order‑flow imbalance suggests further upside pressure as institutional takers chase the breakout. The next hurdle sits near $0.540, where a confluence of volume nodes and a supply dip could fuel a second wave 📈.
Momentum acceleration is evident in the tightening of the 1‑hour ATR and a rising imbalance on the buy side, hinting that the thrust may extend beyond today’s session. Should the token hold above $0.525, structural momentum points toward a multi‑day rally rather than a flash spike 🚀.
Levels to monitor:
Watching support around $0.408
Structure suggests resistance near $0.540
Mid range area: $0.468
DYOR
Follow for Updates
#ONDO #GENERAL_ALTCOIN #CryptoTrending #BinanceSquare
The 27% rally in $ONDO is anchored in a break of the 4‑hour order block that held the $0.408‑$0.426 range, thrusting the token past $0.525 with a volume surge to $747 M 🔥. CoinGecko’s #41 ranking adds a social‑bias catalyst, while market liquidity is re‑routing capital into altcoins.
Price action now rides a steep upward channel, testing the $0.52665 resistance that aligns with the prior swing high. A retest of the $0.468 mid‑range would likely solidify the bullish bias, and order‑flow imbalance suggests further upside pressure as institutional takers chase the breakout. The next hurdle sits near $0.540, where a confluence of volume nodes and a supply dip could fuel a second wave 📈.
Momentum acceleration is evident in the tightening of the 1‑hour ATR and a rising imbalance on the buy side, hinting that the thrust may extend beyond today’s session. Should the token hold above $0.525, structural momentum points toward a multi‑day rally rather than a flash spike 🚀.
Levels to monitor:
Watching support around $0.408
Structure suggests resistance near $0.540
Mid range area: $0.468
DYOR
Follow for Updates
#ONDO #GENERAL_ALTCOIN #CryptoTrending #BinanceSquare
26
·
--
** How to Earn Profit Using Daily Top-Gainers – Binance Square GuideOndo (ONDOUSDT) is trending right now!
Rank: #41
** --- ### Step 1 – Get the Daily “Top Movers” List **What to do?** On Binance Square, go to the **Spot → Market → Top Movers** tab and display the pairs that have risen the most within the last 24 hours (e.g., LTC/USDT, LINK/USDT, NEAR/USDT). **Why is it important?** Assets showing the highest % increase offer a “fresh opportunity” in terms of liquidity and volatility. As long as the volume is high (50M+ LTC, 7M+ LINK), slippage stays low. **Practical tip:** - 📱 On mobile, click the **“🔔”** icon to set a **price alert**; for example, when the price approaches 72 USDT, you’ll get a notification. --- ### Step 2 – Price and Volume Analysis **How?** Turn the data you gathered into a table: | Pair | Current price | %24 increase | 24h volume (USDT) | |------|---------------|----------|------------------| | | **71.35** | **+14.82 %** | **150 631 626** | | | **13.33** | **+8.09 %** | **47 569 616** | | | **4.64** | **+7.63 %** | **249 437 353** | | | **1.79** | **+5.91 %** | **2 808 315** | | | **1.16** | **+5.26 %** | **12 906 642** | **Why is it important?** - **Price increase**: Shows the strength of momentum. - **Volume**: Proof of genuine buy-sell interest; a % increase on low volume can be a fake “pump.” **Concrete example:** It rose from **62.14 USDT** to **71.35 USDT** (+14.8%). Within 24 hours, **2.16M LTC** was traded → high liquidity, easy entries and exits. --- ### Step 3 – Identify a “Pattern” on the Chart **How?** On Binance Square, **Charts → Advanced*
** How to Earn Profit Using Daily Top-Gainers – Binance Square Guide
Ondo (ONDOUSDT) is trending right now!
Rank: #41
** --- ### Step 1 – Get the Daily “Top Movers” List **What to do?** On Binance Square, go to the **Spot → Market → Top Movers** tab and display the pairs that have risen the most within the last 24 hours (e.g., LTC/USDT, LINK/USDT, NEAR/USDT). **Why is it important?** Assets showing the highest % increase offer a “fresh opportunity” in terms of liquidity and volatility. As long as the volume is high (50M+ LTC, 7M+ LINK), slippage stays low. **Practical tip:** - 📱 On mobile, click the **“🔔”** icon to set a **price alert**; for example, when the price approaches 72 USDT, you’ll get a notification. --- ### Step 2 – Price and Volume Analysis **How?** Turn the data you gathered into a table: | Pair | Current price | %24 increase | 24h volume (USDT) | |------|---------------|----------|------------------| | | **71.35** | **+14.82 %** | **150 631 626** | | | **13.33** | **+8.09 %** | **47 569 616** | | | **4.64** | **+7.63 %** | **249 437 353** | | | **1.79** | **+5.91 %** | **2 808 315** | | | **1.16** | **+5.26 %** | **12 906 642** | **Why is it important?** - **Price increase**: Shows the strength of momentum. - **Volume**: Proof of genuine buy-sell interest; a % increase on low volume can be a fake “pump.” **Concrete example:** It rose from **62.14 USDT** to **71.35 USDT** (+14.8%). Within 24 hours, **2.16M LTC** was traded → high liquidity, easy entries and exits. --- ### Step 3 – Identify a “Pattern” on the Chart **How?** On Binance Square, **Charts → Advanced*
Rank: #41
** --- ### Step 1 – Get the Daily “Top Movers” List **What to do?** On Binance Square, go to the **Spot → Market → Top Movers** tab and display the pairs that have risen the most within the last 24 hours (e.g., LTC/USDT, LINK/USDT, NEAR/USDT). **Why is it important?** Assets showing the highest % increase offer a “fresh opportunity” in terms of liquidity and volatility. As long as the volume is high (50M+ LTC, 7M+ LINK), slippage stays low. **Practical tip:** - 📱 On mobile, click the **“🔔”** icon to set a **price alert**; for example, when the price approaches 72 USDT, you’ll get a notification. --- ### Step 2 – Price and Volume Analysis **How?** Turn the data you gathered into a table: | Pair | Current price | %24 increase | 24h volume (USDT) | |------|---------------|----------|------------------| | | **71.35** | **+14.82 %** | **150 631 626** | | | **13.33** | **+8.09 %** | **47 569 616** | | | **4.64** | **+7.63 %** | **249 437 353** | | | **1.79** | **+5.91 %** | **2 808 315** | | | **1.16** | **+5.26 %** | **12 906 642** | **Why is it important?** - **Price increase**: Shows the strength of momentum. - **Volume**: Proof of genuine buy-sell interest; a % increase on low volume can be a fake “pump.” **Concrete example:** It rose from **62.14 USDT** to **71.35 USDT** (+14.8%). Within 24 hours, **2.16M LTC** was traded → high liquidity, easy entries and exits. --- ### Step 3 – Identify a “Pattern” on the Chart **How?** On Binance Square, **Charts → Advanced*
65

·
--
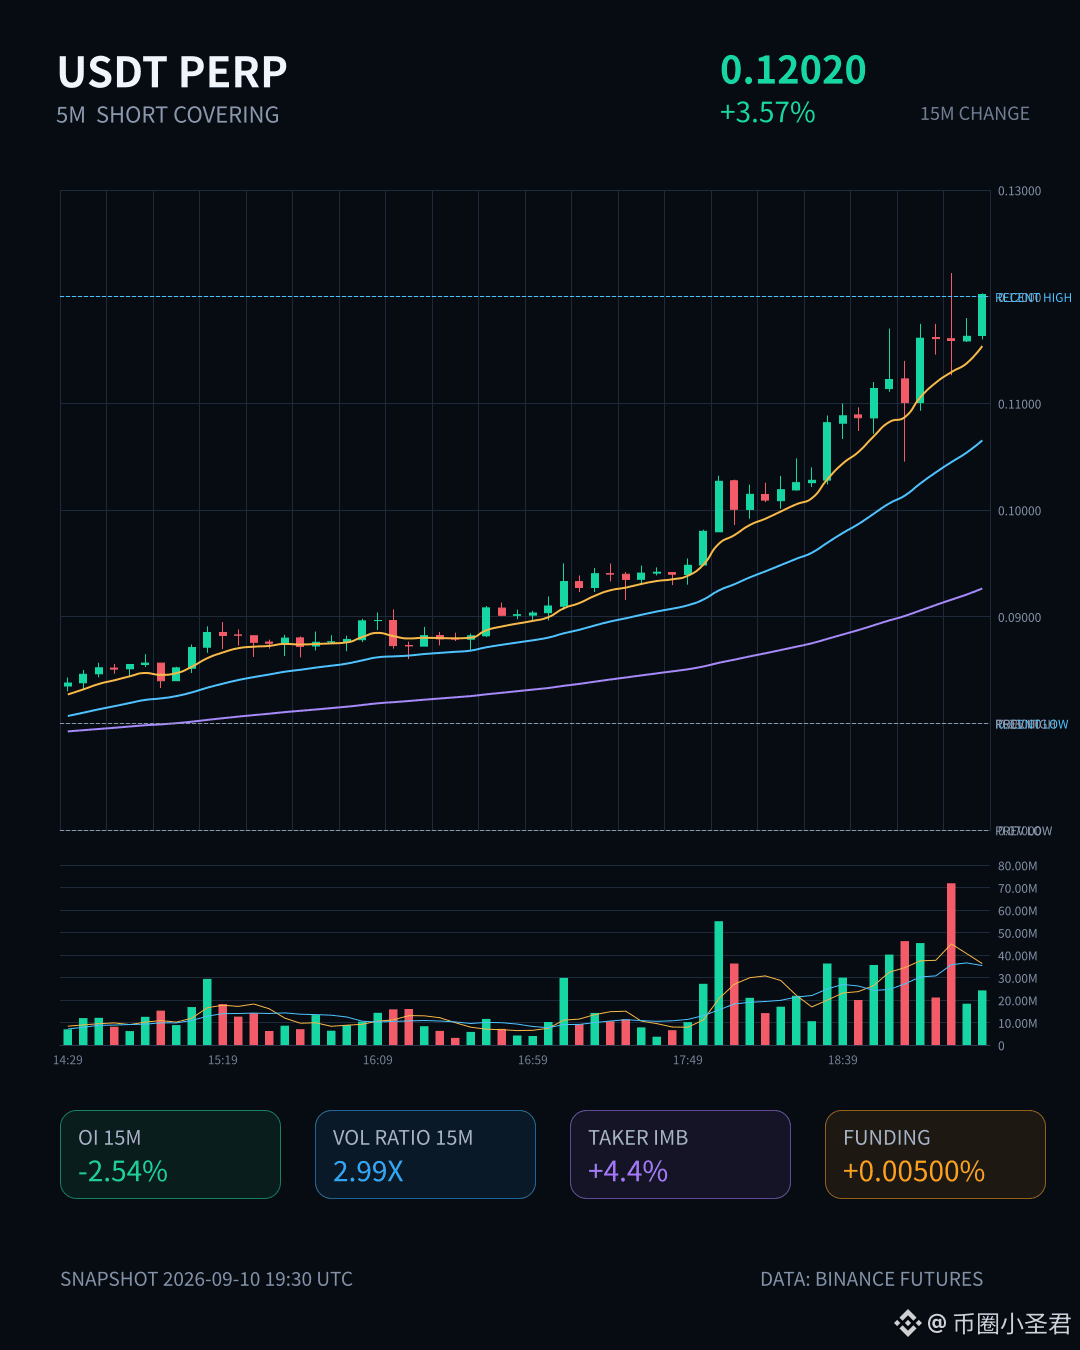
$Bull comes in hard this 15m move—up 3.57% straight away, trading volume shot up to 2.99x, but the OI for 15m actually fell by 2.54%. That’s a textbook short-covering order flow, not fresh long entries.
The OI on the 1h timeframe is still rising though—nominal 5.65M, +17.46%—which suggests someone is willing to take orders at these levels. Active traded gap is 4.4%, buy/sell ratio 1.09, slightly buy-dominant, but not to the point of frantic chasing.
I’ve been burned by this kind of structure before: the shorts close and push the price up, and once they’re done covering it tends to leak. The 24h turnover at 169M isn’t small, and the depth is there, but the OI abnormal percentile is only 47%, ranking #41 across the whole pool—still not at an extremely crowded level.
Chasing higher—be careful. Don’t end up being the last baton you hand to the shorts. Watch whether it can hold the level; otherwise it could be just a single pin’s worth of downside.
$Bull comes in hard this 15m move—up 3.57% straight away, trading volume shot up to 2.99x, but the OI for 15m actually fell by 2.54%. That’s a textbook short-covering order flow, not fresh long entries.
The OI on the 1h timeframe is still rising though—nominal 5.65M, +17.46%—which suggests someone is willing to take orders at these levels. Active traded gap is 4.4%, buy/sell ratio 1.09, slightly buy-dominant, but not to the point of frantic chasing.
I’ve been burned by this kind of structure before: the shorts close and push the price up, and once they’re done covering it tends to leak. The 24h turnover at 169M isn’t small, and the depth is there, but the OI abnormal percentile is only 47%, ranking #41 across the whole pool—still not at an extremely crowded level.
Chasing higher—be careful. Don’t end up being the last baton you hand to the shorts. Watch whether it can hold the level; otherwise it could be just a single pin’s worth of downside.
The OI on the 1h timeframe is still rising though—nominal 5.65M, +17.46%—which suggests someone is willing to take orders at these levels. Active traded gap is 4.4%, buy/sell ratio 1.09, slightly buy-dominant, but not to the point of frantic chasing.
I’ve been burned by this kind of structure before: the shorts close and push the price up, and once they’re done covering it tends to leak. The 24h turnover at 169M isn’t small, and the depth is there, but the OI abnormal percentile is only 47%, ranking #41 across the whole pool—still not at an extremely crowded level.
Chasing higher—be careful. Don’t end up being the last baton you hand to the shorts. Watch whether it can hold the level; otherwise it could be just a single pin’s worth of downside.
56


·
--
$MSTRB is available now and the spot market starts to accelerate—can the volume sustain, and is it more critical?
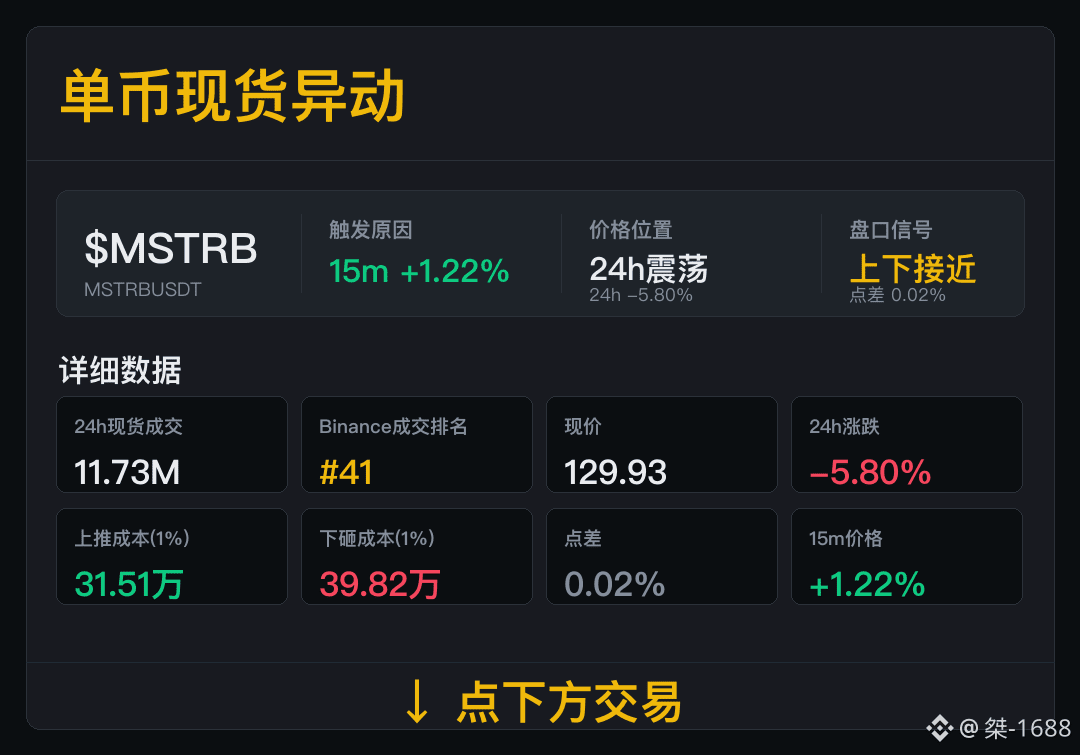
Spot成交 11.73M, Binance成交排名 #41. For now, observe by participating in the spot market first; when volume weakens, downgrade in time.
Now 24h change -5.80%; spread 0.02%, the push-up cost is 315,100, and the sell-down cost is 398,200. Going forward, if the spread remains stable and trading continues, then order-book information will have more reference value.
If trading volume weakens or the spread widens, short-term signals should all be downgraded.
$MSTRB is available now and the spot market starts to accelerate—can the volume sustain, and is it more critical?
Spot成交 11.73M, Binance成交排名 #41. For now, observe by participating in the spot market first; when volume weakens, downgrade in time.
Now 24h change -5.80%; spread 0.02%, the push-up cost is 315,100, and the sell-down cost is 398,200. Going forward, if the spread remains stable and trading continues, then order-book information will have more reference value.
If trading volume weakens or the spread widens, short-term signals should all be downgraded.
Spot成交 11.73M, Binance成交排名 #41. For now, observe by participating in the spot market first; when volume weakens, downgrade in time.
Now 24h change -5.80%; spread 0.02%, the push-up cost is 315,100, and the sell-down cost is 398,200. Going forward, if the spread remains stable and trading continues, then order-book information will have more reference value.
If trading volume weakens or the spread widens, short-term signals should all be downgraded.
123

·
--
41% increase, but the funding rate is negative — this divergence is a bit interesting.
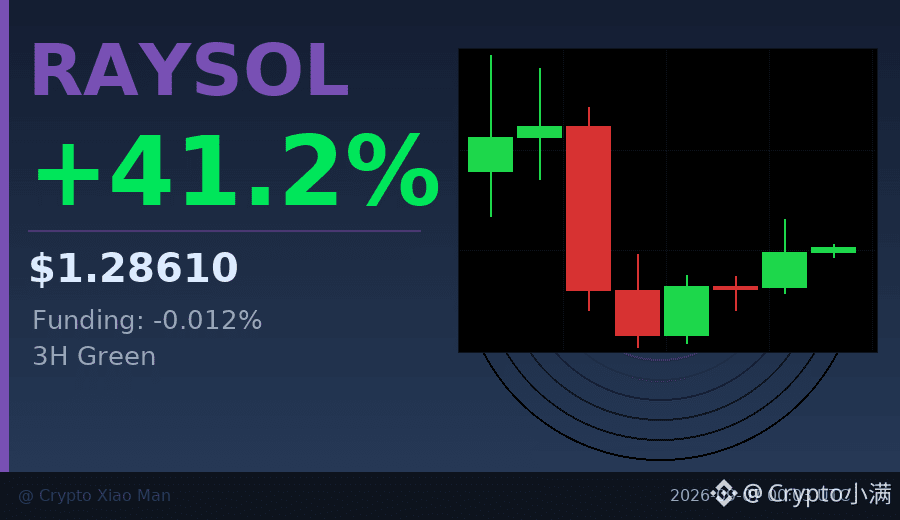
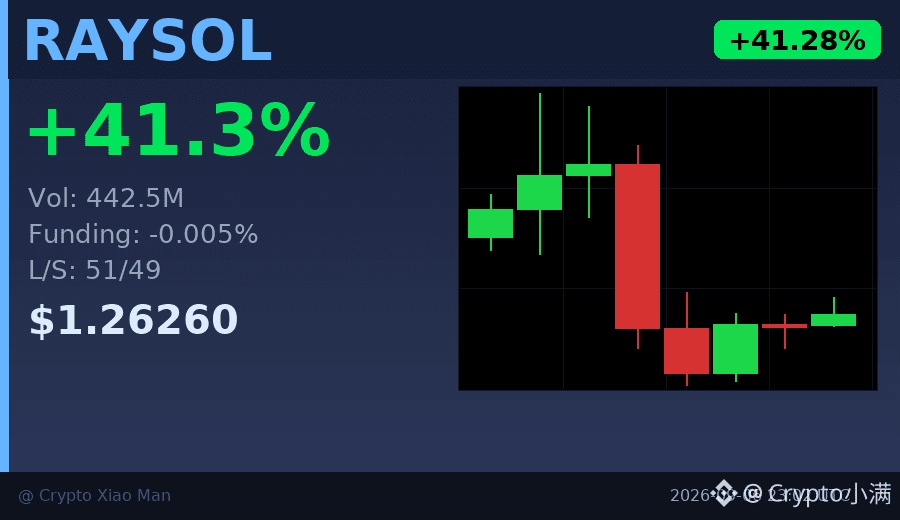
RAYSOL moved from 0.90 to 1.44 today, and has now pulled back to 1.28, with trading volume of 458 million US dollars. Normally, with a rally of this scale, longs should be fighting to pay the funding rate, but the current funding rate is -0.012%, meaning shorts are still paying longs.
The hourly chart has already closed three consecutive green candles, which shows that buying pressure is not just a short-lived spike, but a sustained inflow. The long-short ratio is 53% to 47%, so it isn't extremely crowded either.
This kind of divergence is either true strength (shorts refusing to give up), or a spot-driven move that futures haven't caught up with. I lean toward the former — if the funding rate turns positive later and the price holds steady, the trend may not be over yet.
$RAYSOL #资金费率背离 #41%
Click the small card below to quickly view the market 👇
41% increase, but the funding rate is negative — this divergence is a bit interesting.
RAYSOL moved from 0.90 to 1.44 today, and has now pulled back to 1.28, with trading volume of 458 million US dollars. Normally, with a rally of this scale, longs should be fighting to pay the funding rate, but the current funding rate is -0.012%, meaning shorts are still paying longs.
The hourly chart has already closed three consecutive green candles, which shows that buying pressure is not just a short-lived spike, but a sustained inflow. The long-short ratio is 53% to 47%, so it isn't extremely crowded either.
This kind of divergence is either true strength (shorts refusing to give up), or a spot-driven move that futures haven't caught up with. I lean toward the former — if the funding rate turns positive later and the price holds steady, the trend may not be over yet.
$RAYSOL #资金费率背离 #41%
Click the small card below to quickly view the market 👇
RAYSOL moved from 0.90 to 1.44 today, and has now pulled back to 1.28, with trading volume of 458 million US dollars. Normally, with a rally of this scale, longs should be fighting to pay the funding rate, but the current funding rate is -0.012%, meaning shorts are still paying longs.
The hourly chart has already closed three consecutive green candles, which shows that buying pressure is not just a short-lived spike, but a sustained inflow. The long-short ratio is 53% to 47%, so it isn't extremely crowded either.
This kind of divergence is either true strength (shorts refusing to give up), or a spot-driven move that futures haven't caught up with. I lean toward the former — if the funding rate turns positive later and the price holds steady, the trend may not be over yet.
$RAYSOL #资金费率背离 #41%
Click the small card below to quickly view the market 👇
112
·
--
41% gain, but the funding rate is negative — that’s unusual.
RAYSOL’s trading volume today surged to $440 million, with the price rising from 0.89 to 1.44 before pulling back to 1.26.
Most people would chase a move like this, but in practice, nearly half of the open positions are short.
I think this suggests two things: first, this rally is mainly driven by spot buying, not leveraged positioning;
second, the 8-hour trend is already weakening, and those buying at the top are starting to hesitate.
In a market like this, I usually wouldn’t rush in. I’d wait for it to stabilize before taking a look.
$RAYSOL #资金费率背离 #41%
Click the card below to quickly view the market👇
41% gain, but the funding rate is negative — that’s unusual.
RAYSOL’s trading volume today surged to $440 million, with the price rising from 0.89 to 1.44 before pulling back to 1.26.
Most people would chase a move like this, but in practice, nearly half of the open positions are short.
I think this suggests two things: first, this rally is mainly driven by spot buying, not leveraged positioning;
second, the 8-hour trend is already weakening, and those buying at the top are starting to hesitate.
In a market like this, I usually wouldn’t rush in. I’d wait for it to stabilize before taking a look.
$RAYSOL #资金费率背离 #41%
Click the card below to quickly view the market👇
RAYSOL’s trading volume today surged to $440 million, with the price rising from 0.89 to 1.44 before pulling back to 1.26.
Most people would chase a move like this, but in practice, nearly half of the open positions are short.
I think this suggests two things: first, this rally is mainly driven by spot buying, not leveraged positioning;
second, the 8-hour trend is already weakening, and those buying at the top are starting to hesitate.
In a market like this, I usually wouldn’t rush in. I’d wait for it to stabilize before taking a look.
$RAYSOL #资金费率背离 #41%
Click the card below to quickly view the market👇
16
·
--
Behind the 41% gain, the funding rate is negative—what does that mean?
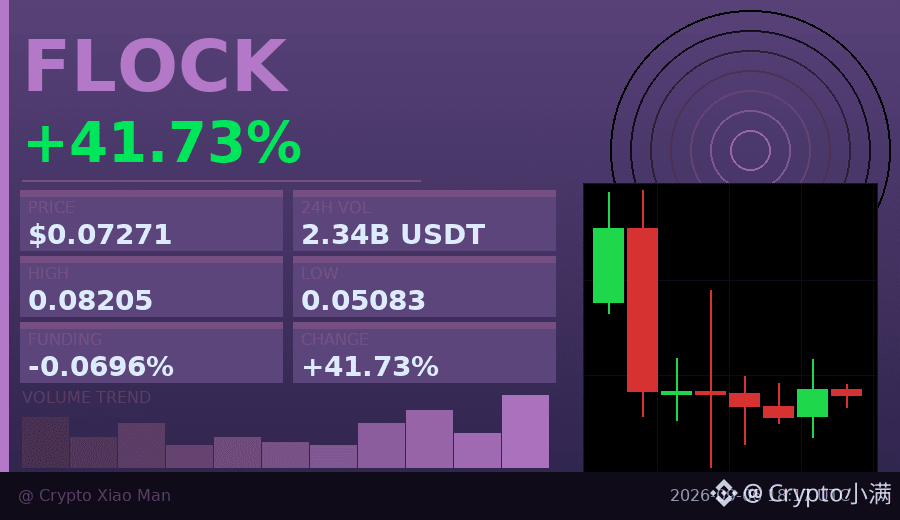
FLOCK surged 41.73% today, rising to 0.082 before pulling back to 0.0727. But interestingly, the funding rate is -0.069%, meaning shorts are still paying longs.
Trading volume was $234 million, which is not small. However, the overall 8-hour trend weakened, and the high level did not hold.
Longs account for 56%, so the positioning is not extremely crowded. My take: this rally was partly driven by short stop-losses, but there is not enough willingness to chase the price higher.
If funding stays negative, it means some traders are still willing to short despite the price surge—either because they think it is too high, or because they are hedging.
$FLOCK #资金费率背离 #41%
Click the small card below to quickly view the market👇
Behind the 41% gain, the funding rate is negative—what does that mean?
FLOCK surged 41.73% today, rising to 0.082 before pulling back to 0.0727. But interestingly, the funding rate is -0.069%, meaning shorts are still paying longs.
Trading volume was $234 million, which is not small. However, the overall 8-hour trend weakened, and the high level did not hold.
Longs account for 56%, so the positioning is not extremely crowded. My take: this rally was partly driven by short stop-losses, but there is not enough willingness to chase the price higher.
If funding stays negative, it means some traders are still willing to short despite the price surge—either because they think it is too high, or because they are hedging.
$FLOCK #资金费率背离 #41%
Click the small card below to quickly view the market👇
FLOCK surged 41.73% today, rising to 0.082 before pulling back to 0.0727. But interestingly, the funding rate is -0.069%, meaning shorts are still paying longs.
Trading volume was $234 million, which is not small. However, the overall 8-hour trend weakened, and the high level did not hold.
Longs account for 56%, so the positioning is not extremely crowded. My take: this rally was partly driven by short stop-losses, but there is not enough willingness to chase the price higher.
If funding stays negative, it means some traders are still willing to short despite the price surge—either because they think it is too high, or because they are hedging.
$FLOCK #资金费率背离 #41%
Click the small card below to quickly view the market👇
12
·
--
41% single-day gain, ARB surprised everyone today.
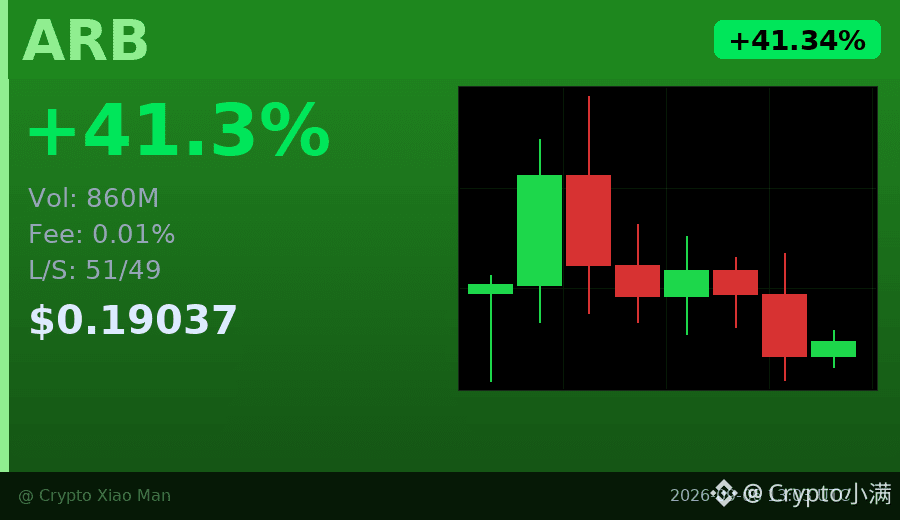
The price surged from 0.13 to 0.20, and trading volume hit 860 million USDT, but the funding rate was only 0.01%, meaning almost no one was paying a premium to go long.
More interestingly, the long/short ratio is 51%/49%, nearly evenly split — this suggests the rally wasn’t driven by leverage, but more like spot buyers quietly accumulating.
The candlestick chart shows short-term consolidation in the 0.19-0.20 range. If it holds above 0.195, the next move may test 0.21; if it falls below 0.188, watch out for a pullback to 0.17.
This kind of low-fee, high-volume rally is often more solid than a leverage-driven pump.
$ARB #ARB #41%
Click the small card below to quickly check the market👇
41% single-day gain, ARB surprised everyone today.
The price surged from 0.13 to 0.20, and trading volume hit 860 million USDT, but the funding rate was only 0.01%, meaning almost no one was paying a premium to go long.
More interestingly, the long/short ratio is 51%/49%, nearly evenly split — this suggests the rally wasn’t driven by leverage, but more like spot buyers quietly accumulating.
The candlestick chart shows short-term consolidation in the 0.19-0.20 range. If it holds above 0.195, the next move may test 0.21; if it falls below 0.188, watch out for a pullback to 0.17.
This kind of low-fee, high-volume rally is often more solid than a leverage-driven pump.
$ARB #ARB #41%
Click the small card below to quickly check the market👇
The price surged from 0.13 to 0.20, and trading volume hit 860 million USDT, but the funding rate was only 0.01%, meaning almost no one was paying a premium to go long.
More interestingly, the long/short ratio is 51%/49%, nearly evenly split — this suggests the rally wasn’t driven by leverage, but more like spot buyers quietly accumulating.
The candlestick chart shows short-term consolidation in the 0.19-0.20 range. If it holds above 0.195, the next move may test 0.21; if it falls below 0.188, watch out for a pullback to 0.17.
This kind of low-fee, high-volume rally is often more solid than a leverage-driven pump.
$ARB #ARB #41%
Click the small card below to quickly check the market👇
72

·
--
Bullish
60-SECOND ALPHA #41 | $JTO
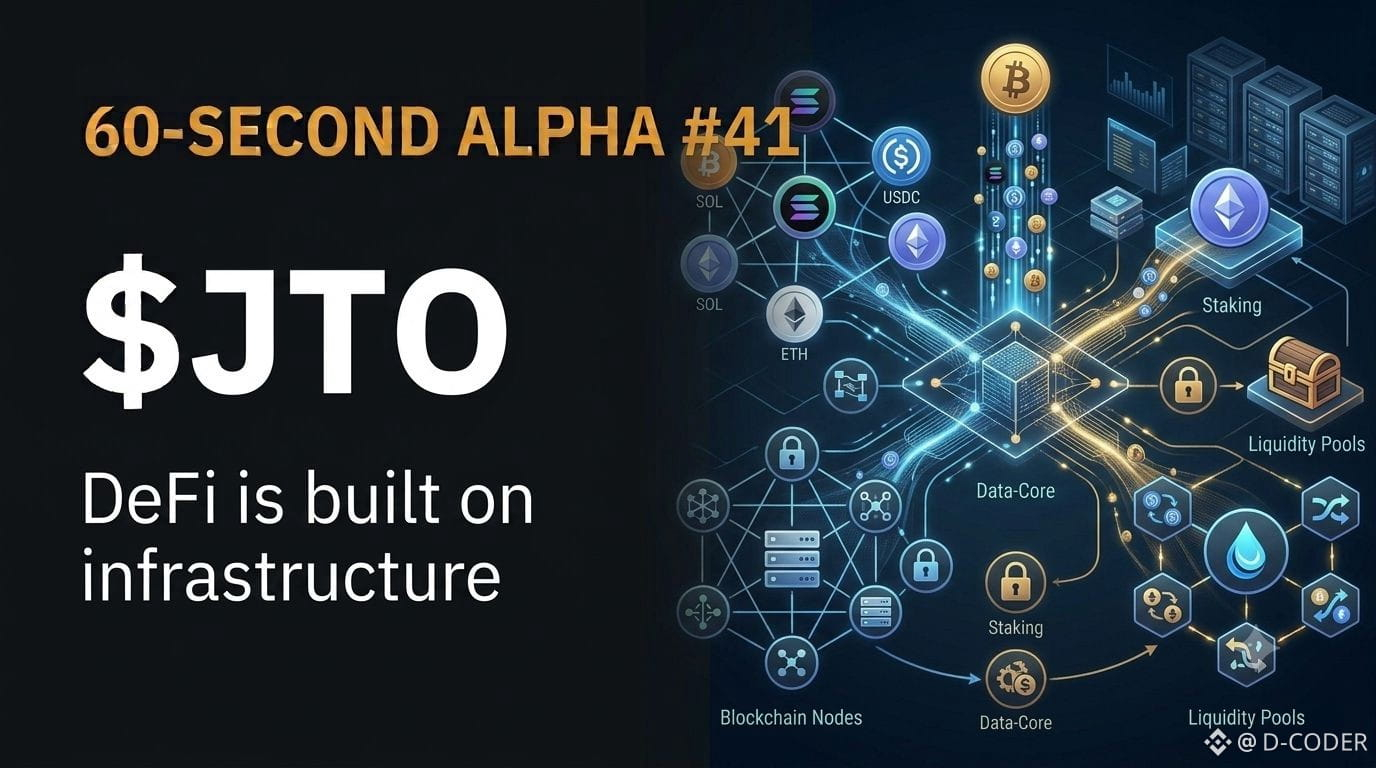
$JTO is connected to the Jito ecosystem on Solana, where staking, liquidity and MEV infrastructure come together. That makes it a good example of how a token can sit inside a much larger DeFi system.
Alpha: Don't judge a DeFi token only by its ticker. Understand the infrastructure behind it.
{future}(JTOUSDT)
60-SECOND ALPHA #41 | $JTO
$JTO is connected to the Jito ecosystem on Solana, where staking, liquidity and MEV infrastructure come together. That makes it a good example of how a token can sit inside a much larger DeFi system.
Alpha: Don't judge a DeFi token only by its ticker. Understand the infrastructure behind it.
$JTO is connected to the Jito ecosystem on Solana, where staking, liquidity and MEV infrastructure come together. That makes it a good example of how a token can sit inside a much larger DeFi system.
Alpha: Don't judge a DeFi token only by its ticker. Understand the infrastructure behind it.
100
Log in to explore more content
Join global crypto users on Binance Square
⚡️ Get latest and useful information about crypto.
💬 Trusted by the world’s largest crypto exchange.
👍 Discover real insights from verified creators.
Email / Phone number
Trending Topics
1
#BinanceLaunchesBinanceIntelligence
218,583 views
1,954 Discussing
2
#StriveBuys2000BTCFor$169M
9,689 views
92 Discussing
3
#EvernorthXRPTreasuryCompletesSPACMerger
116,746 views
1,170 Discussing
4
#ADAGains10%Above$0.27
52,569 views
249 Discussing
5
#ETHUp70%InQ3ButLiquidityFalls
313,931 views
2,167 Discussing
6
#EthStakingExitQueueHits2026High
124,005 views
1,438 Discussing
7
#FedOctoberHoldOdds82.3%
133,632 views
1,372 Discussing
8
#Nikkei225Jumps2.5%ToThreeMonthHigh
118,965 views
1,521 Discussing
9
#CircleMints$2.75BUSDCOnSolanaIn7Days
3,157 views
63 Discussing
10
#DriftHackVictimsBeginClaims
239,244 views
2,217 Discussing